Grundläggande statistik
| Institutionella ägare | 106 total, 106 long only, 0 short only, 0 long/short - change of 10,42% MRQ |
| Genomsnittlig portföljallokering | 0.1883 % - change of −6,67% MRQ |
| Institutionella aktier (lång) | 10 219 335 (ex 13D/G) - change of 0,09MM shares 0,94% MRQ |
| Institutionellt värde (lång) | $ 125 570 USD ($1000) |
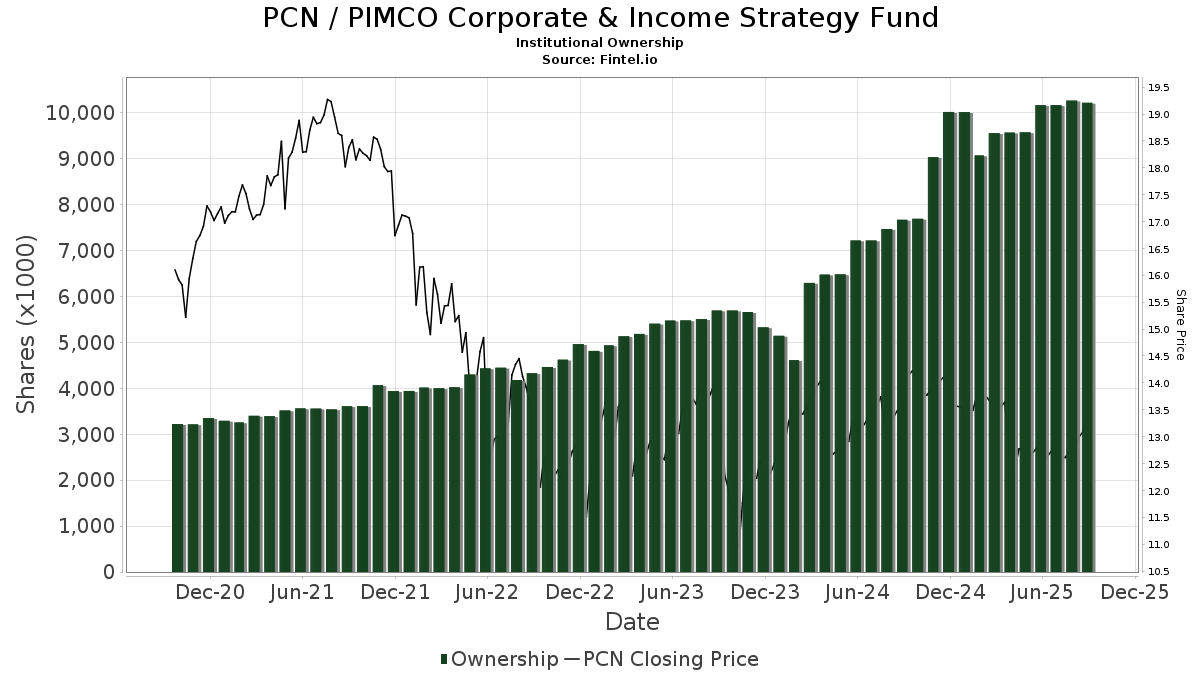
Institutionellt ägande och aktieägare
PIMCO Corporate & Income Strategy Fund (US:PCN) har 106 Institutionella ägare och aktieägare som har lämnat in 13D/G- eller 13F-formulär till Securities Exchange Commission (SEC). Dessa institut innehar totalt 10,219,335 aktier. Största aktieägare inkluderar Guggenheim Capital Llc, Mission Hills Financial Advisory, LLC, Morgan Stanley, Principal Securities, Inc., Ghe, Llc, LPL Financial LLC, Invesco Ltd., PCEF - Invesco CEF Income Composite ETF, Elevated Capital Advisors, LLC, and Cetera Investment Advisers .
PIMCO Corporate & Income Strategy Fund (NYSE:PCN) Institutionell ägarstruktur visar institutioners och fonders nuvarande positioner i företaget, samt de senaste förändringarna i positionernas storlek. Större aktieägare kan vara enskilda investerare, fonder, hedgefonder eller institutioner. Bilaga 13D visar att investeraren äger (eller ägde) mer än 5% av företaget och avser (eller avsåg) att aktivt eftersträva en förändring av affärsstrategin. Schedule 13G indikerar en passiv investering på över 5%.
The share price as of September 22, 2025 is 13,36 / share. Previously, on September 23, 2024, the share price was 14,11 / share. This represents a decline of 5,32% over that period.
Fondsentimentets poäng
Fondsentimentet poängen(fka Ägarackumulation-poäng) visar vilka aktier som är mest köpta av fonder. Det är resultatet av en sofistikerad kvantitativ flerfaktormodell som identifierar företag med de högsta nivåerna av institutionell ackumulering. Poängsättningsmodellen använder en kombination av den totala ökningen av redovisade ägare, förändringarna i portföljallokeringarna för dessa ägare och andra mått. Siffran sträcker sig från 0 till 100, där högre siffror indikerar en högre nivå av ackumulering i förhållande till sina konkurrenter, och 50 är genomsnittet.
Uppdateringsfrekvens: Dagligen
Se Ownership Explorer, som innehåller en lista över de högst rankade företagen.
AI+ Ask Fintel’s AI assistant about PIMCO Corporate & Income Strategy Fund.
Thinking of good questions…
Institutionell sälj/köp-kvot
Förutom att rapportera vanliga eget kapital- och skuldemissioner måste institutioner med mer än 100MM tillgångar under förvaltning också avslöja sina innehav av sälj- och köpoptioner. Eftersom säljoptioner i allmänhet indikerar ett negativt sentiment och köpoptioner indikerar ett positivt sentiment, kan vi få en uppfattning om det övergripande institutionella sentimentet genom att plotta förhållandet mellan säljoptioner och köpoptioner. Diagrammet till höger visar det historiska förhållandet mellan sälj- och köpoptioner för detta instrument.
Genom att använda sälj/köp-kvoten som en indikator på aktieägarnas sentiment undviker man en av de största bristerna med att använda det totala institutionella ägandet, nämligen att en betydande del av de förvaltade tillgångarna investeras passivt för att följa index. Passivt förvaltade fonder köper vanligtvis inte optioner, så indikatorn för sälj/köp-kvoten ger en bättre bild av stämningen i aktivt förvaltade fonder.
13F- och NPORT-arkiveringar
Detaljer om 13F-arkiveringar är gratis. Detaljer om NP-arkiveringar kräver ett premiummedlemskap. Gröna rader indikerar nya positioner. Röda rader indikerar stängda positioner. Klicka på länk symbolen för att se hela transaktionshistoriken.
Uppgradera
för att låsa upp premiumdata och exportera till Excel ![]() .
.
| Fil Datum | Källa | Investerare | Typ | Genomsnittligt pris (beräknat) |
Aktier | Δ Aktier (%) |
Rapporterat värde (1000 USD) |
Δ Värde (%) |
Portföljallokering (%) |
|
|---|---|---|---|---|---|---|---|---|---|---|
| 2025-07-01 | 13F | Harbor Investment Advisory, Llc | 2 071 | 0,00 | 26 | −7,14 | ||||
| 2025-08-08 | 13F | Collaborative Wealth Managment Inc. | 10 071 | −5,15 | 128 | −11,81 | ||||
| 2025-09-05 | 13F | Ghe, Llc | 608 299 | 7,94 | 7 719 | 110 171,43 | ||||
| 2025-07-23 | 13F | Elm3 Financial Group, LLC | 32 490 | 17,33 | 412 | 9,28 | ||||
| 2025-07-21 | 13F | Ameritas Advisory Services, LLC | 3 160 | 40 | ||||||
| 2025-08-04 | 13F | Assetmark, Inc | 0 | −100,00 | 0 | |||||
| 2025-07-18 | 13F | Consolidated Portfolio Review Corp | 246 428 | 98,44 | 3 127 | 84,48 | ||||
| 2025-08-13 | 13F | Beacon Pointe Advisors, LLC | 19 777 | −13,61 | 251 | −19,87 | ||||
| 2025-05-13 | 13F | Russell Investments Group, Ltd. | 0 | 0 | ||||||
| 2025-07-31 | 13F | Oppenheimer & Co Inc | 29 441 | −22,22 | 374 | −27,71 | ||||
| 2025-08-15 | 13F | WFA of San Diego, LLC | 135 | 2 | ||||||
| 2025-07-17 | 13F | Beacon Capital Management, LLC | 2 859 | 0,00 | 36 | −7,69 | ||||
| 2025-08-07 | 13F | BOK Financial Private Wealth, Inc. | 3 412 | 0,00 | 44 | −6,52 | ||||
| 2025-04-03 | 13F | Central Pacific Bank - Trust Division | 0 | −100,00 | 0 | |||||
| 2025-07-07 | 13F | Thurston, Springer, Miller, Herd & Titak, Inc. | 1 300 | 0,00 | 16 | −5,88 | ||||
| 2025-08-12 | 13F | Steward Partners Investment Advisory, Llc | 12 281 | 156 | ||||||
| 2025-07-30 | 13F | FNY Investment Advisers, LLC | 1 000 | 0,00 | 0 | |||||
| 2025-08-14 | 13F | UBS Group AG | 88 158 | 4,68 | 1 119 | −2,70 | ||||
| 2025-08-05 | 13F | Key FInancial Inc | 312 | 0,00 | 4 | −25,00 | ||||
| 2025-08-07 | 13F | Allworth Financial LP | 25 232 | 1,40 | 320 | 2,89 | ||||
| 2025-08-14 | 13F | Raymond James Financial Inc | 37 126 | −10,45 | 471 | −16,64 | ||||
| 2025-09-04 | 13F/A | Advisor Group Holdings, Inc. | 180 006 | −40,79 | 2 284 | −44,95 | ||||
| 2025-08-01 | 13F | Envestnet Asset Management Inc | 120 510 | −0,48 | 1 529 | −7,45 | ||||
| 2025-08-05 | 13F | Aviance Capital Partners, LLC | 68 858 | −3,69 | 874 | −10,46 | ||||
| 2025-08-14 | 13F | Mml Investors Services, Llc | 14 188 | 14,48 | 0 | |||||
| 2025-08-08 | 13F | Kingsview Wealth Management, LLC | 34 043 | −8,07 | 432 | −14,46 | ||||
| 2025-08-04 | 13F | Spire Wealth Management | 500 | 0,00 | 6 | 0,00 | ||||
| 2025-08-08 | 13F | Cetera Investment Advisers | 302 009 | 5,23 | 3 832 | −2,17 | ||||
| 2025-08-07 | 13F | Nwam Llc | 30 020 | −13,14 | 381 | −19,32 | ||||
| 2025-07-15 | 13F | Elevated Capital Advisors, LLC | 362 500 | 0,00 | 4 948 | 0,00 | ||||
| 2025-08-15 | 13F | First Heartland Consultants, Inc. | 14 755 | 0,00 | 187 | −6,97 | ||||
| 2025-07-28 | 13F | BRYN MAWR TRUST Co | 1 992 | 0,00 | 25 | −7,41 | ||||
| 2025-07-15 | 13F | Sheets Smith Wealth Management | 12 250 | 0,00 | 155 | −7,19 | ||||
| 2025-08-12 | 13F | J.w. Cole Advisors, Inc. | 12 857 | 0,00 | 163 | −6,86 | ||||
| 2025-07-23 | 13F | RMG Wealth Management LLC | 20 955 | 263 | ||||||
| 2025-08-14 | 13F | GWM Advisors LLC | 55 970 | −8,80 | 710 | −15,17 | ||||
| 2025-08-14 | 13F | Royal Bank Of Canada | 75 573 | −6,21 | 958 | −12,99 | ||||
| 2025-08-08 | 13F | Creative Planning | 13 174 | 4,85 | 167 | −2,34 | ||||
| 2025-08-14 | 13F | Bank Of America Corp /de/ | 244 615 | 5,01 | 3 104 | −2,36 | ||||
| 2025-08-14 | 13F | Jane Street Group, Llc | 43 394 | 551 | ||||||
| 2025-07-10 | 13F | Sovran Advisors, LLC | 30 650 | −2,63 | 389 | −2,02 | ||||
| 2025-05-15 | 13F | Mercer Global Advisors Inc /adv | 0 | −100,00 | 0 | |||||
| 2025-08-11 | 13F | Principal Securities, Inc. | 618 506 | −36,28 | 7 849 | −39,76 | ||||
| 2025-08-14 | 13F | Wells Fargo & Company/mn | 244 813 | 586,75 | 3 107 | 539,09 | ||||
| 2025-08-15 | 13F | Morgan Stanley | 978 839 | 4,20 | 12 421 | −3,13 | ||||
| 2025-07-28 | 13F | Harbour Investments, Inc. | 2 517 | 0,76 | 32 | −8,82 | ||||
| 2025-08-12 | 13F | Insigneo Advisory Services, Llc | 250 700 | 0,80 | 3 181 | −6,28 | ||||
| 2025-08-07 | 13F | Sound View Wealth Advisors Group, LLC | 12 123 | 0,00 | 154 | −7,27 | ||||
| 2025-08-05 | 13F | GPS Wealth Strategies Group, LLC | 4 637 | 0,00 | 59 | −7,94 | ||||
| 2025-08-06 | 13F | Commonwealth Equity Services, Llc | 227 330 | 3,21 | 3 | −33,33 | ||||
| 2025-04-16 | 13F | Wealth Enhancement Advisory Services, Llc | 0 | −100,00 | 0 | |||||
| 2025-08-11 | 13F | Semus Wealth Partners LLC | 13 176 | −2,75 | 167 | −9,24 | ||||
| 2025-08-12 | 13F | LPL Financial LLC | 503 424 | 9,40 | 6 388 | 1,70 | ||||
| 2025-08-14 | 13F | Colony Group, LLC | 19 220 | −6,23 | 244 | −12,90 | ||||
| 2025-05-19 | 13F | Smith Asset Management Co., LLC | 157 959 | 14,98 | 2 156 | 16,98 | ||||
| 2025-08-13 | 13F | StoneX Group Inc. | 46 501 | 5,41 | 592 | −1,99 | ||||
| 2025-07-16 | 13F | Arlington Capital Management, Inc. | 76 526 | 971 | ||||||
| 2025-04-15 | 13F | Noble Wealth Management PBC | 31 390 | 15,19 | 428 | 17,26 | ||||
| 2025-07-18 | 13F | PFG Investments, LLC | 25 972 | 7,28 | 330 | −0,30 | ||||
| 2025-08-07 | 13F | Readystate Asset Management Lp | 255 565 | 3 243 | ||||||
| 2025-08-13 | 13F | Guggenheim Capital Llc | 1 153 405 | 3,12 | 14 637 | −4,13 | ||||
| 2025-08-11 | 13F | Elequin Capital Lp | 22 203 | 282 | ||||||
| 2025-07-17 | 13F | Venture Visionary Partners LLC | 130 301 | 0,00 | 1 654 | −7,03 | ||||
| 2025-08-14 | 13F | IHT Wealth Management, LLC | 13 293 | −15,74 | 169 | −21,86 | ||||
| 2025-08-08 | 13F | Avantax Advisory Services, Inc. | 20 937 | −3,71 | 266 | −10,47 | ||||
| 2025-05-12 | 13F | Virtu Financial LLC | 0 | −100,00 | 0 | |||||
| 2025-07-29 | 13F | International Assets Investment Management, Llc | 79 503 | 1,59 | 1 009 | −5,62 | ||||
| 2025-07-22 | 13F | Marks Group Wealth Management, Inc | 0 | −100,00 | 0 | |||||
| 2025-07-23 | 13F | Detalus Advisors, LLC | 18 578 | 0,00 | 236 | −7,11 | ||||
| 2025-07-18 | 13F | Truist Financial Corp | 27 627 | 0,00 | 351 | −7,16 | ||||
| 2025-08-14 | 13F/A | Rockefeller Capital Management L.P. | 19 372 | 0,00 | 246 | −7,20 | ||||
| 2025-08-14 | 13F | Kovitz Investment Group Partners, LLC | 10 095 | 129 | ||||||
| 2025-07-28 | 13F | Mission Hills Financial Advisory, LLC | 1 049 372 | 9,19 | 13 317 | 1,51 | ||||
| 2025-04-25 | 13F | WASHINGTON TRUST Co | 0 | −100,00 | 0 | |||||
| 2025-08-13 | 13F | Invesco Ltd. | 449 815 | 9,64 | 5 708 | 1,93 | ||||
| 2025-08-13 | 13F | Walleye Capital LLC | 0 | −100,00 | 0 | |||||
| 2025-08-13 | 13F | Northwestern Mutual Wealth Management Co | 13 566 | −97,58 | 172 | −97,75 | ||||
| 2025-08-18 | 13F | Hollencrest Capital Management | 1 835 | 0,00 | 23 | −8,00 | ||||
| 2025-08-12 | 13F | BlackRock, Inc. | 14 169 | 0,00 | 180 | −7,25 | ||||
| 2025-07-16 | 13F | PFS Partners, LLC | 1 500 | 0,00 | 19 | −5,00 | ||||
| 2025-08-06 | 13F | Prospera Financial Services Inc | 175 968 | 6,64 | 2 233 | −0,84 | ||||
| 2025-08-13 | 13F | Vermillion & White Wealth Management Group, LLC | 1 899 | 2,59 | 24 | −4,00 | ||||
| 2025-08-12 | 13F | CIBC Private Wealth Group, LLC | 7 660 | 0,00 | 97 | 3,19 | ||||
| 2025-08-11 | 13F | Citigroup Inc | 19 014 | 241 | ||||||
| 2025-07-24 | 13F | Cyndeo Wealth Partners, LLC | 70 300 | 4,70 | 892 | −2,62 | ||||
| 2025-08-08 | 13F | Hartland & Co., LLC | 1 700 | 0,00 | 22 | −8,70 | ||||
| 2025-08-14 | 13F | Peapack Gladstone Financial Corp | 29 578 | 71,97 | 0 | |||||
| 2025-08-14 | 13F | Savoie Capital LLC | 12 000 | 152 | ||||||
| 2025-08-12 | 13F | Jpmorgan Chase & Co | 0 | −100,00 | 0 | |||||
| 2025-05-09 | 13F | GeoWealth Management, LLC | 0 | −100,00 | 0 | |||||
| 2025-07-11 | 13F | Farther Finance Advisors, LLC | 6 212 | 0,00 | 79 | −7,14 | ||||
| 2025-08-13 | 13F | Keystone Financial Group | 10 000 | 0,00 | 127 | −7,35 | ||||
| 2025-08-14 | 13F | Balyasny Asset Management Llc | 115 258 | 1 463 | ||||||
| 2025-07-08 | 13F | Nbc Securities, Inc. | 7 100 | 0,00 | 0 | |||||
| 2025-07-11 | 13F | LongView Wealth Management | 48 358 | 0,69 | 614 | −6,41 | ||||
| 2025-04-15 | 13F | Transform Wealth, LLC | 10 095 | 0,00 | 139 | 1,47 | ||||
| 2025-08-14 | 13F | Objective Capital Management, LLC | 16 000 | 203 | ||||||
| 2025-08-08 | 13F | Pnc Financial Services Group, Inc. | 8 284 | 0,00 | 105 | −7,08 | ||||
| 2025-07-25 | 13F | Ellis Investment Partners, LLC | 11 156 | 5,50 | 142 | −2,08 | ||||
| 2025-08-14 | 13F | CoreCap Advisors, LLC | 5 255 | 0,00 | 67 | −7,04 | ||||
| 2025-07-21 | 13F | Ameriflex Group, Inc. | 1 055 | 13 | ||||||
| 2025-07-28 | NP | PCEF - Invesco CEF Income Composite ETF This fund is a listed as child fund of Invesco Ltd. and if that institution has disclosed ownership in this security, then these positions will not be double counted when calculating total shares and total value | 415 126 | 3,05 | 5 293 | −3,75 | ||||
| 2025-08-14 | 13F | Stifel Financial Corp | 18 817 | −5,55 | 239 | −12,18 | ||||
| 2025-07-22 | 13F | Highland Capital Management, Llc | 11 640 | 0,00 | 148 | −6,96 | ||||
| 2025-08-12 | 13F | Proequities, Inc. | 0 | 0 | ||||||
| 2025-05-07 | 13F | Vista Private Wealth Partners. LLC | 0 | −100,00 | 0 | |||||
| 2025-07-17 | 13F | Janney Montgomery Scott LLC | 53 716 | −46,01 | 1 | −100,00 | ||||
| 2025-07-25 | 13F | Apollon Wealth Management, LLC | 26 518 | −2,58 | 337 | −9,43 | ||||
| 2025-08-05 | 13F | Prosperity Wealth Management, Inc. | 15 173 | 23,48 | 193 | 14,97 | ||||
| 2025-08-13 | 13F | Baker Avenue Asset Management, LP | 13 793 | −37,90 | 175 | −42,24 | ||||
| 2025-08-15 | 13F | Kestra Advisory Services, LLC | 68 821 | 29,09 | 873 | 20,08 | ||||
| 2025-07-25 | 13F | Atria Wealth Solutions, Inc. | 0 | −100,00 | 0 | |||||
| 2025-08-08 | 13F | Westbourne Investment Advisors, Inc. | 44 000 | 558 | ||||||
| 2025-04-29 | 13F | Raleigh Capital Management Inc. | 0 | −100,00 | 0 | |||||
| 2025-05-14 | 13F | Aristides Capital LLC | 0 | −100,00 | 0 | −100,00 | ||||
| 2025-08-05 | 13F | Sigma Planning Corp | 0 | −100,00 | 0 | |||||
| 2025-08-08 | 13F | Symphony Financial Services, Inc. | 14 351 | 1,30 | 182 | −5,70 | ||||
| 2025-07-31 | 13F | Cambridge Investment Research Advisors, Inc. | 30 376 | −0,44 | 0 | |||||
| 2025-08-11 | 13F | Strategic Wealth Partners, Ltd. | 1 370 | 17 | ||||||
| 2025-08-14 | 13F | Comerica Bank | 6 731 | −24,21 | 85 | −29,75 | ||||
| 2025-07-24 | 13F | Us Bancorp \de\ | 480 | 0,00 | 6 | 0,00 | ||||
| 2025-08-07 | 13F | Alpha Cubed Investments, LLC | 0 | −100,00 | 0 | |||||
| 2025-08-12 | 13F | Landscape Capital Management, L.l.c. | 46 164 | 586 | ||||||
| 2025-08-11 | 13F | Private Advisor Group, LLC | 53 353 | −26,43 | 677 | −31,55 | ||||
| 2025-04-29 | 13F | Hm Payson & Co | 0 | −100,00 | 0 | |||||
| 2025-05-14 | 13F | Susquehanna International Group, Llp | 0 | −100,00 | 0 |