Grundläggande statistik
| Institutionella ägare | 129 total, 128 long only, 1 short only, 0 long/short - change of 0,78% MRQ |
| Genomsnittlig portföljallokering | 0.0773 % - change of 3,92% MRQ |
| Institutionella aktier (lång) | 18 872 953 (ex 13D/G) - change of 0,37MM shares 2,02% MRQ |
| Institutionellt värde (lång) | $ 353 493 USD ($1000) |
Institutionellt ägande och aktieägare
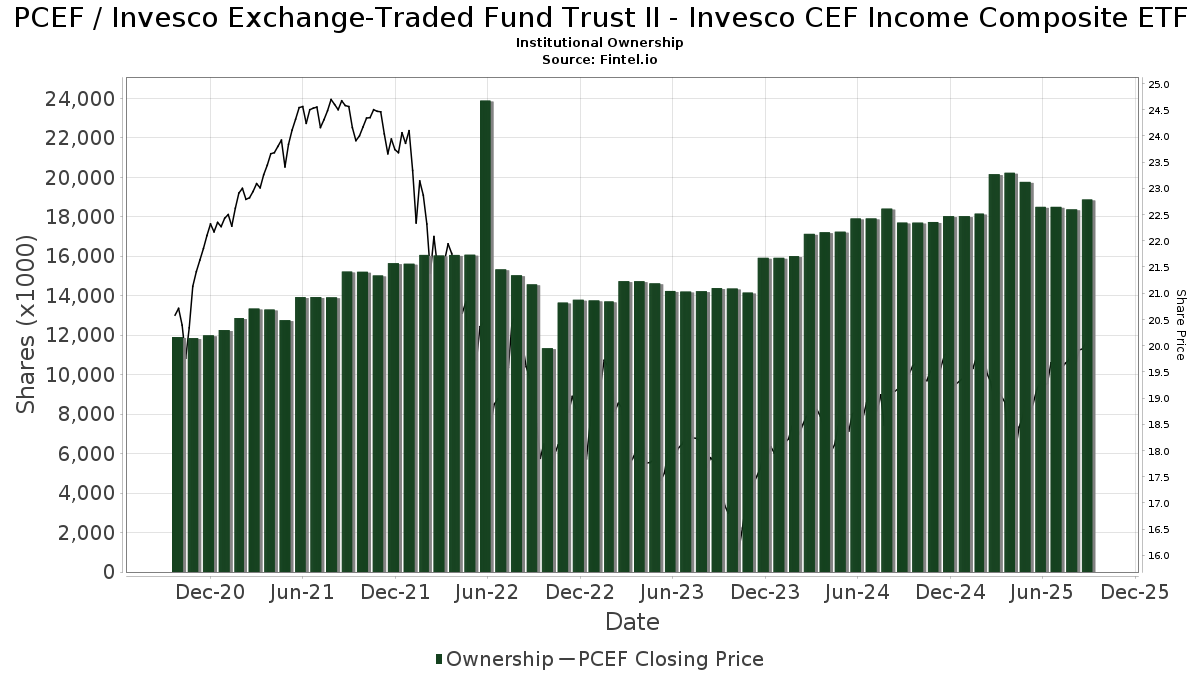
Invesco Exchange-Traded Fund Trust II - Invesco CEF Income Composite ETF (US:PCEF) har 129 Institutionella ägare och aktieägare som har lämnat in 13D/G- eller 13F-formulär till Securities Exchange Commission (SEC). Dessa institut innehar totalt 18,879,453 aktier. Största aktieägare inkluderar Envestnet Asset Management Inc, Morgan Stanley, Wells Fargo & Company/mn, Royal Bank Of Canada, Raymond James Financial Inc, LPL Financial LLC, Bank Of America Corp /de/, Larson Financial Group LLC, Cetera Investment Advisers, and Ameriprise Financial Inc .
Invesco Exchange-Traded Fund Trust II - Invesco CEF Income Composite ETF (ARCA:PCEF) Institutionell ägarstruktur visar institutioners och fonders nuvarande positioner i företaget, samt de senaste förändringarna i positionernas storlek. Större aktieägare kan vara enskilda investerare, fonder, hedgefonder eller institutioner. Bilaga 13D visar att investeraren äger (eller ägde) mer än 5% av företaget och avser (eller avsåg) att aktivt eftersträva en förändring av affärsstrategin. Schedule 13G indikerar en passiv investering på över 5%.
The share price as of September 8, 2025 is 20,03 / share. Previously, on September 9, 2024, the share price was 19,20 / share. This represents an increase of 4,35% over that period.
Fondsentimentets poäng
Fondsentimentet poängen(fka Ägarackumulation-poäng) visar vilka aktier som är mest köpta av fonder. Det är resultatet av en sofistikerad kvantitativ flerfaktormodell som identifierar företag med de högsta nivåerna av institutionell ackumulering. Poängsättningsmodellen använder en kombination av den totala ökningen av redovisade ägare, förändringarna i portföljallokeringarna för dessa ägare och andra mått. Siffran sträcker sig från 0 till 100, där högre siffror indikerar en högre nivå av ackumulering i förhållande till sina konkurrenter, och 50 är genomsnittet.
Uppdateringsfrekvens: Dagligen
Se Ownership Explorer, som innehåller en lista över de högst rankade företagen.
Institutionell sälj/köp-kvot
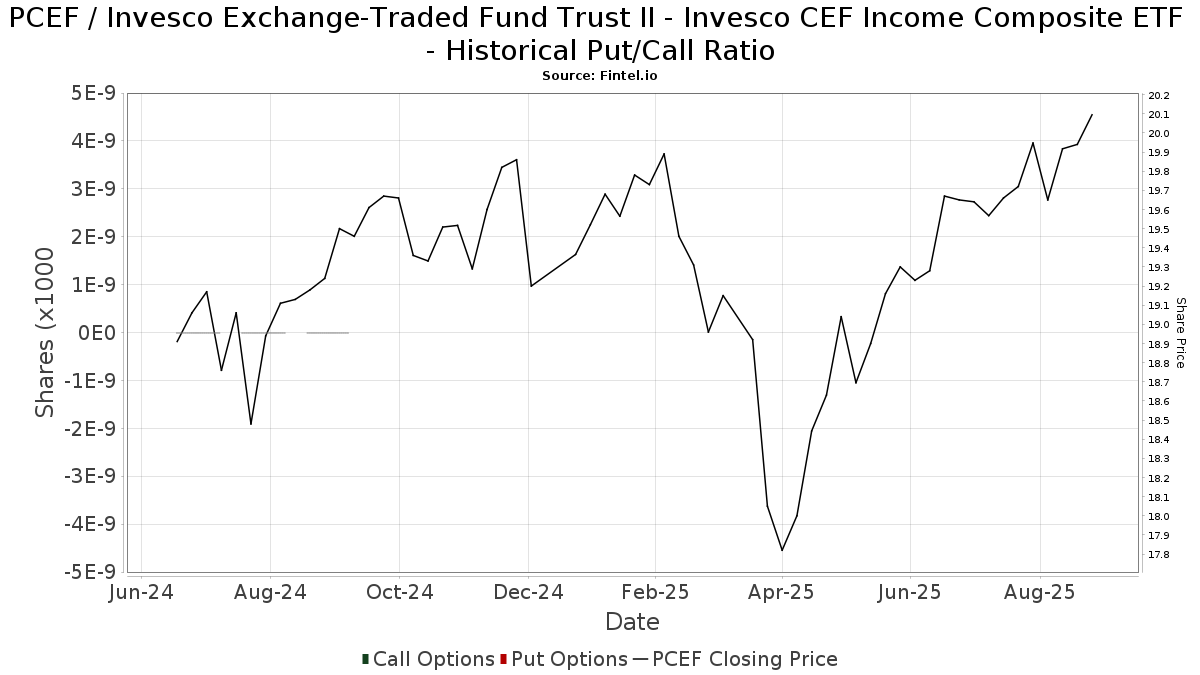
Förutom att rapportera vanliga eget kapital- och skuldemissioner måste institutioner med mer än 100MM tillgångar under förvaltning också avslöja sina innehav av sälj- och köpoptioner. Eftersom säljoptioner i allmänhet indikerar ett negativt sentiment och köpoptioner indikerar ett positivt sentiment, kan vi få en uppfattning om det övergripande institutionella sentimentet genom att plotta förhållandet mellan säljoptioner och köpoptioner. Diagrammet till höger visar det historiska förhållandet mellan sälj- och köpoptioner för detta instrument.
Genom att använda sälj/köp-kvoten som en indikator på aktieägarnas sentiment undviker man en av de största bristerna med att använda det totala institutionella ägandet, nämligen att en betydande del av de förvaltade tillgångarna investeras passivt för att följa index. Passivt förvaltade fonder köper vanligtvis inte optioner, så indikatorn för sälj/köp-kvoten ger en bättre bild av stämningen i aktivt förvaltade fonder.
13F- och NPORT-arkiveringar
Detaljer om 13F-arkiveringar är gratis. Detaljer om NP-arkiveringar kräver ett premiummedlemskap. Gröna rader indikerar nya positioner. Röda rader indikerar stängda positioner. Klicka på länk symbolen för att se hela transaktionshistoriken.
Uppgradera
för att låsa upp premiumdata och exportera till Excel ![]() .
.
| Fil Datum | Källa | Investerare | Typ | Genomsnittligt pris (beräknat) |
Aktier | Δ Aktier (%) |
Rapporterat värde (1000 USD) |
Δ Värde (%) |
Portföljallokering (%) |
|
|---|---|---|---|---|---|---|---|---|---|---|
| 2025-08-14 | 13F | Gotham Asset Management, LLC | 19 418 | 22,03 | 379 | 26,76 | ||||
| 2025-08-12 | 13F | Steward Partners Investment Advisory, Llc | 4 281 | −0,19 | 84 | 3,75 | ||||
| 2025-08-12 | 13F | Boxwood Ventures, Inc. | 14 893 | 2,10 | 291 | 6,20 | ||||
| 2025-08-14 | 13F | Qube Research & Technologies Ltd | 57 | 0,00 | 1 | 0,00 | ||||
| 2025-07-17 | 13F | Janney Montgomery Scott LLC | 25 842 | −9,07 | 1 | |||||
| 2025-08-14 | 13F | Sunbelt Securities, Inc. | 801 | −2,08 | 15 | 0,00 | ||||
| 2025-07-08 | 13F | Heartwood Wealth Advisors LLC | 35 000 | 0,00 | 684 | 3,64 | ||||
| 2025-04-22 | 13F | Merkkuri Wealth Advisors LLC | 0 | −100,00 | 0 | |||||
| 2025-07-30 | 13F | Cullen/frost Bankers, Inc. | 0 | −100,00 | 0 | |||||
| 2025-05-15 | 13F/A | Orion Portfolio Solutions, LLC | 50 024 | −10,77 | 943 | −12,29 | ||||
| 2025-08-26 | 13F/A | Thrivent Financial For Lutherans | 0 | −100,00 | 0 | |||||
| 2025-05-09 | 13F | Blair William & Co/il | 0 | −100,00 | 0 | −100,00 | ||||
| 2025-07-18 | 13F | Truist Financial Corp | 74 536 | −14,71 | 1 434 | −12,93 | ||||
| 2025-08-04 | 13F | Adell Harriman & Carpenter Inc | 124 300 | 4,63 | 2 429 | 8,44 | ||||
| 2025-08-06 | 13F | Prospera Financial Services Inc | 12 711 | 0,88 | 248 | 4,64 | ||||
| 2025-07-23 | 13F | Sax Wealth Advisors, Llc | 12 500 | 0,00 | 244 | 3,83 | ||||
| 2025-08-14 | 13F | Wealth Preservation Advisors, LLC | 500 | 0,00 | 10 | 0,00 | ||||
| 2025-08-14 | 13F | Mml Investors Services, Llc | 91 654 | −7,58 | 2 | 0,00 | ||||
| 2025-08-14 | 13F | Warren Averett Asset Management, LLC | 13 073 | −3,67 | 255 | 0,00 | ||||
| 2025-08-15 | 13F | Morgan Stanley | 2 172 900 | 1,30 | 42 458 | 5,00 | ||||
| 2025-08-13 | 13F | EverSource Wealth Advisors, LLC | 0 | −100,00 | 0 | |||||
| 2025-07-31 | 13F | Glass Jacobson Investment Advisors llc | 135 | 0,00 | 3 | 0,00 | ||||
| 2025-07-08 | 13F | Zrc Wealth Management, Llc | 1 311 | 0,00 | 26 | 4,17 | ||||
| 2025-08-01 | 13F | Gwn Securities Inc. | 0 | −100,00 | 0 | |||||
| 2025-08-19 | 13F | Newbridge Financial Services Group, Inc. | 7 449 | −24,94 | 146 | −22,46 | ||||
| 2025-08-08 | 13F | Emerald Investment Partners, Llc | 62 100 | 6,99 | 1 213 | 10,88 | ||||
| 2025-08-14 | 13F | UBS Group AG | 298 828 | −2,14 | 5 839 | 1,44 | ||||
| 2025-07-22 | 13F | Merit Financial Group, LLC | 131 883 | 55,57 | 2 577 | 61,30 | ||||
| 2025-07-28 | 13F | Harbour Investments, Inc. | 6 574 | −5,19 | 128 | −1,54 | ||||
| 2025-08-04 | 13F | Wolverine Asset Management Llc | 0 | −100,00 | 0 | |||||
| 2025-07-14 | 13F | Sowell Financial Services LLC | 28 634 | 0,46 | 560 | 4,10 | ||||
| 2025-08-04 | 13F | Assetmark, Inc | 54 | 1 | ||||||
| 2025-07-14 | 13F | Buska Wealth Management, LLC | 19 886 | 3,38 | 389 | 7,18 | ||||
| 2025-08-08 | 13F | Larson Financial Group LLC | 572 383 | 886,63 | 11 184 | 923,24 | ||||
| 2025-08-08 | 13F | Capital Investment Advisory Services, LLC | 4 673 | 2,10 | 91 | 5,81 | ||||
| 2025-04-23 | 13F | Bessemer Group Inc | 0 | −100,00 | 0 | |||||
| 2025-05-29 | NP | BTSAX - BTS Managed Income Fund Class A Shares | 15 669 | −0,67 | 295 | −2,32 | ||||
| 2025-07-11 | 13F | Farther Finance Advisors, LLC | 6 544 | 129,29 | 128 | 139,62 | ||||
| 2025-08-15 | 13F | WFA of San Diego, LLC | 2 300 | −9,80 | 45 | −12,00 | ||||
| 2025-07-10 | 13F | Wealth Enhancement Advisory Services, Llc | 469 408 | 6,94 | 9 261 | 11,93 | ||||
| 2025-07-21 | 13F | Ameritas Advisory Services, LLC | 4 687 | 92 | ||||||
| 2025-08-12 | 13F | Ameritas Investment Partners, Inc. | 1 | 0 | ||||||
| 2025-08-12 | 13F | LPL Financial LLC | 1 101 222 | 14,88 | 21 518 | 19,08 | ||||
| 2025-08-14 | 13F | GWM Advisors LLC | 38 836 | 3,23 | 759 | 6,91 | ||||
| 2025-05-14 | 13F | Oarsman Capital, Inc. | 0 | −100,00 | 0 | −100,00 | ||||
| 2025-08-05 | 13F | Atlas Private Wealth Advisors | 0 | −100,00 | 0 | |||||
| 2025-07-17 | 13F | Wagner Wealth Management, Llc | 3 116 | 0,00 | 61 | 3,45 | ||||
| 2025-07-21 | 13F | Future Financial Wealth Managment LLC | 55 349 | 1,85 | 1 082 | 5,57 | ||||
| 2025-05-14 | 13F | Jane Street Group, Llc | 0 | −100,00 | 0 | |||||
| 2025-08-14 | 13F | Money Concepts Capital Corp | 10 739 | 210 | ||||||
| 2025-05-12 | 13F | Independent Advisor Alliance | 0 | −100,00 | 0 | |||||
| 2025-08-12 | 13F | Cornerstone Wealth Management, LLC | 63 722 | 1 245 | ||||||
| 2025-07-29 | 13F | Mezzasalma Advisors, LLC | 0 | −100,00 | 0 | |||||
| 2025-09-04 | 13F/A | Advisor Group Holdings, Inc. | 185 311 | 7,18 | 3 622 | 11,11 | ||||
| 2025-08-06 | 13F | AE Wealth Management LLC | 1 096 | −63,21 | 21 | −62,50 | ||||
| 2025-08-04 | 13F | Spire Wealth Management | 250 | 0,00 | 5 | 0,00 | ||||
| 2025-08-11 | 13F | Pinnacle Wealth Planning Services, Inc. | 17 190 | 0,00 | 336 | 3,40 | ||||
| 2025-08-11 | 13F | Sykon Capital Llc | 96 215 | −21,11 | 1 880 | −18,23 | ||||
| 2025-04-24 | 13F/A | Golden State Wealth Management, LLC | 0 | −100,00 | 0 | −100,00 | ||||
| 2025-07-21 | 13F | Hudson Valley Investment Advisors Inc /adv | 15 704 | 0,00 | 307 | 3,38 | ||||
| 2025-07-31 | 13F | Oppenheimer & Co Inc | 78 614 | 25,46 | 1 536 | 30,06 | ||||
| 2025-08-13 | 13F | Summit Financial, LLC | 61 860 | 204,16 | 1 209 | 215,40 | ||||
| 2025-08-14 | 13F | Susquehanna International Group, Llp | 0 | −100,00 | 0 | |||||
| 2025-05-08 | 13F | Menard Financial Group LLC | 0 | −100,00 | 0 | |||||
| 2025-08-07 | 13F | 1620 Investment Advisors, Inc. | 435 | 0,00 | 8 | 0,00 | ||||
| 2025-07-25 | 13F | Atria Wealth Solutions, Inc. | 15 263 | −72,01 | 298 | −70,98 | ||||
| 2025-08-14 | 13F | Garden State Investment Advisory Services LLC | 18 941 | 0,00 | 370 | 3,64 | ||||
| 2025-08-07 | 13F | Allworth Financial LP | 40 | 0,00 | 1 | |||||
| 2025-08-08 | 13F | Hartland & Co., LLC | 15 232 | 298 | ||||||
| 2025-07-24 | 13F | IFP Advisors, Inc | 1 620 | 0,00 | 32 | 3,33 | ||||
| 2025-08-07 | 13F | Resources Investment Advisors, LLC. | 13 157 | 2,10 | 257 | 6,20 | ||||
| 2025-08-14 | 13F | Raymond James Financial Inc | 1 152 972 | 13,55 | 22 529 | 17,71 | ||||
| 2025-07-25 | 13F | Endowment Wealth Management, Inc. | 21 888 | 10,05 | 428 | 14,17 | ||||
| 2025-05-29 | NP | ACEFX - Absolute Strategies Fund Institutional Shares | Short | −6 500 | −123 | |||||
| 2025-08-08 | 13F | Beck Bode, LLC | 29 559 | −31,03 | 578 | −28,50 | ||||
| 2025-08-14 | 13F | Bnp Paribas Arbitrage, Sa | 1 396 | −43,55 | 27 | −41,30 | ||||
| 2025-07-08 | 13F | Parallel Advisors, LLC | 321 | 6 | ||||||
| 2025-07-10 | 13F | Atticus Wealth Management, Llc | 4 784 | 0,00 | 93 | 3,33 | ||||
| 2025-08-12 | 13F | Jpmorgan Chase & Co | 0 | −100,00 | 0 | −100,00 | ||||
| 2025-08-14 | 13F/A | Rockefeller Capital Management L.P. | 103 038 | 0,55 | 2 013 | 4,25 | ||||
| 2025-08-01 | 13F | Envestnet Asset Management Inc | 2 851 970 | 8,26 | 55 720 | 12,21 | ||||
| 2025-04-25 | 13F | Tradewinds Capital Management, LLC | 0 | −100,00 | 0 | |||||
| 2025-08-13 | 13F | Level Four Advisory Services, Llc | 10 777 | 4,99 | 211 | 8,81 | ||||
| 2025-07-08 | 13F | Nbc Securities, Inc. | 4 853 | 101,96 | 0 | |||||
| 2025-07-29 | 13F | Chicago Partners Investment Group LLC | 27 137 | −8,60 | 531 | −3,98 | ||||
| 2025-07-14 | 13F | Toth Financial Advisory Corp | 146 | 0,00 | 3 | 0,00 | ||||
| 2025-08-13 | 13F | Jones Financial Companies Lllp | 614 | 12 | ||||||
| 2025-08-01 | 13F | Pasadena Private Wealth, LLC | 0 | −100,00 | 0 | |||||
| 2025-07-29 | 13F | Salomon & Ludwin, LLC | 773 | 0,00 | 15 | 7,14 | ||||
| 2025-08-14 | 13F | CoreCap Advisors, LLC | 7 414 | −0,01 | 145 | 3,60 | ||||
| 2025-08-14 | 13F | Ameriprise Financial Inc | 495 423 | −25,11 | 9 680 | −22,52 | ||||
| 2025-08-15 | 13F | Kestra Advisory Services, LLC | 35 459 | 1,40 | 693 | 5,01 | ||||
| 2025-05-09 | 13F | Pathway Financial Advisers, LLC | 0 | −100,00 | 0 | |||||
| 2025-08-08 | 13F | Avantax Advisory Services, Inc. | 37 727 | −15,01 | 737 | −11,84 | ||||
| 2025-08-14 | 13F | Stifel Financial Corp | 49 382 | −1,92 | 965 | 1,58 | ||||
| 2025-08-14 | 13F | Mariner, LLC | 94 176 | −1,75 | 1 840 | 1,94 | ||||
| 2025-07-25 | 13F | Envestnet Portfolio Solutions, Inc. | 11 180 | −55,41 | 218 | −53,81 | ||||
| 2025-08-14 | 13F | Quartz Partners, LLC | 13 834 | 0,00 | 270 | 3,85 | ||||
| 2025-08-08 | 13F | Compass Financial Services Inc | 14 221 | −29,96 | 278 | −27,49 | ||||
| 2025-07-30 | 13F | BG Investment Services, Inc. | 15 726 | 307 | ||||||
| 2025-07-29 | 13F | Stephens Inc /ar/ | 104 870 | 5,70 | 2 049 | 9,57 | ||||
| 2025-08-07 | 13F | Readystate Asset Management Lp | 15 047 | 294 | ||||||
| 2025-07-25 | 13F | Cwm, Llc | 3 046 | −29,91 | 0 | |||||
| 2025-07-18 | 13F | Marino, Stram & Associates Llc | 46 515 | 0,00 | 909 | 3,65 | ||||
| 2025-07-31 | 13F | Cambridge Investment Research Advisors, Inc. | 202 780 | −13,32 | 4 | −25,00 | ||||
| 2025-08-08 | 13F | Pnc Financial Services Group, Inc. | 11 635 | −1,27 | 227 | 2,25 | ||||
| 2025-08-11 | 13F | Hexagon Capital Partners LLC | 12 299 | 0,00 | 240 | 3,90 | ||||
| 2025-08-13 | 13F | Beacon Pointe Advisors, LLC | 12 189 | −16,01 | 238 | −12,82 | ||||
| 2025-08-11 | 13F | Citigroup Inc | 256 | 0,00 | 5 | 25,00 | ||||
| 2025-07-17 | 13F | Sound Income Strategies, LLC | 60 | 0,00 | 1 | 0,00 | ||||
| 2025-08-05 | 13F | GPS Wealth Strategies Group, LLC | 6 305 | −24,58 | 123 | −21,66 | ||||
| 2025-05-02 | 13F | Apollon Wealth Management, LLC | 0 | −100,00 | 0 | −100,00 | ||||
| 2025-07-14 | 13F | GAMMA Investing LLC | 75 127 | −65,89 | 1 468 | −64,66 | ||||
| 2025-08-05 | 13F | Key FInancial Inc | 6 | 0,00 | 0 | |||||
| 2025-08-13 | 13F | Argyle Capital Partners, LLC | 23 364 | 0,00 | 457 | 3,64 | ||||
| 2025-08-11 | 13F | Principal Securities, Inc. | 149 | 0,00 | 3 | 0,00 | ||||
| 2025-07-07 | 13F | Investors Research Corp | 213 | 0,00 | 4 | 0,00 | ||||
| 2025-08-14 | 13F | Comerica Bank | 21 427 | 1,60 | 419 | 5,29 | ||||
| 2025-07-17 | 13F | Vermillion Wealth Management, Inc. | 1 333 | −0,82 | 26 | 4,00 | ||||
| 2025-08-08 | 13F | Creative Planning | 60 205 | −14,32 | 1 176 | −11,18 | ||||
| 2025-07-07 | 13F | Thurston, Springer, Miller, Herd & Titak, Inc. | 2 613 | 0,00 | 51 | 4,08 | ||||
| 2025-08-15 | 13F | Equitable Holdings, Inc. | 10 431 | −10,03 | 204 | −6,88 | ||||
| 2025-07-24 | 13F | Us Bancorp \de\ | 2 700 | 0,00 | 53 | 4,00 | ||||
| 2025-08-06 | 13F | Commonwealth Equity Services, Llc | 452 065 | −1,76 | 9 | 0,00 | ||||
| 2025-08-27 | 13F/A | Brinker Capital Investments, LLC | 46 084 | −7,88 | 900 | −4,46 | ||||
| 2025-08-08 | 13F | Crossmark Global Holdings, Inc. | 0 | −100,00 | 0 | |||||
| 2025-08-13 | 13F | Johnson Financial Group, Inc. | 462 | 0,00 | 9 | 12,50 | ||||
| 2025-08-13 | 13F | Baird Financial Group, Inc. | 443 295 | 3,86 | 8 662 | 7,66 | ||||
| 2025-08-14 | 13F | Fmr Llc | 2 684 | −63,36 | 52 | −62,32 | ||||
| 2025-08-11 | 13F | Anfield Capital Management, LLC | 7 323 | 0,00 | 143 | 3,62 | ||||
| 2025-08-07 | 13F | Panoramic Investment Advisors, Llc | 51 203 | 0,57 | 1 001 | 4,28 | ||||
| 2025-08-08 | 13F | Intrua Financial, LLC | 470 852 | 237,91 | 9 200 | 250,34 | ||||
| 2025-08-12 | 13F | PSI Advisors, LLC | 0 | −100,00 | 0 | |||||
| 2025-08-14 | 13F | Royal Bank Of Canada | 1 837 577 | −14,03 | 35 906 | −10,88 | ||||
| 2025-08-13 | 13F | Northwestern Mutual Wealth Management Co | 0 | −100,00 | 0 | |||||
| 2025-07-21 | 13F | TFG Advisers LLC | 14 998 | 4,68 | 293 | 8,52 | ||||
| 2025-08-21 | 13F | Aveo Capital Partners, LLC | 0 | −100,00 | 0 | |||||
| 2025-07-29 | 13F | Dumont & Blake Investment Advisors Llc | 137 517 | −0,12 | 2 687 | 3,55 | ||||
| 2025-08-14 | 13F | Bank Of America Corp /de/ | 941 215 | 0,81 | 18 391 | 4,50 | ||||
| 2025-08-11 | 13F | HighTower Advisors, LLC | 103 247 | −12,48 | 2 017 | −9,27 | ||||
| 2025-08-12 | 13F | NWF Advisory Services Inc. | 24 000 | 452 | ||||||
| 2025-07-30 | 13F | BTS Asset Management, Inc. | 0 | −100,00 | 0 | |||||
| 2025-08-12 | 13F | Proequities, Inc. | 0 | 0 | ||||||
| 2025-08-08 | 13F | Cetera Investment Advisers | 498 833 | 19,32 | 9 747 | 23,69 | ||||
| 2025-07-31 | 13F | Moser Wealth Advisors, LLC | 1 000 | 0,00 | 20 | 5,56 | ||||
| 2025-08-11 | 13F | VSM Wealth Advisory, LLC | 4 543 | 1,43 | 89 | 4,76 | ||||
| 2025-08-14 | 13F | Wells Fargo & Company/mn | 1 994 801 | −10,33 | 38 978 | −7,05 | ||||
| 2025-08-11 | 13F | Private Advisor Group, LLC | 25 818 | −1,64 | 504 | 2,02 | ||||
| 2025-07-08 | 13F | Goldstone Financial Group, LLC | 53 404 | −1,69 | 1 054 | 2,93 | ||||
| 2025-07-24 | 13F | Von Berge Wealth Management Group, LLC | 12 035 | 1,69 | 235 | 8,84 | ||||
| 2025-08-12 | 13F | Global Retirement Partners, LLC | 44 | 4,76 | 1 | |||||
| 2025-08-18 | 13F | Geneos Wealth Management Inc. | 48 941 | 20,26 | 956 | 24,64 | ||||
| 2025-07-09 | 13F | Massmutual Trust Co Fsb/adv | 244 | 5 | ||||||
| 2025-08-06 | 13F | Aspect Partners, LLC | 590 | 12 | ||||||
| 2025-08-12 | 13F | Gladstone Institutional Advisory LLC | 20 512 | −2,81 | 401 | 0,76 | ||||
| 2025-08-14 | 13F | Glen Eagle Advisors, LLC | 3 405 | 0,00 | 67 | 3,13 |