Grundläggande statistik
| Institutionella ägare | 113 total, 112 long only, 0 short only, 1 long/short - change of −5,79% MRQ |
| Genomsnittlig portföljallokering | 0.0083 % - change of −18,79% MRQ |
| Institutionella aktier (lång) | 2 982 786 (ex 13D/G) - change of −0,04MM shares −1,33% MRQ |
| Institutionellt värde (lång) | $ 58 904 USD ($1000) |
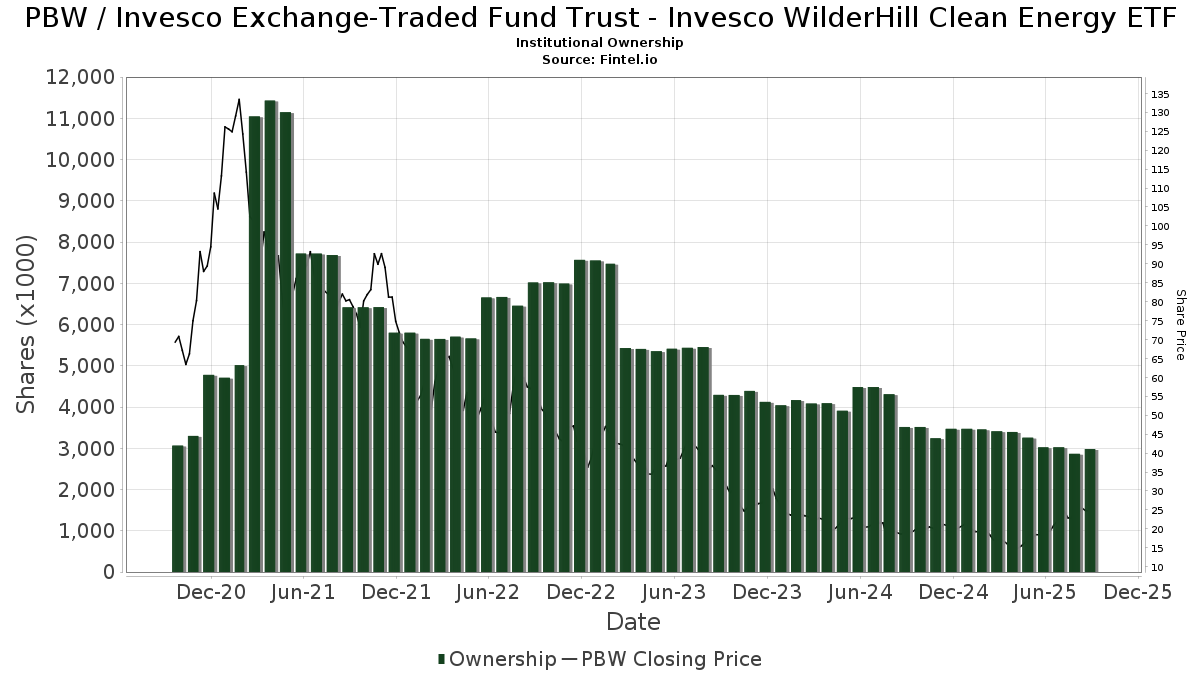
Institutionellt ägande och aktieägare
Invesco Exchange-Traded Fund Trust - Invesco WilderHill Clean Energy ETF (US:PBW) har 113 Institutionella ägare och aktieägare som har lämnat in 13D/G- eller 13F-formulär till Securities Exchange Commission (SEC). Dessa institut innehar totalt 2,982,786 aktier. Största aktieägare inkluderar Morgan Stanley, Bank Of America Corp /de/, Bnp Paribas Arbitrage, Sa, Allianz Se, Goldman Sachs Group Inc, Raymond James Financial Inc, Susquehanna International Group, Llp, Envestnet Portfolio Solutions, Inc., UBS Group AG, and Family Firm, Inc. .
Invesco Exchange-Traded Fund Trust - Invesco WilderHill Clean Energy ETF (ARCA:PBW) Institutionell ägarstruktur visar institutioners och fonders nuvarande positioner i företaget, samt de senaste förändringarna i positionernas storlek. Större aktieägare kan vara enskilda investerare, fonder, hedgefonder eller institutioner. Bilaga 13D visar att investeraren äger (eller ägde) mer än 5% av företaget och avser (eller avsåg) att aktivt eftersträva en förändring av affärsstrategin. Schedule 13G indikerar en passiv investering på över 5%.
The share price as of September 12, 2025 is 25,41 / share. Previously, on September 16, 2024, the share price was 19,10 / share. This represents an increase of 33,04% over that period.
Fondsentimentets poäng
Fondsentimentet poängen(fka Ägarackumulation-poäng) visar vilka aktier som är mest köpta av fonder. Det är resultatet av en sofistikerad kvantitativ flerfaktormodell som identifierar företag med de högsta nivåerna av institutionell ackumulering. Poängsättningsmodellen använder en kombination av den totala ökningen av redovisade ägare, förändringarna i portföljallokeringarna för dessa ägare och andra mått. Siffran sträcker sig från 0 till 100, där högre siffror indikerar en högre nivå av ackumulering i förhållande till sina konkurrenter, och 50 är genomsnittet.
Uppdateringsfrekvens: Dagligen
Se Ownership Explorer, som innehåller en lista över de högst rankade företagen.
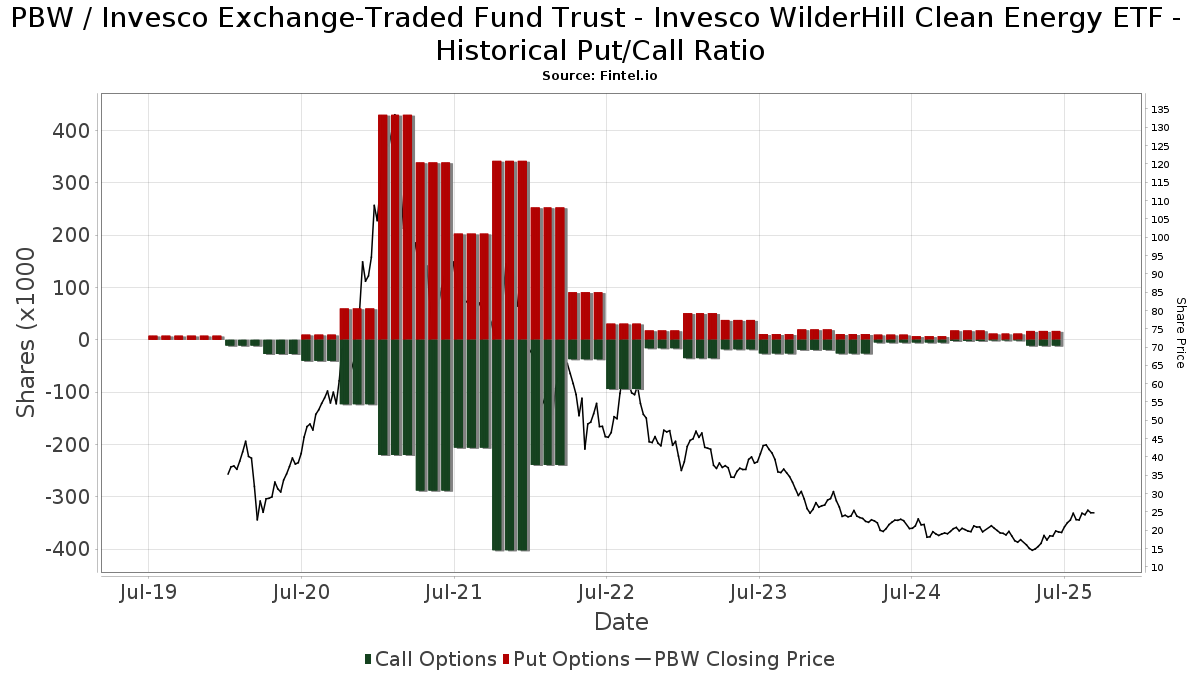
Institutionell sälj/köp-kvot
Förutom att rapportera vanliga eget kapital- och skuldemissioner måste institutioner med mer än 100MM tillgångar under förvaltning också avslöja sina innehav av sälj- och köpoptioner. Eftersom säljoptioner i allmänhet indikerar ett negativt sentiment och köpoptioner indikerar ett positivt sentiment, kan vi få en uppfattning om det övergripande institutionella sentimentet genom att plotta förhållandet mellan säljoptioner och köpoptioner. Diagrammet till höger visar det historiska förhållandet mellan sälj- och köpoptioner för detta instrument.
Genom att använda sälj/köp-kvoten som en indikator på aktieägarnas sentiment undviker man en av de största bristerna med att använda det totala institutionella ägandet, nämligen att en betydande del av de förvaltade tillgångarna investeras passivt för att följa index. Passivt förvaltade fonder köper vanligtvis inte optioner, så indikatorn för sälj/köp-kvoten ger en bättre bild av stämningen i aktivt förvaltade fonder.
13F- och NPORT-arkiveringar
Detaljer om 13F-arkiveringar är gratis. Detaljer om NP-arkiveringar kräver ett premiummedlemskap. Gröna rader indikerar nya positioner. Röda rader indikerar stängda positioner. Klicka på länk symbolen för att se hela transaktionshistoriken.
Uppgradera
för att låsa upp premiumdata och exportera till Excel ![]() .
.
| Fil Datum | Källa | Investerare | Typ | Genomsnittligt pris (beräknat) |
Aktier | Δ Aktier (%) |
Rapporterat värde (1000 USD) |
Δ Värde (%) |
Portföljallokering (%) |
|
|---|---|---|---|---|---|---|---|---|---|---|
| 2025-08-18 | 13F | Geneos Wealth Management Inc. | 126 | 0,00 | 3 | 100,00 | ||||
| 2025-08-04 | 13F | Center for Financial Planning, Inc. | 160 | 0,00 | 3 | 50,00 | ||||
| 2025-08-07 | 13F | LFA - Lugano Financial Advisors SA | 0 | −100,00 | 0 | |||||
| 2025-08-07 | 13F | Flagship Wealth Advisors, Llc | 580 | 104,23 | 12 | 175,00 | ||||
| 2025-08-12 | 13F | LPL Financial LLC | 52 579 | 5,83 | 1 047 | 33,89 | ||||
| 2025-08-14 | 13F | Wells Fargo & Company/mn | 30 909 | −20,71 | 616 | 0,33 | ||||
| 2025-08-18 | 13F | Pacific Center for Financial Services | 201 | 0,00 | 4 | 33,33 | ||||
| 2025-05-14 | 13F | Stifel Financial Corp | 0 | −100,00 | 0 | |||||
| 2025-07-25 | 13F | NorthRock Partners, LLC | 850 | 0,00 | 17 | 23,08 | ||||
| 2025-08-08 | 13F | Emerald Investment Partners, Llc | 124 | 0,00 | 2 | 100,00 | ||||
| 2025-08-12 | 13F | BlackRock, Inc. | 6 408 | 148,18 | 128 | 217,50 | ||||
| 2025-08-15 | 13F | Morgan Stanley | 747 941 | 2,02 | 14 899 | 29,12 | ||||
| 2025-04-01 | 13F | Modus Advisors, LLC | 0 | −100,00 | 0 | −100,00 | ||||
| 2025-08-14 | 13F | Bnp Paribas Arbitrage, Sa | 299 315 | 106,99 | 5 962 | 161,95 | ||||
| 2025-07-25 | 13F | Community Bank, N.A. | 323 | 0,00 | 6 | 20,00 | ||||
| 2025-08-14 | 13F | Comerica Bank | 2 984 | 63,87 | 59 | 110,71 | ||||
| 2025-08-14 | 13F | Royal Bank Of Canada | 46 150 | 95,27 | 919 | 147,04 | ||||
| 2025-04-29 | 13F | Hm Payson & Co | 1 004 | 0,00 | 16 | −25,00 | ||||
| 2025-07-24 | 13F | Jfs Wealth Advisors, Llc | 0 | −100,00 | 0 | |||||
| 2025-08-14 | 13F | GWM Advisors LLC | 188 | 0,00 | 4 | 50,00 | ||||
| 2025-08-08 | 13F | MTM Investment Management, LLC | 55 | 0,00 | 1 | |||||
| 2025-05-13 | 13F | Aptus Capital Advisors, LLC | 0 | −100,00 | 0 | |||||
| 2025-08-08 | 13F | Glassman Wealth Services | 572 | 11 | ||||||
| 2025-07-24 | 13F | IFP Advisors, Inc | 758 | 2,85 | 15 | 36,36 | ||||
| 2025-07-25 | 13F | Natural Investments, Llc | 0 | −100,00 | 0 | |||||
| 2025-05-14 | 13F | Jane Street Group, Llc | 0 | −100,00 | 0 | |||||
| 2025-08-12 | 13F | MAI Capital Management | 5 296 | −19,39 | 106 | 1,94 | ||||
| 2025-07-15 | 13F | North Star Investment Management Corp. | 1 470 | 0,00 | 29 | 26,09 | ||||
| 2025-08-07 | 13F | CENTRAL TRUST Co | 200 | 0,00 | 4 | 0,00 | ||||
| 2025-08-05 | 13F | EPG Wealth Management LLC | 0 | −100,00 | 0 | |||||
| 2025-08-12 | 13F | Global Retirement Partners, LLC | 256 | 0,00 | 5 | 0,00 | ||||
| 2025-08-14 | 13F | Goldman Sachs Group Inc | 261 750 | 10,17 | 5 214 | 39,45 | ||||
| 2025-07-08 | 13F | Prism Advisors, Inc. | 10 638 | 3,18 | 212 | 30,25 | ||||
| 2025-07-10 | 13F | Piscataqua Savings Bank | 71 | 0,00 | 1 | 0,00 | ||||
| 2025-08-08 | 13F | Pnc Financial Services Group, Inc. | 1 929 | 0,00 | 38 | 26,67 | ||||
| 2025-08-12 | 13F | Jpmorgan Chase & Co | 1 415 | 42,93 | 28 | 86,67 | ||||
| 2025-08-06 | 13F | S&t Bank/pa | 140 | 0,00 | 3 | 0,00 | ||||
| 2025-08-08 | 13F | Hartland & Co., LLC | 100 | 0,00 | 2 | 0,00 | ||||
| 2025-08-07 | 13F | 1620 Investment Advisors, Inc. | 351 | 0,00 | 7 | 20,00 | ||||
| 2025-08-12 | 13F | Ameritas Investment Partners, Inc. | 197 | 0,00 | 4 | 0,00 | ||||
| 2025-08-14 | 13F | UBS Group AG | 69 598 | 102,67 | 1 386 | 156,67 | ||||
| 2025-08-11 | 13F | Citigroup Inc | 29 118 | 24,71 | 580 | 58,04 | ||||
| 2025-08-18 | 13F/A | National Bank Of Canada /fi/ | 2 592 | 22,55 | 52 | 54,55 | ||||
| 2025-07-07 | 13F | Thurston, Springer, Miller, Herd & Titak, Inc. | 30 | 0,00 | 1 | |||||
| 2025-07-08 | 13F | Parallel Advisors, LLC | 3 | −96,34 | 0 | −100,00 | ||||
| 2025-08-08 | 13F | Your Advocates Ltd., LLP | 131 | 0,00 | 3 | 0,00 | ||||
| 2025-07-31 | 13F | Wealthfront Advisers Llc | 24 644 | −13,34 | 491 | 9,62 | ||||
| 2025-08-11 | 13F | Wealthspire Advisors, LLC | 10 295 | −23,38 | 205 | −2,84 | ||||
| 2025-08-14 | 13F | Bank Of America Corp /de/ | 399 923 | −6,36 | 7 966 | 18,51 | ||||
| 2025-08-15 | 13F | Provenance Wealth Advisors, LLC | 0 | −100,00 | 0 | −100,00 | ||||
| 2025-08-08 | 13F | Fortis Group Advisors, LLC | 133 | 0,00 | 3 | 0,00 | ||||
| 2025-08-11 | 13F | Rothschild Investment Llc | 15 | 0,00 | 0 | |||||
| 2025-08-08 | 13F | Tanglewood Legacy Advisors, LLC | 1 223 | 0,16 | 24 | 26,32 | ||||
| 2025-08-14 | 13F | Federation des caisses Desjardins du Quebec | 1 205 | −10,41 | 24 | 14,29 | ||||
| 2025-08-08 | 13F | Cetera Investment Advisers | 13 880 | 8,97 | 276 | 38,00 | ||||
| 2025-07-24 | 13F | Stonebridge Financial Group, LLC | 0 | −100,00 | 0 | |||||
| 2025-08-13 | 13F | Kayne Anderson Rudnick Investment Management Llc | 125 | 0,00 | 2 | 100,00 | ||||
| 2025-08-08 | 13F | Family Firm, Inc. | 59 559 | −5,55 | 1 186 | 19,56 | ||||
| 2025-08-29 | 13F | Evolution Wealth Management Inc. | 311 | 6 | ||||||
| 2025-08-14 | 13F | Susquehanna International Group, Llp | Put | 17 700 | 353 | |||||
| 2025-08-14 | 13F | Susquehanna International Group, Llp | 73 535 | 28,20 | 1 465 | 62,31 | ||||
| 2025-05-15 | 13F | D. E. Shaw & Co., Inc. | 0 | −100,00 | 0 | |||||
| 2025-08-14 | 13F | Susquehanna International Group, Llp | Call | 11 600 | 231 | |||||
| 2025-07-10 | 13F | Moller Financial Services | 37 709 | 13,44 | 751 | 43,59 | ||||
| 2025-08-13 | 13F | Quadrant Capital Group Llc | 0 | −100,00 | 0 | |||||
| 2025-08-15 | 13F | Tower Research Capital LLC (TRC) | 43 126 | 859 | ||||||
| 2025-08-14 | 13F | Citadel Advisors Llc | Put | 0 | −100,00 | 0 | ||||
| 2025-05-12 | 13F | Founders Financial Alliance, LLC | 0 | −100,00 | 0 | |||||
| 2025-07-21 | 13F | Ameritas Advisory Services, LLC | 180 | 4 | ||||||
| 2025-07-15 | 13F | Retirement Income Solutions, Inc | 0 | −100,00 | 0 | |||||
| 2025-08-12 | 13F | Proequities, Inc. | 0 | 0 | ||||||
| 2025-04-29 | 13F | Harel Insurance Investments & Financial Services Ltd. | 0 | −100,00 | 0 | |||||
| 2025-05-14 | 13F | Legend Financial Advisors, Inc. | 0 | −100,00 | 0 | |||||
| 2025-07-15 | 13F | Financial Management Professionals, Inc. | 15 | 0,00 | 0 | |||||
| 2025-08-08 | 13F | Allianz Se | 264 068 | 20,54 | 5 260 | 52,55 | ||||
| 2025-08-11 | 13F | Principal Securities, Inc. | 25 | 0,00 | 0 | |||||
| 2025-08-13 | 13F | Northwestern Mutual Wealth Management Co | 3 236 | −9,30 | 64 | 14,29 | ||||
| 2025-08-14 | 13F | Citadel Advisors Llc | Call | 0 | −100,00 | 0 | ||||
| 2025-07-03 | 13F | Garde Capital, Inc. | 11 | 0,00 | 0 | |||||
| 2025-07-31 | 13F | Sage Mountain Advisors LLC | 4 | 0,00 | 0 | |||||
| 2025-08-14 | 13F/A | Barclays Plc | 770 | 0,00 | 0 | |||||
| 2025-07-21 | 13F | Mirae Asset Global Investments Co., Ltd. | 4 400 | 88 | ||||||
| 2025-07-23 | 13F | Hager Investment Management Services, Llc | 167 | 0,00 | 3 | 50,00 | ||||
| 2025-08-01 | 13F | Envestnet Asset Management Inc | 13 656 | −3,58 | 272 | 22,52 | ||||
| 2025-08-07 | 13F | Allworth Financial LP | 1 746 | 1 095,89 | 35 | 1 600,00 | ||||
| 2025-04-30 | 13F | Cerity Partners LLC | 0 | −100,00 | 0 | |||||
| 2025-07-11 | 13F | Farther Finance Advisors, LLC | 66 | 0,00 | 1 | 0,00 | ||||
| 2025-07-17 | 13F | City Holding Co | 0 | −100,00 | 0 | |||||
| 2025-07-14 | 13F | UMA Financial Services, Inc. | 736 | 5,29 | 15 | 27,27 | ||||
| 2025-07-17 | 13F | Elwood & Goetz Wealth Advisory Group, LLC | 17 316 | 345 | ||||||
| 2025-04-29 | 13F | Capital Investment Advisory Services, LLC | 0 | −100,00 | 0 | |||||
| 2025-07-16 | 13F/A | CX Institutional | 8 935 | −80,83 | 0 | |||||
| 2025-05-09 | 13F | Evolution Wealth Advisors, LLC | 0 | −100,00 | 0 | |||||
| 2025-07-14 | 13F | Armstrong Advisory Group, Inc | 30 | 0,00 | 1 | |||||
| 2025-07-24 | 13F | Trust Co Of Toledo Na /oh/ | 24 | 0 | ||||||
| 2025-09-04 | 13F/A | Advisor Group Holdings, Inc. | 39 829 | 3,89 | 793 | 31,51 | ||||
| 2025-07-09 | 13F | Breakwater Investment Management | 331 | 0,00 | 7 | 20,00 | ||||
| 2025-07-29 | 13F | Activest Wealth Management | 300 | 0,00 | 6 | 25,00 | ||||
| 2025-08-14 | 13F | Raymond James Financial Inc | 116 310 | −14,94 | 2 317 | 7,62 | ||||
| 2025-08-14 | 13F | Fmr Llc | 225 | −80,33 | 4 | −77,78 | ||||
| 2025-08-05 | 13F | Simplex Trading, Llc | 0 | −100,00 | 0 | |||||
| 2025-08-06 | 13F | First Horizon Advisors, Inc. | 712 | −10,33 | 14 | 16,67 | ||||
| 2025-08-11 | 13F | Tidemark, LLC | 0 | −100,00 | 0 | |||||
| 2025-07-16 | 13F | TigerOak Management, L.L.C. | 18 079 | −3,71 | 360 | 22,03 | ||||
| 2025-04-23 | 13F | Spire Wealth Management | 0 | −100,00 | 0 | |||||
| 2025-07-28 | 13F | BRYN MAWR TRUST Co | 188 | −34,72 | 4 | −25,00 | ||||
| 2025-05-15 | 13F | Alpine Global Management, LLC | 0 | −100,00 | 0 | −100,00 | ||||
| 2025-08-06 | 13F | SOUTH STATE Corp | 134 | 0,00 | 3 | 0,00 | ||||
| 2025-08-05 | 13F | Bank Of Montreal /can/ | 96 | 2 | ||||||
| 2025-08-18 | 13F | Hollencrest Capital Management | 35 | 0,00 | 1 | |||||
| 2025-08-06 | 13F | Commonwealth Equity Services, Llc | 16 595 | −59,90 | 0 | |||||
| 2025-07-29 | 13F | Private Trust Co Na | 0 | −100,00 | 0 | |||||
| 2025-07-18 | 13F | Bartlett & Co. Wealth Management Llc | 0 | −100,00 | 0 | |||||
| 2025-04-22 | 13F | Cambridge Investment Research Advisors, Inc. | 0 | −100,00 | 0 | |||||
| 2025-05-05 | 13F | Nwam Llc | 0 | −100,00 | 0 | |||||
| 2025-07-17 | 13F | Vermillion Wealth Management, Inc. | 464 | 0,22 | 9 | 28,57 | ||||
| 2025-08-08 | 13F | Gts Securities Llc | 44 093 | 878 | ||||||
| 2025-07-18 | 13F | SOA Wealth Advisors, LLC. | 368 | 0,27 | 7 | 40,00 | ||||
| 2025-07-24 | 13F | Us Bancorp \de\ | 114 | −24,00 | 2 | 0,00 | ||||
| 2025-08-13 | 13F | Quadrature Capital Ltd | 0 | −100,00 | 0 | |||||
| 2025-08-13 | 13F | Continuum Advisory, LLC | 0 | −100,00 | 0 | |||||
| 2025-07-21 | 13F | Kennebec Savings Bank | 303 | 0,00 | 6 | 50,00 | ||||
| 2025-08-13 | 13F | Mount Yale Investment Advisors, LLC | 260 | 5 | ||||||
| 2025-08-14 | 13F | Hrt Financial Lp | 0 | −100,00 | 0 | |||||
| 2025-08-13 | 13F | Millstone Evans Group, LLC | 357 | 0,00 | 7 | 40,00 | ||||
| 2025-08-06 | 13F | AE Wealth Management LLC | 10 | −98,31 | 0 | −100,00 | ||||
| 2025-08-12 | 13F | Steward Partners Investment Advisory, Llc | 3 505 | 0,00 | 70 | 25,45 | ||||
| 2025-07-30 | 13F | Financial Perspectives, Inc | 581 | 0,00 | 12 | 22,22 | ||||
| 2025-08-14 | 13F | McIlrath & Eck, LLC | 590 | 0,17 | 12 | 22,22 | ||||
| 2025-08-19 | 13F | Newbridge Financial Services Group, Inc. | 7 | 0,00 | 0 | |||||
| 2025-07-16 | 13F | Register Financial Advisors LLC | 65 | 0,00 | 1 | 0,00 | ||||
| 2025-07-17 | 13F | Albion Financial Group /ut | 1 397 | 0,00 | 28 | 28,57 | ||||
| 2025-08-14 | 13F | Ameriprise Financial Inc | 18 329 | −21,96 | 365 | −1,08 | ||||
| 2025-07-24 | 13F | Bernard Wealth Management Corp. | 12 | −40,00 | 0 | |||||
| 2025-05-15 | 13F | Citadel Advisors Llc | 0 | −100,00 | 0 | |||||
| 2025-05-15 | 13F | Bnp Paribas | 0 | −100,00 | 0 | |||||
| 2025-08-05 | 13F | GPS Wealth Strategies Group, LLC | 314 | −11,55 | 6 | 20,00 | ||||
| 2025-08-13 | 13F | Johnson Financial Group, Inc. | 2 087 | 42 | ||||||
| 2025-08-14 | 13F | EP Wealth Advisors, Inc. | 7 217 | −4,75 | 144 | 20,17 | ||||
| 2025-07-10 | 13F | Tompkins Financial Corp | 0 | −100,00 | 0 | |||||
| 2025-08-12 | 13F | Tradition Wealth Management, LLC | 11 949 | −5,42 | 238 | 20,20 | ||||
| 2025-08-12 | 13F | New Republic Capital, LLC | 41 | 0,00 | 1 | |||||
| 2025-07-16 | 13F | Townsend Asset Management Corp /nc/ /adv | 740 | −73,17 | 15 | −67,44 | ||||
| 2025-07-29 | 13F | John G Ullman & Associates Inc | 0 | −100,00 | 0 | |||||
| 2025-07-10 | 13F | Wealth Enhancement Advisory Services, Llc | 34 623 | 37,13 | 749 | 88,41 | ||||
| 2025-07-28 | 13F | Harbour Investments, Inc. | 158 | −16,40 | 3 | 50,00 | ||||
| 2025-08-01 | 13F | Motco | 2 245 | 0,00 | 51 | 45,71 | ||||
| 2025-08-19 | 13F | Asset Dedication, LLC | 46 | 0,00 | 1 | |||||
| 2025-07-25 | 13F | Envestnet Portfolio Solutions, Inc. | 70 530 | −15,37 | 1 405 | 7,09 | ||||
| 2025-08-12 | 13F | Howe & Rusling Inc | 4 060 | −35,55 | 81 | −19,19 | ||||
| 2025-08-11 | 13F | TD Waterhouse Canada Inc. | 54 | 0,00 | 1 | |||||
| 2025-07-18 | 13F | Truist Financial Corp | 27 824 | 7,83 | 554 | 36,45 | ||||
| 2025-08-12 | 13F | Wood Tarver Financial Group, LLC | 29 | 0,00 | 0 |
Other Listings
| MX:PBW |