Grundläggande statistik
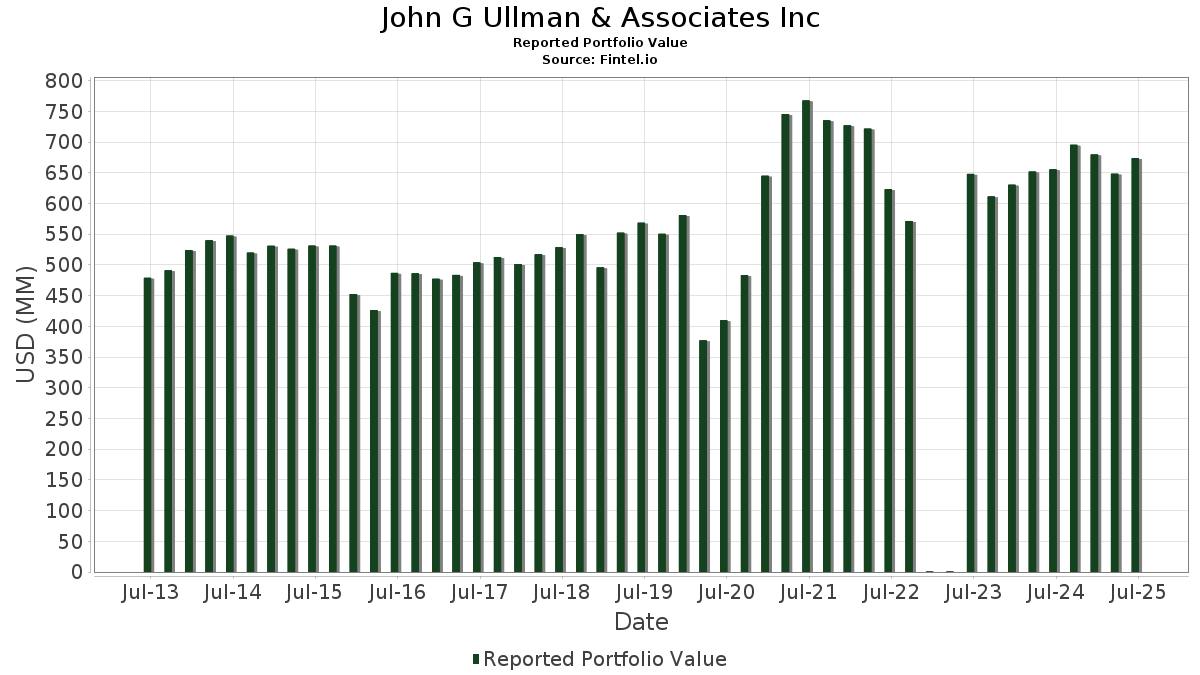
| Portföljvärde | $ 673 817 343 |
| Aktuella positioner | 174 |
Senaste innehav, resultat, förvaltat kapital (från 13F, 13D)
John G Ullman & Associates Inc har redovisat 174 totala innehav i sina senaste SEC-arkiveringar. Det senaste portföljvärdet beräknas vara $ 673 817 343 USD. Faktiskt förvaltade tillgångar (AUM) är detta värde plus likvida medel (som inte redovisas). John G Ullman & Associates Incs största innehav är Emerson Electric Co. (US:EMR) , Taiwan Semiconductor Manufacturing Company Limited - Depositary Receipt (Common Stock) (US:TSM) , Corning Incorporated (US:GLW) , International Business Machines Corporation (US:IBM) , and Broadcom Inc. (US:AVGO) . John G Ullman & Associates Incs nya positioner inkluderar Meta Platforms, Inc. (US:META) , Philip Morris International Inc. (US:PM) , Fluor Corporation (US:FLR) , Invesco Exchange-Traded Fund Trust - Invesco S&P 500 Equal Weight ETF (US:RSP) , and .
Största ökningarna detta kvartal
Vi använder förändringen i portföljallokeringen eftersom det är det mest meningsfulla måttet. Förändringar kan bero på transaktioner eller förändringar i aktiekurser.
| Värdepapper | Aktier (MM) |
Värde (MM$) |
Portfölj % av | ΔPortfölj % av |
|---|---|---|---|---|
| 0,09 | 24,12 | 3,5801 | 1,3079 | |
| 0,14 | 31,41 | 4,6618 | 1,0996 | |
| 0,28 | 37,86 | 5,6188 | 0,7952 | |
| 0,03 | 15,99 | 2,3731 | 0,5036 | |
| 0,08 | 24,39 | 3,6195 | 0,4253 | |
| 0,56 | 29,46 | 4,3725 | 0,3765 | |
| 0,10 | 17,53 | 2,6012 | 0,3213 | |
| 0,09 | 5,75 | 0,8530 | 0,3197 | |
| 0,06 | 8,35 | 1,2391 | 0,2936 | |
| 0,02 | 9,64 | 1,4313 | 0,2817 |
Största minskningarna detta kvartal
Vi använder förändringen i portföljallokeringen eftersom det är det mest meningsfulla måttet. Förändringar kan bero på transaktioner eller förändringar i aktiepriser.
| Värdepapper | Aktier (MM) |
Värde (MM$) |
Portfölj % av | ΔPortfölj % av |
|---|---|---|---|---|
| 0,00 | 0,71 | 0,1054 | −0,9317 | |
| 0,27 | 9,27 | 1,3754 | −0,5529 | |
| 0,00 | 0,74 | 0,1095 | −0,5195 | |
| 0,15 | 3,65 | 0,5421 | −0,4786 | |
| 0,15 | 7,16 | 1,0624 | −0,3994 | |
| 0,04 | 6,34 | 0,9411 | −0,3612 | |
| 0,05 | 1,50 | 0,2222 | −0,3257 | |
| 0,01 | 0,15 | 0,0228 | −0,3219 | |
| 0,51 | 22,83 | 3,3885 | −0,3004 | |
| 0,11 | 11,54 | 1,7125 | −0,2541 |
13F- och fond arkiveringar
Denna blankett lämnades in den 2025-07-29 för rapporteringsperioden 2025-06-30. Klicka på länksymbolen för att se hela transaktionshistoriken.
Uppgradera för att låsa upp premiumdata och exportera till Excel![]() .
.
| Värdepapper | Typ | Genomsnittligt aktiepris | Aktier (MM) |
ΔAktier (%) |
ΔAktier (%) |
Värde ($MM) |
Portfölj (%) |
ΔPortfölj (%) |
|
|---|---|---|---|---|---|---|---|---|---|
| EMR / Emerson Electric Co. | 0,28 | −0,45 | 37,86 | 21,06 | 5,6188 | 0,7952 | |||
| TSM / Taiwan Semiconductor Manufacturing Company Limited - Depositary Receipt (Common Stock) | 0,14 | −0,32 | 31,41 | 36,01 | 4,6618 | 1,0996 | |||
| GLW / Corning Incorporated | 0,56 | −1,01 | 29,46 | 13,72 | 4,3725 | 0,3765 | |||
| IBM / International Business Machines Corporation | 0,08 | −0,66 | 24,39 | 17,77 | 3,6195 | 0,4253 | |||
| AVGO / Broadcom Inc. | 0,09 | −0,54 | 24,12 | 63,75 | 3,5801 | 1,3079 | |||
| CSCO / Cisco Systems, Inc. | 0,34 | −0,50 | 23,33 | 11,87 | 3,4624 | 0,2457 | |||
| OGE / OGE Energy Corp. | 0,51 | −1,14 | 22,83 | −4,53 | 3,3885 | −0,3004 | |||
| TEL / TE Connectivity plc | 0,10 | −0,65 | 17,53 | 18,58 | 2,6012 | 0,3213 | |||
| NVS / Novartis AG - Depositary Receipt (Common Stock) | 0,14 | −0,52 | 16,63 | 7,99 | 2,4677 | 0,0928 | |||
| MSFT / Microsoft Corporation | 0,03 | −0,44 | 15,99 | 31,92 | 2,3731 | 0,5036 | |||
| AMZN / Amazon.com, Inc. | 0,07 | −0,50 | 15,09 | 14,74 | 2,2400 | 0,2110 | |||
| AMT / American Tower Corporation | 0,05 | −0,28 | 11,71 | 1,29 | 1,7379 | −0,0453 | |||
| XOM / Exxon Mobil Corporation | 0,11 | −0,16 | 11,54 | −9,50 | 1,7125 | −0,2541 | |||
| WTRG / Essential Utilities, Inc. | 0,27 | 1,95 | 9,88 | −4,21 | 1,4662 | −0,1245 | |||
| CACI / CACI International Inc | 0,02 | −0,41 | 9,64 | 29,40 | 1,4313 | 0,2817 | |||
| DIS / The Walt Disney Company | 0,08 | −11,55 | 9,47 | 11,12 | 1,4057 | 0,0911 | |||
| SLB / Schlumberger Limited | 0,27 | −8,33 | 9,27 | −25,87 | 1,3754 | −0,5529 | |||
| LNN / Lindsay Corporation | 0,06 | −1,16 | 8,39 | 12,69 | 1,2456 | 0,0969 | |||
| GNRC / Generac Holdings Inc. | 0,06 | 20,45 | 8,35 | 36,22 | 1,2391 | 0,2936 | |||
| ITRI / Itron, Inc. | 0,06 | −0,86 | 7,70 | 24,56 | 1,1426 | 0,1893 | |||
| ASTE / Astec Industries, Inc. | 0,18 | −1,30 | 7,67 | 19,45 | 1,1384 | 0,1479 | |||
| POR / Portland General Electric Company | 0,19 | 3,01 | 7,55 | −6,16 | 1,1212 | −0,1206 | |||
| FLS / Flowserve Corporation | 0,14 | −0,90 | 7,51 | 6,22 | 1,1149 | 0,0241 | |||
| MRK / Merck & Co., Inc. | 0,09 | 0,42 | 7,47 | −11,45 | 1,1080 | −0,1922 | |||
| GVA / Granite Construction Incorporated | 0,08 | −0,13 | 7,41 | 23,86 | 1,1002 | 0,1771 | |||
| ES / Eversource Energy | 0,11 | −0,27 | 7,17 | 2,17 | 1,0641 | −0,0184 | |||
| BMY / Bristol-Myers Squibb Company | 0,15 | −0,48 | 7,16 | −24,47 | 1,0624 | −0,3994 | |||
| HON / Honeywell International Inc. | 0,03 | −0,80 | 7,03 | 9,10 | 1,0433 | 0,0494 | |||
| BE / Bloom Energy Corporation | 0,28 | −0,63 | 6,76 | 20,90 | 1,0036 | 0,1409 | |||
| VMC / Vulcan Materials Company | 0,03 | −1,53 | 6,72 | 10,09 | 0,9977 | 0,0558 | |||
| MDU / MDU Resources Group, Inc. | 0,39 | −0,47 | 6,57 | −1,90 | 0,9755 | −0,0578 | |||
| FI / Fiserv, Inc. | 0,04 | −3,81 | 6,34 | −24,90 | 0,9411 | −0,3612 | |||
| WDC / Western Digital Corporation | 0,09 | −8,02 | 5,92 | 45,59 | 0,8788 | 0,2515 | |||
| D / Dominion Energy, Inc. | 0,10 | 0,92 | 5,83 | 1,73 | 0,8655 | −0,0187 | |||
| ECG / Everus Construction Group, Inc. | 0,09 | −2,95 | 5,75 | 66,24 | 0,8530 | 0,3197 | |||
| NJR / New Jersey Resources Corporation | 0,12 | −1,08 | 5,48 | −9,63 | 0,8137 | −0,1220 | |||
| SYY / Sysco Corporation | 0,07 | −4,16 | 5,47 | −3,25 | 0,8124 | −0,0604 | |||
| TMP / Tompkins Financial Corporation | 0,09 | −1,35 | 5,43 | −1,74 | 0,8053 | −0,0464 | |||
| LITE / Lumentum Holdings Inc. | 0,05 | −0,59 | 4,78 | 51,57 | 0,7089 | 0,2229 | |||
| NXST / Nexstar Media Group, Inc. | 0,03 | −0,36 | 4,77 | −3,85 | 0,7082 | −0,0573 | |||
| KNF / Knife River Corporation | 0,06 | −0,90 | 4,73 | −10,32 | 0,7026 | −0,1116 | |||
| EQT / EQT Corporation | 0,08 | −1,10 | 4,73 | 7,94 | 0,7019 | 0,0262 | |||
| TMO / Thermo Fisher Scientific Inc. | 0,01 | 29,87 | 4,71 | 5,82 | 0,6989 | 0,0125 | |||
| IDA / IDACORP, Inc. | 0,04 | −0,81 | 4,57 | −1,49 | 0,6788 | −0,0372 | |||
| STT / State Street Corporation | 0,04 | −1,11 | 4,57 | 17,45 | 0,6785 | 0,0782 | |||
| LOW / Lowe's Companies, Inc. | 0,02 | −2,00 | 4,56 | −6,77 | 0,6768 | −0,0777 | |||
| ORCL / Oracle Corporation | 0,02 | −0,48 | 4,52 | 55,64 | 0,6702 | 0,2226 | |||
| SNOW / Snowflake Inc. | 0,02 | −1,47 | 4,50 | 50,85 | 0,6683 | 0,2079 | |||
| COHR / Coherent Corp. | 0,05 | −1,01 | 4,36 | 35,97 | 0,6464 | 0,1524 | |||
| VNM / VanEck ETF Trust - VanEck Vietnam ETF | 0,31 | −3,99 | 4,32 | 5,78 | 0,6415 | 0,0112 | |||
| GRC / The Gorman-Rupp Company | 0,11 | −0,58 | 4,10 | 4,00 | 0,6092 | 0,0005 | |||
| ABT / Abbott Laboratories | 0,03 | 0,00 | 4,09 | 2,54 | 0,6063 | −0,0082 | |||
| INTC / Intel Corporation | 0,18 | −3,46 | 4,06 | −4,76 | 0,6025 | −0,0551 | |||
| GOOGL / Alphabet Inc. | 0,02 | 6,82 | 4,00 | 21,72 | 0,5939 | 0,0869 | |||
| HRI / Herc Holdings Inc. | 0,03 | −4,32 | 3,96 | −6,16 | 0,5879 | −0,0632 | |||
| VOO / Vanguard Index Funds - Vanguard S&P 500 ETF | 0,01 | −1,76 | 3,93 | 8,59 | 0,5836 | 0,0250 | |||
| GEHC / GE HealthCare Technologies Inc. | 0,05 | −4,79 | 3,84 | −12,64 | 0,5693 | −0,1078 | |||
| JAZZ / Jazz Pharmaceuticals plc | 0,04 | −8,20 | 3,81 | −21,54 | 0,5655 | −0,1835 | |||
| EA / Electronic Arts Inc. | 0,02 | −4,12 | 3,71 | 5,96 | 0,5510 | 0,0105 | |||
| PFE / Pfizer Inc. | 0,15 | −42,30 | 3,65 | −44,79 | 0,5421 | −0,4786 | |||
| CRM / Salesforce, Inc. | 0,01 | −3,58 | 3,62 | −2,00 | 0,5370 | −0,0326 | |||
| GE / General Electric Company | 0,01 | 0,00 | 3,53 | 28,61 | 0,5244 | 0,1006 | |||
| AAPL / Apple Inc. | 0,02 | 3,62 | 3,53 | −4,29 | 0,5232 | −0,0449 | |||
| EHC / Encompass Health Corporation | 0,03 | −1,55 | 3,51 | 19,20 | 0,5205 | 0,0667 | |||
| PEG / Public Service Enterprise Group Incorporated | 0,04 | −0,13 | 3,29 | 2,17 | 0,4888 | −0,0085 | |||
| EXP / Eagle Materials Inc. | 0,02 | 23,24 | 3,19 | 12,25 | 0,4732 | 0,0350 | |||
| GSK / GSK plc - Depositary Receipt (Common Stock) | 0,08 | −2,11 | 3,15 | −2,99 | 0,4679 | −0,0333 | |||
| PYPL / PayPal Holdings, Inc. | 0,04 | −6,78 | 3,07 | 6,16 | 0,4553 | 0,0097 | |||
| BKH / Black Hills Corporation | 0,05 | −1,76 | 2,97 | −9,15 | 0,4408 | −0,0633 | |||
| WTS / Watts Water Technologies, Inc. | 0,01 | −35,70 | 2,95 | −22,46 | 0,4371 | −0,1488 | |||
| GOOG / Alphabet Inc. | 0,02 | 28,05 | 2,69 | 45,43 | 0,3996 | 0,1140 | |||
| CCK / Crown Holdings, Inc. | 0,03 | −1,51 | 2,68 | 13,60 | 0,3980 | 0,0340 | |||
| AMGN / Amgen Inc. | 0,01 | −2,36 | 2,53 | −12,51 | 0,3759 | −0,0705 | |||
| SO / The Southern Company | 0,03 | −0,04 | 2,40 | −0,17 | 0,3556 | −0,0146 | |||
| ZBH / Zimmer Biomet Holdings, Inc. | 0,03 | −14,26 | 2,36 | −30,92 | 0,3499 | −0,1764 | |||
| BCE / BCE Inc. | 0,10 | −2,72 | 2,32 | −6,07 | 0,3449 | −0,0367 | |||
| VNT / Vontier Corporation | 0,06 | −0,64 | 2,28 | 11,58 | 0,3391 | 0,0233 | |||
| LLY / Eli Lilly and Company | 0,00 | 0,00 | 2,25 | −5,63 | 0,3335 | −0,0337 | |||
| SOLV / Solventum Corporation | 0,03 | −1,72 | 2,16 | −2,00 | 0,3208 | −0,0193 | |||
| BAX / Baxter International Inc. | 0,07 | −15,28 | 2,14 | −25,06 | 0,3183 | −0,1231 | |||
| UTHR / United Therapeutics Corporation | 0,01 | −1,02 | 2,09 | −7,72 | 0,3105 | −0,0393 | |||
| A / Agilent Technologies, Inc. | 0,02 | −5,27 | 2,02 | −4,41 | 0,2990 | −0,0262 | |||
| GEV / GE Vernova Inc. | 0,00 | 0,00 | 1,94 | 73,35 | 0,2877 | 0,1152 | |||
| EQNR / Equinor ASA - Depositary Receipt (Common Stock) | 0,08 | 5,82 | 1,92 | 0,58 | 0,2849 | −0,0095 | |||
| NEE / NextEra Energy, Inc. | 0,03 | 0,00 | 1,87 | −2,09 | 0,2776 | −0,0170 | |||
| SKBSY / Skanska AB (publ) - Depositary Receipt (Common Stock) | 0,07 | −0,13 | 1,71 | 4,91 | 0,2537 | 0,0024 | |||
| BCV / Bancroft Fund Ltd. | 0,08 | −2,85 | 1,57 | 5,45 | 0,2326 | 0,0033 | |||
| WBS / Webster Financial Corporation | 0,03 | −0,47 | 1,55 | 5,39 | 0,2296 | 0,0032 | |||
| AZTA / Azenta, Inc. | 0,05 | −52,57 | 1,50 | −57,85 | 0,2222 | −0,3257 | |||
| SNDK / Sandisk Corporation | 0,03 | −1,36 | 1,36 | −6,01 | 0,2019 | −0,0214 | |||
| CIEN / Ciena Corporation | 0,02 | 0,00 | 1,36 | 34,59 | 0,2016 | 0,0459 | |||
| HAL / Halliburton Company | 0,06 | 158,37 | 1,30 | 107,68 | 0,1927 | 0,0962 | |||
| VERSX / Vanguard Emerging Markets Stock Index Fund | 0,03 | −0,04 | 1,25 | 9,26 | 0,1857 | 0,0090 | |||
| OTTR / Otter Tail Corporation | 0,02 | 0,00 | 1,23 | −4,06 | 0,1825 | −0,0152 | |||
| ACVA / ACV Auctions Inc. | 0,07 | 0,00 | 1,08 | 15,22 | 0,1596 | 0,0155 | |||
| H / Hydro One Limited | 0,03 | 0,00 | 1,06 | 5,61 | 0,1567 | 0,0026 | |||
| EBMT / Eagle Bancorp Montana, Inc. | 0,06 | −2,50 | 0,98 | −2,99 | 0,1448 | −0,0104 | |||
| CVX / Chevron Corporation | 0,01 | 1,24 | 0,93 | −13,30 | 0,1375 | −0,0274 | |||
| BRK.B / Berkshire Hathaway Inc. | 0,00 | 4,45 | 0,91 | −4,80 | 0,1355 | −0,0123 | |||
| AGX / Argan, Inc. | 0,00 | 0,00 | 0,90 | 68,16 | 0,1342 | 0,0512 | |||
| MTSI / MACOM Technology Solutions Holdings, Inc. | 0,01 | 0,00 | 0,82 | 42,66 | 0,1212 | 0,0330 | |||
| DUK / Duke Energy Corporation | 0,01 | −2,08 | 0,81 | −5,18 | 0,1196 | −0,0116 | |||
| JCI / Johnson Controls International plc | 0,01 | 0,00 | 0,80 | 31,85 | 0,1187 | 0,0251 | |||
| CEG / Constellation Energy Corporation | 0,00 | 0,00 | 0,80 | 59,96 | 0,1181 | 0,0414 | |||
| SHEL / Shell plc - Depositary Receipt (Common Stock) | 0,01 | 0,91 | 0,78 | −3,10 | 0,1160 | −0,0083 | |||
| GILD / Gilead Sciences, Inc. | 0,01 | −0,03 | 0,78 | −1,02 | 0,1155 | −0,0058 | |||
| TXN / Texas Instruments Incorporated | 0,00 | −18,66 | 0,75 | −6,05 | 0,1108 | −0,0117 | |||
| REGN / Regeneron Pharmaceuticals, Inc. | 0,00 | −78,15 | 0,74 | −81,93 | 0,1095 | −0,5195 | |||
| EMA / Emera Incorporated | 0,02 | 0,00 | 0,72 | 8,72 | 0,1074 | 0,0048 | |||
| RBB / RBB Bancorp | 0,04 | 0,48 | 0,72 | 4,82 | 0,1066 | 0,0009 | |||
| BDX / Becton, Dickinson and Company | 0,00 | −85,95 | 0,71 | −89,44 | 0,1054 | −0,9317 | |||
| WSBF / Waterstone Financial, Inc. | 0,05 | −44,88 | 0,71 | −43,42 | 0,1047 | −0,0876 | |||
| LNT / Alliant Energy Corporation | 0,01 | 0,00 | 0,68 | −6,05 | 0,1014 | −0,0107 | |||
| TYG / Tortoise Energy Infrastructure Corporation | 0,02 | 0,00 | 0,67 | 1,83 | 0,0993 | −0,0019 | |||
| BP / BP p.l.c. - Depositary Receipt (Common Stock) | 0,02 | 0,00 | 0,66 | −11,49 | 0,0973 | −0,0169 | |||
| LH / Labcorp Holdings Inc. | 0,00 | 0,00 | 0,61 | 12,85 | 0,0900 | 0,0071 | |||
| AOS / A. O. Smith Corporation | 0,01 | 1,10 | 0,60 | 1,52 | 0,0895 | −0,0022 | |||
| XLU / The Select Sector SPDR Trust - The Utilities Select Sector SPDR Fund | 0,01 | 0,00 | 0,58 | 3,60 | 0,0855 | −0,0003 | |||
| APH / Amphenol Corporation | 0,01 | −61,16 | 0,57 | −41,54 | 0,0846 | −0,0658 | |||
| MMM / 3M Company | 0,00 | 0,00 | 0,56 | 3,68 | 0,0836 | −0,0002 | |||
| ITW / Illinois Tool Works Inc. | 0,00 | 0,00 | 0,54 | −0,37 | 0,0807 | −0,0034 | |||
| BUSE / First Busey Corporation | 0,02 | −6,17 | 0,53 | −0,56 | 0,0791 | −0,0036 | |||
| FELE / Franklin Electric Co., Inc. | 0,01 | 0,00 | 0,48 | −4,35 | 0,0719 | −0,0063 | |||
| OCFC / OceanFirst Financial Corp. | 0,03 | 9,24 | 0,48 | 13,00 | 0,0711 | 0,0058 | |||
| PANW / Palo Alto Networks, Inc. | 0,00 | 15,34 | 0,46 | 38,44 | 0,0685 | 0,0170 | |||
| PSX / Phillips 66 | 0,00 | 0,00 | 0,46 | −3,37 | 0,0682 | −0,0052 | |||
| MRNA / Moderna, Inc. | 0,02 | 7,69 | 0,44 | 4,96 | 0,0659 | 0,0006 | |||
| AGCO / AGCO Corporation | 0,00 | 0,00 | 0,44 | 11,31 | 0,0658 | 0,0044 | |||
| VTI / Vanguard Index Funds - Vanguard Total Stock Market ETF | 0,00 | 14,65 | 0,41 | 26,85 | 0,0611 | 0,0110 | |||
| MPC / Marathon Petroleum Corporation | 0,00 | 0,00 | 0,41 | 14,25 | 0,0607 | 0,0054 | |||
| CRUS / Cirrus Logic, Inc. | 0,00 | 0,00 | 0,41 | 4,64 | 0,0603 | 0,0004 | |||
| SHW / The Sherwin-Williams Company | 0,00 | 0,00 | 0,39 | −1,75 | 0,0586 | −0,0033 | |||
| ILMN / Illumina, Inc. | 0,00 | 13,89 | 0,39 | 37,19 | 0,0581 | 0,0140 | |||
| KO / The Coca-Cola Company | 0,01 | −0,24 | 0,39 | −1,52 | 0,0577 | −0,0031 | |||
| APTV / Aptiv PLC | 0,01 | −74,43 | 0,38 | −70,68 | 0,0567 | −0,1443 | |||
| AEP / American Electric Power Company, Inc. | 0,00 | −3,15 | 0,36 | −8,18 | 0,0534 | −0,0070 | |||
| ITT / ITT Inc. | 0,00 | 0,00 | 0,36 | 21,28 | 0,0534 | 0,0077 | |||
| NWFL / Norwood Financial Corp. | 0,01 | −38,74 | 0,35 | −34,70 | 0,0520 | −0,0307 | |||
| NTIOF / National Bank of Canada | 0,00 | 0,00 | 0,34 | 25,18 | 0,0510 | 0,0086 | |||
| MU / Micron Technology, Inc. | 0,00 | −15,32 | 0,34 | 20,14 | 0,0505 | 0,0068 | |||
| TDC / Teradata Corporation | 0,02 | −56,23 | 0,34 | −56,65 | 0,0500 | −0,0696 | |||
| EEMV / iShares, Inc. - iShares MSCI Emerging Markets Min Vol Factor ETF | 0,01 | 0,00 | 0,34 | 7,37 | 0,0499 | 0,0017 | |||
| XYL / Xylem Inc. | 0,00 | 0,00 | 0,33 | 8,12 | 0,0495 | 0,0020 | |||
| AQN / Algonquin Power & Utilities Corp. | 0,06 | 30,16 | 0,32 | 45,25 | 0,0477 | 0,0135 | |||
| GABC / German American Bancorp, Inc. | 0,01 | 0,00 | 0,32 | 2,61 | 0,0468 | −0,0006 | |||
| ETN / Eaton Corporation plc | 0,00 | 0,00 | 0,31 | 31,49 | 0,0460 | 0,0096 | |||
| IQV / IQVIA Holdings Inc. | 0,00 | 0,00 | 0,30 | −10,48 | 0,0444 | −0,0072 | |||
| VGT / Vanguard World Fund - Vanguard Information Technology ETF | 0,00 | 0,00 | 0,30 | 22,41 | 0,0438 | 0,0066 | |||
| ROP / Roper Technologies, Inc. | 0,00 | 0,00 | 0,28 | −3,82 | 0,0412 | −0,0033 | |||
| PHO / Invesco Exchange-Traded Fund Trust - Invesco Water Resources ETF | 0,00 | 0,00 | 0,27 | 8,73 | 0,0407 | 0,0017 | |||
| ACM / AECOM | 0,00 | 0,00 | 0,27 | 22,12 | 0,0394 | 0,0058 | |||
| WEC / WEC Energy Group, Inc. | 0,00 | −0,56 | 0,26 | −5,19 | 0,0381 | −0,0036 | |||
| KRE / SPDR Series Trust - SPDR S&P Regional Banking ETF | 0,00 | 0,00 | 0,26 | 4,51 | 0,0379 | 0,0002 | |||
| XRAY / DENTSPLY SIRONA Inc. | 0,02 | −38,04 | 0,25 | −34,21 | 0,0372 | −0,0215 | |||
| GM / General Motors Company | 0,01 | 0,00 | 0,25 | 4,64 | 0,0369 | 0,0002 | |||
| TPC / Tutor Perini Corporation | 0,01 | 0,23 | 0,0347 | 0,0347 | |||||
| META / Meta Platforms, Inc. | 0,00 | 0,23 | 0,0345 | 0,0345 | |||||
| CRH ADR REPSG 1 ORD / ADR (12626K203) | 0,00 | 0,23 | 0,0000 | ||||||
| PM / Philip Morris International Inc. | 0,00 | 0,22 | 0,0324 | 0,0324 | |||||
| FE / FirstEnergy Corp. | 0,01 | 0,00 | 0,22 | −0,46 | 0,0323 | −0,0014 | |||
| RHHBY / Roche Holding AG - Depositary Receipt (Common Stock) | 0,01 | −14,52 | 0,22 | −15,29 | 0,0321 | −0,0073 | |||
| IBB / iShares Trust - iShares Biotechnology ETF | 0,00 | −5,56 | 0,22 | −6,52 | 0,0319 | −0,0036 | |||
| MOS / The Mosaic Company | 0,01 | 0,21 | 0,0311 | 0,0311 | |||||
| VZ / Verizon Communications Inc. | 0,00 | −1,00 | 0,21 | −5,43 | 0,0310 | −0,0031 | |||
| QQQ / Invesco QQQ Trust, Series 1 | 0,00 | 0,21 | 0,0310 | 0,0310 | |||||
| FLR / Fluor Corporation | 0,00 | 0,21 | 0,0304 | 0,0304 | |||||
| ASRV / AmeriServ Financial, Inc. | 0,07 | −70,77 | 0,20 | −63,44 | 0,0303 | −0,0559 | |||
| RSP / Invesco Exchange-Traded Fund Trust - Invesco S&P 500 Equal Weight ETF | 0,00 | 0,20 | 0,0299 | 0,0299 | |||||
| BSX / Boston Scientific Corporation | 0,00 | 0,20 | 0,0299 | 0,0299 | |||||
| DGX / Quest Diagnostics Incorporated | 0,00 | 0,20 | 0,0297 | 0,0297 | |||||
| GT / The Goodyear Tire & Rubber Company | 0,02 | 0,00 | 0,19 | 12,05 | 0,0277 | 0,0020 | |||
| MXF / The Mexico Fund, Inc. | 0,01 | 0,00 | 0,19 | 24,00 | 0,0276 | 0,0044 | |||
| AVTR / Avantor, Inc. | 0,01 | −91,73 | 0,15 | −93,15 | 0,0228 | −0,3219 | |||
| AVLNF / Avalon Advanced Materials Inc. | 0,02 | 0,00 | 0,00 | 0,0001 | 0,0000 | ||||
| ALB / Albemarle Corporation | 0,00 | −100,00 | 0,00 | 0,0000 | |||||
| LGTY / Logility Supply Chain Solutions, Inc. | 0,00 | −100,00 | 0,00 | 0,0000 | |||||
| PBW / Invesco Exchange-Traded Fund Trust - Invesco WilderHill Clean Energy ETF | 0,00 | −100,00 | 0,00 | 0,0000 | |||||
| ARCB / ArcBest Corporation | 0,00 | −100,00 | 0,00 | 0,0000 | |||||
| STX / Seagate Technology Holdings plc | 0,00 | −100,00 | 0,00 | 0,0000 |