Grundläggande statistik
| Institutionella ägare | 133 total, 133 long only, 0 short only, 0 long/short - change of −2,19% MRQ |
| Genomsnittlig portföljallokering | 0.0385 % - change of −21,17% MRQ |
| Institutionella aktier (lång) | 6 485 090 (ex 13D/G) - change of −0,18MM shares −2,69% MRQ |
| Institutionellt värde (lång) | $ 303 982 USD ($1000) |
Institutionellt ägande och aktieägare
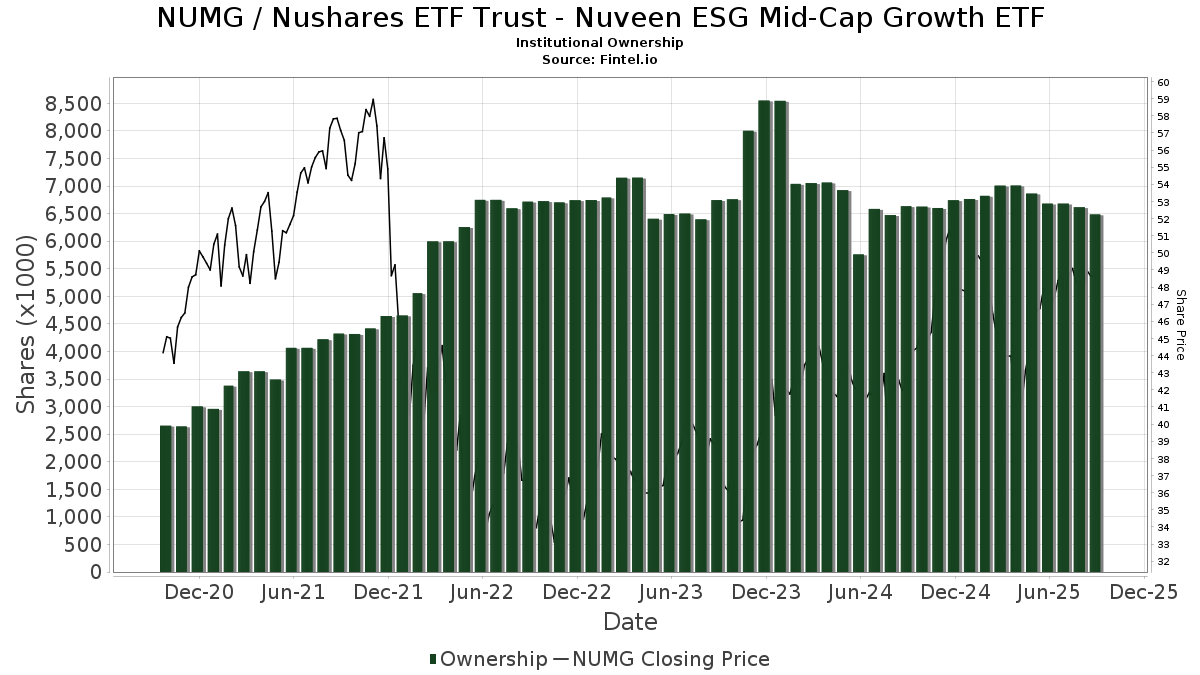
Nushares ETF Trust - Nuveen ESG Mid-Cap Growth ETF (US:NUMG) har 133 Institutionella ägare och aktieägare som har lämnat in 13D/G- eller 13F-formulär till Securities Exchange Commission (SEC). Dessa institut innehar totalt 6,485,090 aktier. Största aktieägare inkluderar Morgan Stanley, Wells Fargo & Company/mn, Royal Bank Of Canada, Tiaa Trust, National Association, LPL Financial LLC, Bank of New York Mellon Corp, Bank Of America Corp /de/, Ameriprise Financial Inc, UBS Group AG, and AlTi Global, Inc. .
Nushares ETF Trust - Nuveen ESG Mid-Cap Growth ETF (BATS:NUMG) Institutionell ägarstruktur visar institutioners och fonders nuvarande positioner i företaget, samt de senaste förändringarna i positionernas storlek. Större aktieägare kan vara enskilda investerare, fonder, hedgefonder eller institutioner. Bilaga 13D visar att investeraren äger (eller ägde) mer än 5% av företaget och avser (eller avsåg) att aktivt eftersträva en förändring av affärsstrategin. Schedule 13G indikerar en passiv investering på över 5%.
The share price as of September 8, 2025 is 49,20 / share. Previously, on September 9, 2024, the share price was 41,84 / share. This represents an increase of 17,58% over that period.
Fondsentimentets poäng
Fondsentimentet poängen(fka Ägarackumulation-poäng) visar vilka aktier som är mest köpta av fonder. Det är resultatet av en sofistikerad kvantitativ flerfaktormodell som identifierar företag med de högsta nivåerna av institutionell ackumulering. Poängsättningsmodellen använder en kombination av den totala ökningen av redovisade ägare, förändringarna i portföljallokeringarna för dessa ägare och andra mått. Siffran sträcker sig från 0 till 100, där högre siffror indikerar en högre nivå av ackumulering i förhållande till sina konkurrenter, och 50 är genomsnittet.
Uppdateringsfrekvens: Dagligen
Se Ownership Explorer, som innehåller en lista över de högst rankade företagen.
Institutionell sälj/köp-kvot
Förutom att rapportera vanliga eget kapital- och skuldemissioner måste institutioner med mer än 100MM tillgångar under förvaltning också avslöja sina innehav av sälj- och köpoptioner. Eftersom säljoptioner i allmänhet indikerar ett negativt sentiment och köpoptioner indikerar ett positivt sentiment, kan vi få en uppfattning om det övergripande institutionella sentimentet genom att plotta förhållandet mellan säljoptioner och köpoptioner. Diagrammet till höger visar det historiska förhållandet mellan sälj- och köpoptioner för detta instrument.
Genom att använda sälj/köp-kvoten som en indikator på aktieägarnas sentiment undviker man en av de största bristerna med att använda det totala institutionella ägandet, nämligen att en betydande del av de förvaltade tillgångarna investeras passivt för att följa index. Passivt förvaltade fonder köper vanligtvis inte optioner, så indikatorn för sälj/köp-kvoten ger en bättre bild av stämningen i aktivt förvaltade fonder.
13F- och NPORT-arkiveringar
Detaljer om 13F-arkiveringar är gratis. Detaljer om NP-arkiveringar kräver ett premiummedlemskap. Gröna rader indikerar nya positioner. Röda rader indikerar stängda positioner. Klicka på länk symbolen för att se hela transaktionshistoriken.
Uppgradera
för att låsa upp premiumdata och exportera till Excel ![]() .
.
| Fil Datum | Källa | Investerare | Typ | Genomsnittligt pris (beräknat) |
Aktier | Δ Aktier (%) |
Rapporterat värde (1000 USD) |
Δ Värde (%) |
Portföljallokering (%) |
|
|---|---|---|---|---|---|---|---|---|---|---|
| 2025-08-14 | 13F | Comerica Bank | 3 075 | 54,83 | 149 | 74,12 | ||||
| 2025-08-07 | 13F | McClarren Financial Advisors, Inc. | 7 314 | 28,54 | 354 | |||||
| 2025-08-13 | 13F | Millstone Evans Group, LLC | 1 337 | −3,81 | 65 | 8,47 | ||||
| 2025-08-18 | 13F | Front Row Advisors LLC | 505 | 0,00 | 24 | 14,29 | ||||
| 2025-08-08 | 13F | Cetera Investment Advisers | 81 032 | −17,43 | 3 926 | −6,79 | ||||
| 2025-07-18 | 13F | SOA Wealth Advisors, LLC. | 7 723 | −48,77 | 374 | −42,19 | ||||
| 2025-07-18 | 13F | Vicus Capital | 22 267 | 0,18 | 1 079 | 13,12 | ||||
| 2025-08-12 | 13F | LPL Financial LLC | 472 802 | 9,72 | 22 907 | 23,86 | ||||
| 2025-05-05 | 13F | Darden Wealth Group Inc | 0 | −100,00 | 0 | |||||
| 2025-08-08 | 13F | Larson Financial Group LLC | 7 369 | −6,87 | 357 | 5,31 | ||||
| 2025-08-12 | 13F | Proequities, Inc. | 0 | 0 | ||||||
| 2025-07-08 | 13F | Rise Advisors, LLC | 55 | 0,00 | 3 | 0,00 | ||||
| 2025-07-15 | 13F | McAdam, LLC | 4 750 | 230 | ||||||
| 2025-08-06 | 13F | SOUTH STATE Corp | 24 | 0,00 | 1 | 0,00 | ||||
| 2025-08-08 | 13F | ERTS Wealth Advisors, LLC | 0 | −100,00 | 0 | |||||
| 2025-08-11 | 13F | Annis Gardner Whiting Capital Advisors, LLC | 191 | 4,37 | 9 | 28,57 | ||||
| 2025-08-14 | 13F | Bank Of America Corp /de/ | 347 720 | 4,70 | 16 847 | 18,19 | ||||
| 2025-08-13 | 13F | Cerity Partners LLC | 16 031 | 781 | ||||||
| 2025-08-14 | 13F | IHT Wealth Management, LLC | 8 795 | −1,64 | 426 | 11,23 | ||||
| 2025-08-11 | 13F | HighTower Advisors, LLC | 8 981 | −5,12 | 435 | 7,14 | ||||
| 2025-08-07 | 13F | Allworth Financial LP | 1 013 | 0,00 | 49 | 16,67 | ||||
| 2025-08-14 | 13F | UBS Group AG | 224 357 | 8,11 | 10 870 | 22,04 | ||||
| 2025-07-21 | 13F | Empirical Financial Services, LLC d.b.a. Empirical Wealth Management | 6 138 | 17,16 | 297 | 32,59 | ||||
| 2025-07-16 | 13F/A | CX Institutional | 4 751 | −5,90 | 0 | |||||
| 2025-07-16 | 13F | Falcon Wealth Planning | 4 328 | 210 | ||||||
| 2025-05-08 | 13F | Us Financial Advisors, Llc | 14 002 | 4,26 | 601 | −5,66 | ||||
| 2025-08-14 | 13F | CoreCap Advisors, LLC | 340 | 0,00 | 16 | 14,29 | ||||
| 2025-08-12 | 13F | Virtu Financial LLC | 0 | −100,00 | 0 | |||||
| 2025-08-12 | 13F | O'shaughnessy Asset Management, Llc | 2 080 | −67,08 | 101 | −63,10 | ||||
| 2025-08-07 | 13F | PFG Advisors | 4 796 | −1,66 | 232 | 11,00 | ||||
| 2025-08-14 | 13F | Susquehanna International Group, Llp | 0 | −100,00 | 0 | |||||
| 2025-08-13 | 13F | SageView Advisory Group, LLC | 12 050 | 0,00 | 595 | 15,09 | ||||
| 2025-07-29 | 13F | Stratos Wealth Partners, LTD. | 5 030 | 244 | ||||||
| 2025-08-13 | 13F | Jones Financial Companies Lllp | 55 010 | 9,87 | 2 641 | 23,01 | ||||
| 2025-08-05 | 13F | GPS Wealth Strategies Group, LLC | 217 | 0,00 | 11 | 11,11 | ||||
| 2025-05-15 | 13F | Citadel Advisors Llc | 0 | −100,00 | 0 | |||||
| 2025-07-18 | 13F | Truist Financial Corp | 9 481 | 0,43 | 459 | 13,33 | ||||
| 2025-08-15 | 13F | Resources Management Corp /ct/ /adv | 0 | −100,00 | 0 | |||||
| 2025-08-14 | 13F | Abound Financial, Llc | 0 | −100,00 | 0 | |||||
| 2025-07-09 | 13F | Dynamic Advisor Solutions LLC | 22 800 | −19,01 | 1 105 | −8,61 | ||||
| 2025-08-08 | 13F | Pnc Financial Services Group, Inc. | 39 789 | −11,65 | 1 928 | −0,26 | ||||
| 2025-08-14 | 13F | Archetype Wealth Partners | 4 804 | −3,55 | 0 | |||||
| 2025-04-21 | 13F | Nelson, Van Denburg & Campbell Wealth Management Group, LLC | 0 | −100,00 | 0 | |||||
| 2025-08-05 | 13F | Dunhill Financial, LLC | 2 995 | 1,08 | 145 | 14,17 | ||||
| 2025-08-12 | 13F | MAI Capital Management | 409 | 0,00 | 20 | 11,76 | ||||
| 2025-07-30 | 13F | Fingerlakes Wealth Management, Inc. | 8 757 | 19,26 | 424 | 34,60 | ||||
| 2025-08-08 | 13F | Creative Planning | 77 496 | −0,02 | 3 755 | 12,87 | ||||
| 2025-08-14 | 13F | Goldman Sachs Group Inc | 37 521 | 0,68 | 1 818 | 13,63 | ||||
| 2025-07-17 | 13F | Neumann Capital Management, LLC | 11 180 | 0,00 | 542 | 12,94 | ||||
| 2025-05-09 | 13F | Thoroughbred Financial Services, Llc | 0 | −100,00 | 0 | |||||
| 2025-07-15 | 13F | RTD Financial Advisors, Inc. | 16 291 | −22,47 | 789 | −12,43 | ||||
| 2025-07-31 | 13F | Cambridge Investment Research Advisors, Inc. | 13 844 | −5,46 | 1 | |||||
| 2025-08-14 | 13F | Mercer Global Advisors Inc /adv | 11 089 | 108,40 | 537 | 135,53 | ||||
| 2025-04-28 | 13F | Money Design Co.,Ltd. | 0 | −100,00 | 0 | |||||
| 2025-07-08 | 13F | Parallel Advisors, LLC | 418 | 0,00 | 20 | 17,65 | ||||
| 2025-08-14 | 13F | Raymond James Financial Inc | 104 906 | −1,31 | 5 083 | 11,40 | ||||
| 2025-05-09 | 13F | Avalon Trust Co | 0 | −100,00 | 0 | |||||
| 2025-08-05 | 13F | Tiaa Trust, National Association | 498 599 | −17,26 | 24 157 | −6,60 | ||||
| 2025-04-16 | 13F | Sound Stewardship, LLC | 0 | −100,00 | 0 | |||||
| 2025-08-01 | 13F | Motco | 1 248 | 0,00 | 61 | 13,21 | ||||
| 2025-08-07 | 13F | CENTRAL TRUST Co | 10 207 | 19,62 | 495 | 34,97 | ||||
| 2025-08-07 | 13F | LFA - Lugano Financial Advisors SA | 0 | −100,00 | 0 | |||||
| 2025-08-13 | 13F | Beacon Pointe Advisors, LLC | 37 704 | 5,70 | 1 827 | 19,35 | ||||
| 2025-07-25 | 13F | Pandora Wealth, Inc. | 20 | 0,00 | 1 | |||||
| 2025-04-29 | 13F | Financial Network Wealth Management LLC | 15 748 | −50,15 | 1 | −100,00 | ||||
| 2025-08-06 | 13F | Simmons Bank | 8 328 | −2,35 | 403 | 10,11 | ||||
| 2025-07-24 | 13F | Us Bancorp \de\ | 1 523 | 0,00 | 74 | 12,31 | ||||
| 2025-08-12 | 13F | AlphaCore Capital LLC | 0 | −100,00 | 0 | |||||
| 2025-08-13 | 13F | Northwestern Mutual Wealth Management Co | 25 369 | −14,93 | 1 229 | −3,91 | ||||
| 2025-07-28 | 13F | Revolve Wealth Partners, LLC | 24 482 | 3,15 | 1 186 | 16,50 | ||||
| 2025-08-13 | 13F | WCG Wealth Advisors LLC | 26 885 | −3,10 | 1 303 | 9,41 | ||||
| 2025-07-29 | 13F | Aire Advisors, Llc | 5 409 | 0,00 | 262 | 12,93 | ||||
| 2025-04-29 | 13F | Values Added Financial LLC | 0 | −100,00 | 0 | |||||
| 2025-08-14 | 13F | Fmr Llc | 262 | −49,32 | 13 | −45,45 | ||||
| 2025-08-04 | 13F | Creative Financial Designs Inc /adv | 140 | 0,00 | 7 | 0,00 | ||||
| 2025-05-14 | 13F | Retirement Capital Strategies | 0 | −100,00 | 0 | |||||
| 2025-08-05 | 13F | Huntington National Bank | 154 | |||||||
| 2025-08-13 | 13F | Flow Traders U.s. Llc | 13 048 | 1 | ||||||
| 2025-07-07 | 13F | Trust Co | 5 845 | −8,64 | 283 | 3,28 | ||||
| 2025-08-26 | 13F/A | Thrivent Financial For Lutherans | 0 | −100,00 | 0 | |||||
| 2025-07-16 | 13F | Evergreen Private Wealth LLC | 7 297 | −15,45 | 354 | −4,59 | ||||
| 2025-08-19 | 13F | Cape Investment Advisory, Inc. | 179 | 18,54 | 9 | 33,33 | ||||
| 2025-08-13 | 13F | Lido Advisors, LLC | 18 270 | −19,27 | 885 | −8,86 | ||||
| 2025-08-11 | 13F | Cornerstone Planning Group LLC | 3 478 | 0,00 | 167 | 16,78 | ||||
| 2025-07-08 | 13F | Nbc Securities, Inc. | 54 | 0,00 | 0 | |||||
| 2025-08-01 | 13F | Envestnet Asset Management Inc | 57 437 | −0,03 | 2 783 | 12,86 | ||||
| 2025-08-06 | 13F | Golden State Wealth Management, LLC | 6 193 | −2,85 | 300 | 9,89 | ||||
| 2025-08-14 | 13F | Bragg Financial Advisors, Inc | 5 358 | 6,06 | 260 | 19,91 | ||||
| 2025-08-14 | 13F | Ameriprise Financial Inc | 268 035 | 30,74 | 12 995 | 47,32 | ||||
| 2025-08-11 | 13F | Private Advisor Group, LLC | 11 031 | −45,31 | 534 | −38,27 | ||||
| 2025-08-12 | 13F | Wood Tarver Financial Group, LLC | 678 | 0,00 | 0 | −100,00 | ||||
| 2025-08-14 | 13F | GWM Advisors LLC | 15 659 | 6,25 | 759 | 19,94 | ||||
| 2025-08-12 | 13F | Cook Wealth Management Group Llc | 0 | −100,00 | 0 | |||||
| 2025-08-11 | 13F | Aptus Capital Advisors, LLC | 107 | 64,62 | 5 | 150,00 | ||||
| 2025-07-11 | 13F/A | Umb Bank N A/mo | 1 383 | −36,21 | 67 | −27,96 | ||||
| 2025-07-30 | 13F | Whittier Trust Co Of Nevada Inc | 61 491 | −1,51 | 2 979 | 11,24 | ||||
| 2025-08-12 | 13F | Waterloo Capital, L.P. | 0 | −100,00 | 0 | |||||
| 2025-08-14 | 13F | Evergreen Capital Management Llc | 7 165 | 347 | ||||||
| 2025-08-15 | 13F | CI Private Wealth, LLC | 8 265 | 52,63 | 400 | 72,41 | ||||
| 2025-07-31 | 13F | LongView Asset Management LLC | 6 320 | −11,07 | 306 | 0,33 | ||||
| 2025-07-30 | 13F | Whittier Trust Co | 62 623 | −9,29 | 3 034 | 2,43 | ||||
| 2025-08-13 | 13F | Cresset Asset Management, LLC | 6 038 | 0,00 | 293 | 12,74 | ||||
| 2025-07-15 | 13F | Fifth Third Bancorp | 2 760 | 0,00 | 134 | 12,71 | ||||
| 2025-05-14 | 13F | CIBC Private Wealth Group, LLC | 0 | −100,00 | 0 | −100,00 | ||||
| 2025-08-13 | 13F | EverSource Wealth Advisors, LLC | 53 | 0,00 | 3 | 0,00 | ||||
| 2025-09-04 | 13F/A | Advisor Group Holdings, Inc. | 14 699 | −21,56 | 712 | −11,44 | ||||
| 2025-08-14 | 13F | EP Wealth Advisors, Inc. | 2 242 | 109 | ||||||
| 2025-07-25 | 13F | Cwm, Llc | 8 001 | 119,75 | 0 | |||||
| 2025-07-10 | 13F | Wealth Enhancement Advisory Services, Llc | 17 571 | 177,93 | 862 | 218,08 | ||||
| 2025-04-22 | 13F/A | NorthRock Partners, LLC | 0 | −100,00 | 0 | −100,00 | ||||
| 2025-07-31 | 13F | AlTi Global, Inc. | 157 208 | −36,50 | 7 617 | −28,32 | ||||
| 2025-07-22 | 13F | DT Investment Partners, LLC | 110 | −42,11 | 5 | −37,50 | ||||
| 2025-07-08 | 13F | Canandaigua National Bank & Trust Co | 10 244 | 37,10 | 496 | 55,00 | ||||
| 2025-08-12 | 13F | Ameritas Investment Partners, Inc. | 1 628 | 0,00 | 79 | 13,04 | ||||
| 2025-08-07 | 13F | Commerce Bank | 20 034 | −10,36 | 971 | 1,15 | ||||
| 2025-07-15 | 13F | RVW Wealth, LLC | 7 310 | −2,71 | 354 | 9,94 | ||||
| 2025-08-06 | 13F | Commonwealth Equity Services, Llc | 142 475 | 13,38 | 7 | 20,00 | ||||
| 2025-08-14 | 13F | Qube Research & Technologies Ltd | 1 412 | −14,32 | 68 | −2,86 | ||||
| 2025-08-12 | 13F | Coldstream Capital Management Inc | 11 500 | 0,00 | 557 | 12,98 | ||||
| 2025-08-14 | 13F | Atomi Financial Group, Inc. | 4 521 | 219 | ||||||
| 2025-08-14 | 13F | Fiduciary Trust Co | 63 303 | 0,00 | 3 067 | 12,92 | ||||
| 2025-08-14 | 13F | Mml Investors Services, Llc | 5 412 | 12,66 | 0 | |||||
| 2025-07-21 | 13F | Ameritas Advisory Services, LLC | 94 703 | −12,07 | 4 588 | −0,74 | ||||
| 2025-07-21 | 13F | Mirae Asset Global Investments Co., Ltd. | 12 200 | 1,67 | 591 | 14,98 | ||||
| 2025-07-30 | 13F | Crewe Advisors LLC | 306 | 0,00 | 15 | 7,69 | ||||
| 2025-08-06 | 13F | First Horizon Advisors, Inc. | 0 | −100,00 | 0 | |||||
| 2025-08-14 | 13F | Old Mission Capital Llc | 0 | −100,00 | 0 | |||||
| 2025-08-14 | 13F | Wiley Bros.-aintree Capital, Llc | 8 533 | −18,87 | 413 | −8,65 | ||||
| 2025-08-05 | 13F | Bank of New York Mellon Corp | 382 679 | 7,16 | 18 541 | 20,96 | ||||
| 2025-05-09 | 13F | Syntegra Private Wealth Group, LLC | 0 | −100,00 | 0 | |||||
| 2025-07-23 | 13F | High Note Wealth, LLC | 16 775 | −2,60 | 813 | 9,88 | ||||
| 2025-07-25 | 13F | Atria Wealth Solutions, Inc. | 7 745 | −13,36 | 380 | −0,78 | ||||
| 2025-08-12 | 13F | Steward Partners Investment Advisory, Llc | 416 | 0,00 | 20 | 17,65 | ||||
| 2025-07-29 | 13F | Harbor Asset Planning, Inc. | 2 058 | 100 | ||||||
| 2025-08-01 | 13F | Rossby Financial, LCC | 88 | 0,00 | 4 | 33,33 | ||||
| 2025-08-15 | 13F/A | MONECO Advisors, LLC | 0 | −100,00 | 0 | −100,00 | ||||
| 2025-08-14 | 13F | Colony Group, LLC | 7 149 | 9,20 | 346 | 23,57 | ||||
| 2025-07-18 | 13F/A | MJT & Associates Financial Advisory Group, Inc. | 1 071 | −29,63 | 52 | −21,54 | ||||
| 2025-07-24 | 13F | Stonebridge Financial Group, LLC | 0 | −100,00 | 0 | |||||
| 2025-08-14 | 13F | Marshall Investment Management, Llc | 0 | −100,00 | 0 | |||||
| 2025-04-09 | 13F | West Financial Advisors, LLC | 0 | −100,00 | 0 | |||||
| 2025-07-22 | 13F | Merit Financial Group, LLC | 6 276 | 0,00 | 304 | 13,01 | ||||
| 2025-07-11 | 13F | Farther Finance Advisors, LLC | 624 | 0,00 | 30 | 15,38 | ||||
| 2025-07-14 | 13F | AdvisorNet Financial, Inc | 237 | 0,00 | 11 | 10,00 | ||||
| 2025-08-15 | 13F | Morgan Stanley | 1 109 271 | 1,28 | 53 744 | 14,33 | ||||
| 2025-08-14 | 13F | Wells Fargo & Company/mn | 790 108 | 0,39 | 38 281 | 13,33 | ||||
| 2025-08-14 | 13F | Royal Bank Of Canada | 516 582 | −1,50 | 25 029 | 11,19 | ||||
| 2025-08-13 | 13F | IAG Wealth Partners, LLC | 17 412 | −44,78 | 844 | −37,69 | ||||
| 2025-08-15 | 13F | Tower Research Capital LLC (TRC) | 130 | −99,21 | 6 | −99,15 | ||||
| 2025-08-12 | 13F | Global Retirement Partners, LLC | 43 | −52,75 | 2 | −50,00 | ||||
| 2025-07-17 | 13F | Keystone Global Partners, LLC | 0 | −100,00 | 0 | |||||
| 2025-08-06 | 13F | Ipsen Advisor Group LLC | 4 542 | −4,94 | 220 | 7,32 | ||||
| 2025-07-10 | 13F | SK Wealth Management, LLC | 17 370 | −12,56 | 846 | 8,47 | ||||
| 2025-04-25 | 13F | MidAtlantic Capital Management, Inc. | 0 | −100,00 | 0 | |||||
| 2025-08-11 | 13F | Principal Securities, Inc. | 1 175 | 37,43 | 57 | 40,00 | ||||
| 2025-07-24 | 13F | IFP Advisors, Inc | 0 | −100,00 | 0 | |||||
| 2025-07-22 | 13F | Wealthcare Advisory Partners LLC | 4 348 | 211 | ||||||
| 2025-08-12 | 13F | Jpmorgan Chase & Co | 33 939 | −17,96 | 1 644 | −7,38 | ||||
| 2025-08-08 | 13F | Emerald Investment Partners, Llc | 16 299 | −15,02 | 790 | −4,13 | ||||
| 2025-07-24 | 13F | Blair William & Co/il | 913 | −20,95 | 44 | −10,20 | ||||
| 2025-07-24 | 13F | rebel Financial LLC | 22 010 | 1 066 | ||||||
| 2025-08-13 | 13F | Continuum Advisory, LLC | 9 392 | 0,00 | 455 | 12,90 | ||||
| 2025-08-15 | 13F | Urban Financial Advisory Corp | 562 | 0,00 | 27 | 12,50 | ||||
| 2025-07-28 | 13F | Harbour Investments, Inc. | 1 903 | 0,00 | 92 | 13,58 | ||||
| 2025-05-14 | 13F | Jane Street Group, Llc | 0 | −100,00 | 0 | |||||
| 2025-07-18 | 13F | Institute for Wealth Management, LLC. | 11 951 | 39,88 | 579 | 58,20 | ||||
| 2025-07-22 | 13F | Petros Family Wealth, LLC | 8 056 | 390 |