Grundläggande statistik
| Institutionella ägare | 97 total, 97 long only, 0 short only, 0 long/short - change of 10,23% MRQ |
| Genomsnittlig portföljallokering | 0.2282 % - change of 7,35% MRQ |
| Institutionella aktier (lång) | 3 327 123 (ex 13D/G) - change of 1,00MM shares 43,13% MRQ |
| Institutionellt värde (lång) | $ 150 037 USD ($1000) |
Institutionellt ägande och aktieägare
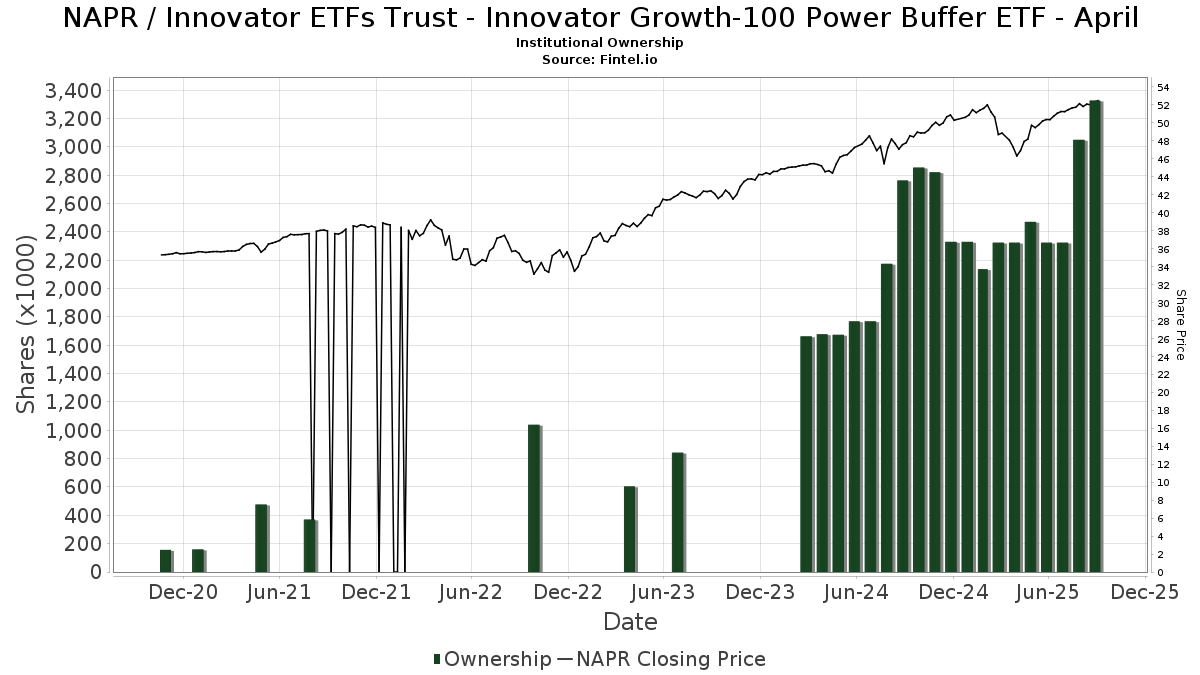
Innovator ETFs Trust - Innovator Growth-100 Power Buffer ETF - April (US:NAPR) har 97 Institutionella ägare och aktieägare som har lämnat in 13D/G- eller 13F-formulär till Securities Exchange Commission (SEC). Dessa institut innehar totalt 3,327,123 aktier. Största aktieägare inkluderar Gradient Investments LLC, Advisor Group Holdings, Inc., Allworth Financial LP, FOCUS Wealth Advisors, LLC, Red Crane Wealth Management, Llc, Commonwealth Equity Services, Llc, MAI Capital Management, Kestra Advisory Services, LLC, Janney Montgomery Scott LLC, and Tradition Wealth Management, LLC .
Innovator ETFs Trust - Innovator Growth-100 Power Buffer ETF - April (BATS:NAPR) Institutionell ägarstruktur visar institutioners och fonders nuvarande positioner i företaget, samt de senaste förändringarna i positionernas storlek. Större aktieägare kan vara enskilda investerare, fonder, hedgefonder eller institutioner. Bilaga 13D visar att investeraren äger (eller ägde) mer än 5% av företaget och avser (eller avsåg) att aktivt eftersträva en förändring av affärsstrategin. Schedule 13G indikerar en passiv investering på över 5%.
The share price as of September 9, 2025 is 52,26 / share. Previously, on September 10, 2024, the share price was 47,00 / share. This represents an increase of 11,19% over that period.
Fondsentimentets poäng
Fondsentimentet poängen(fka Ägarackumulation-poäng) visar vilka aktier som är mest köpta av fonder. Det är resultatet av en sofistikerad kvantitativ flerfaktormodell som identifierar företag med de högsta nivåerna av institutionell ackumulering. Poängsättningsmodellen använder en kombination av den totala ökningen av redovisade ägare, förändringarna i portföljallokeringarna för dessa ägare och andra mått. Siffran sträcker sig från 0 till 100, där högre siffror indikerar en högre nivå av ackumulering i förhållande till sina konkurrenter, och 50 är genomsnittet.
Uppdateringsfrekvens: Dagligen
Se Ownership Explorer, som innehåller en lista över de högst rankade företagen.
Institutionell sälj/köp-kvot
Förutom att rapportera vanliga eget kapital- och skuldemissioner måste institutioner med mer än 100MM tillgångar under förvaltning också avslöja sina innehav av sälj- och köpoptioner. Eftersom säljoptioner i allmänhet indikerar ett negativt sentiment och köpoptioner indikerar ett positivt sentiment, kan vi få en uppfattning om det övergripande institutionella sentimentet genom att plotta förhållandet mellan säljoptioner och köpoptioner. Diagrammet till höger visar det historiska förhållandet mellan sälj- och köpoptioner för detta instrument.
Genom att använda sälj/köp-kvoten som en indikator på aktieägarnas sentiment undviker man en av de största bristerna med att använda det totala institutionella ägandet, nämligen att en betydande del av de förvaltade tillgångarna investeras passivt för att följa index. Passivt förvaltade fonder köper vanligtvis inte optioner, så indikatorn för sälj/köp-kvoten ger en bättre bild av stämningen i aktivt förvaltade fonder.
13F- och NPORT-arkiveringar
Detaljer om 13F-arkiveringar är gratis. Detaljer om NP-arkiveringar kräver ett premiummedlemskap. Gröna rader indikerar nya positioner. Röda rader indikerar stängda positioner. Klicka på länk symbolen för att se hela transaktionshistoriken.
Uppgradera
för att låsa upp premiumdata och exportera till Excel ![]() .
.
| Fil Datum | Källa | Investerare | Typ | Genomsnittligt pris (beräknat) |
Aktier | Δ Aktier (%) |
Rapporterat värde (1000 USD) |
Δ Värde (%) |
Portföljallokering (%) |
|
|---|---|---|---|---|---|---|---|---|---|---|
| 2025-07-22 | 13F | Merit Financial Group, LLC | 9 516 | 485 | ||||||
| 2025-08-28 | NP | TFAQX - TFA Quantitative Fund Class I | 8 500 | 0,00 | 434 | 6,91 | ||||
| 2025-09-04 | 13F/A | Advisor Group Holdings, Inc. | 248 994 | 79,45 | 12 701 | 91,92 | ||||
| 2025-07-25 | 13F | Apollon Wealth Management, LLC | 13 352 | 2,71 | 681 | 9,84 | ||||
| 2025-07-28 | 13F | Harbour Investments, Inc. | 3 999 | 3,79 | 204 | 10,93 | ||||
| 2025-07-21 | 13F | Seros Financial, LLC | 4 463 | −3,54 | 228 | 3,18 | ||||
| 2025-07-30 | 13F | Brookstone Capital Management | 6 189 | −8,18 | 316 | −1,87 | ||||
| 2025-07-08 | 13F | Gradient Investments LLC | 655 603 | 33 442 | ||||||
| 2025-08-14 | 13F | Colony Group, LLC | 5 847 | 298 | ||||||
| 2025-07-30 | 13F | Mid-American Wealth Advisory Group, Inc. | 4 | 0 | ||||||
| 2025-08-15 | 13F | Optimist Retirement Group LLC | 12 280 | 17,22 | 626 | 25,45 | ||||
| 2025-08-14 | 13F | Old Mission Capital Llc | 14 976 | −62,29 | 764 | −59,71 | ||||
| 2025-08-18 | 13F | Wolverine Trading, Llc | 0 | −100,00 | 0 | |||||
| 2025-08-13 | 13F | Maia Wealth LLC | 10 273 | −42,17 | 524 | −37,17 | ||||
| 2025-04-22 | 13F | Synergy Financial Management, LLC | 0 | −100,00 | 0 | |||||
| 2025-08-08 | 13F | Collaborative Wealth Managment Inc. | 8 319 | 56,64 | 424 | 67,59 | ||||
| 2025-07-22 | 13F | Red Tortoise LLC | 793 | 0,00 | 40 | 8,11 | ||||
| 2025-08-07 | 13F | Resources Investment Advisors, LLC. | 4 404 | 225 | ||||||
| 2025-08-04 | 13F | Prairie Wealth Advisors, Inc. | 20 130 | 0,00 | 1 027 | 6,88 | ||||
| 2025-07-25 | 13F | Atria Wealth Solutions, Inc. | 13 368 | 42,21 | 682 | 52,23 | ||||
| 2025-07-29 | 13F | Mattson Financial Services, LLC | 6 214 | 317 | ||||||
| 2025-08-12 | 13F | LPL Financial LLC | 35 154 | 8,85 | 1 793 | 16,43 | ||||
| 2025-07-09 | 13F | FOCUS Wealth Advisors, LLC | 222 136 | 0,26 | 11 331 | 7,22 | ||||
| 2025-08-06 | 13F | Commonwealth Equity Services, Llc | 132 696 | 10,04 | 7 | 20,00 | ||||
| 2025-08-12 | 13F | Steward Partners Investment Advisory, Llc | 6 142 | 0,00 | 313 | 7,19 | ||||
| 2025-08-04 | 13F | Arkadios Wealth Advisors | 17 300 | −2,78 | 882 | 4,01 | ||||
| 2025-08-11 | 13F | HighTower Advisors, LLC | 12 263 | 21,15 | 626 | 29,67 | ||||
| 2025-08-14 | 13F | Jane Street Group, Llc | 7 450 | 380 | ||||||
| 2025-08-12 | 13F | Proequities, Inc. | 0 | 0 | ||||||
| 2025-07-14 | 13F | AdvisorNet Financial, Inc | 23 370 | −1,10 | 1 192 | 5,77 | ||||
| 2025-07-15 | 13F | BCS Wealth Management | 21 170 | −3,75 | 1 | 0,00 | ||||
| 2025-08-11 | 13F | Outlook Wealth Advisors, LLC | 49 200 | −1,41 | 2 510 | 5,42 | ||||
| 2025-08-14 | 13F | CoreCap Advisors, LLC | 6 859 | 7,22 | 350 | 14,43 | ||||
| 2025-08-05 | 13F | Sigma Planning Corp | 4 459 | 0,09 | 227 | 7,08 | ||||
| 2025-07-16 | 13F | Signaturefd, Llc | 1 933 | 0,00 | 99 | 6,52 | ||||
| 2025-07-29 | 13F | AssuredPartners Investment Advisors, LLC | 10 092 | −79,43 | 515 | −78,03 | ||||
| 2025-08-12 | 13F | Jacobi Capital Management LLC | 6 969 | 0,00 | 355 | 6,93 | ||||
| 2025-08-04 | 13F | Creative Financial Designs Inc /adv | 14 570 | 22,75 | 743 | 31,27 | ||||
| 2025-08-12 | 13F | MAI Capital Management | 123 032 | 659,46 | 6 276 | 712,82 | ||||
| 2025-08-07 | 13F | PFG Advisors | 8 063 | −2,25 | 411 | 4,58 | ||||
| 2025-08-06 | 13F | Valtinson Bruner Financial Planning LLC | 10 637 | −13,73 | 543 | −7,82 | ||||
| 2025-05-15 | 13F | Talon Private Wealth, LLC | 0 | −100,00 | 0 | −100,00 | ||||
| 2025-07-16 | 13F | Cambridge Advisors Inc. | 31 824 | 0,00 | 1 623 | 6,92 | ||||
| 2025-08-08 | 13F | Avantax Advisory Services, Inc. | 7 248 | 44,96 | 370 | 55,04 | ||||
| 2025-07-25 | 13F | Concurrent Investment Advisors, LLC | 8 921 | 0,00 | 455 | 7,06 | ||||
| 2025-05-06 | 13F | Arlington Capital Management, Inc. | 0 | −100,00 | 0 | |||||
| 2025-08-08 | 13F | Cetera Investment Advisers | 83 790 | 30,38 | 4 274 | 39,45 | ||||
| 2025-08-11 | 13F | Atlantic Private Wealth, LLC | 0 | −100,00 | 0 | |||||
| 2025-07-30 | 13F | Strategic Blueprint, LLC | 51 339 | 2,70 | 2 619 | 9,82 | ||||
| 2025-08-14 | 13F | UBS Group AG | 0 | −100,00 | 0 | |||||
| 2025-07-09 | 13F | Keystone Wealth Services, LLC | 26 819 | 197,36 | 1 368 | 218,14 | ||||
| 2025-08-01 | 13F | Envestnet Asset Management Inc | 15 951 | 19,21 | 814 | 27,43 | ||||
| 2025-08-14 | 13F | Mml Investors Services, Llc | 7 339 | 0 | ||||||
| 2025-07-21 | 13F | DHJJ Financial Advisors, Ltd. | 14 894 | 21,16 | 760 | 29,52 | ||||
| 2025-08-12 | 13F | Coldstream Capital Management Inc | 0 | −100,00 | 0 | |||||
| 2025-07-30 | 13F | Red Crane Wealth Management, Llc | 133 470 | 25,13 | 6 808 | 33,83 | ||||
| 2025-08-15 | 13F | Brown Financial Advisors | 7 441 | 380 | ||||||
| 2025-08-14 | 13F | Susquehanna International Group, Llp | 10 450 | 533 | ||||||
| 2025-05-14 | 13F | Luminist Capital LLC | 0 | −100,00 | 0 | |||||
| 2025-08-12 | 13F | Jpmorgan Chase & Co | 0 | −100,00 | 0 | |||||
| 2025-07-24 | 13F | IFP Advisors, Inc | 13 356 | 36,12 | 681 | 45,51 | ||||
| 2025-04-29 | 13F | Capital Investment Advisory Services, LLC | 0 | −100,00 | 0 | |||||
| 2025-08-15 | 13F | Kestra Advisory Services, LLC | 105 106 | 105,18 | 5 361 | 119,44 | ||||
| 2025-08-29 | 13F | Evolution Wealth Management Inc. | 1 441 | 74 | ||||||
| 2025-07-17 | 13F | Janney Montgomery Scott LLC | 101 923 | 12,11 | 5 | 25,00 | ||||
| 2025-07-18 | 13F | Truist Financial Corp | 40 165 | 15,69 | 2 049 | 23,67 | ||||
| 2025-05-07 | 13F | Foundations Investment Advisors, LLC | 0 | −100,00 | 0 | −100,00 | ||||
| 2025-05-12 | 13F | Fmr Llc | 0 | −100,00 | 0 | |||||
| 2025-08-14 | 13F | Citadel Advisors Llc | 0 | −100,00 | 0 | |||||
| 2025-08-28 | NP | TFAFX - Tactical Growth Allocation Fund Class I | 4 200 | 10,53 | 214 | 18,23 | ||||
| 2025-08-06 | 13F | Wedbush Securities Inc | 5 771 | 0 | ||||||
| 2025-05-05 | 13F | Arq Wealth Advisors, Llc | 0 | −100,00 | 0 | |||||
| 2025-07-22 | 13F | Diligent Investors, LLC | 21 417 | −7,21 | 1 092 | −0,73 | ||||
| 2025-07-10 | 13F | Wealth Enhancement Advisory Services, Llc | 4 197 | −28,20 | 215 | −23,02 | ||||
| 2025-07-25 | 13F | Cwm, Llc | 22 987 | 2,09 | 1 | 0,00 | ||||
| 2025-08-14 | 13F | Visionary Wealth Advisors | 9 104 | 47,19 | 464 | 57,29 | ||||
| 2025-08-15 | 13F | Morgan Stanley | 1 322 | 3 124,39 | 67 | 6 600,00 | ||||
| 2025-08-04 | 13F | Daymark Wealth Partners, Llc | 4 889 | 0,00 | 249 | 6,87 | ||||
| 2025-08-04 | 13F | Assetmark, Inc | 0 | −100,00 | 0 | |||||
| 2025-08-08 | 13F | Compass Financial Services Inc | 125 | 0,00 | 6 | 20,00 | ||||
| 2025-08-06 | 13F | Soltis Investment Advisors LLC | 4 153 | 212 | ||||||
| 2025-08-29 | 13F | Centaurus Financial, Inc. | 5 394 | −63,92 | 0 | |||||
| 2025-07-25 | 13F | Sequoia Financial Advisors, LLC | 9 109 | 0,00 | 465 | 6,91 | ||||
| 2025-08-13 | 13F | JT Stratford LLC | 8 190 | 0,00 | 418 | 6,92 | ||||
| 2025-07-10 | 13F | Focus Financial Network, Inc. | 9 140 | 6,89 | 466 | 14,50 | ||||
| 2025-07-08 | 13F | Paladin Wealth, LLC | 6 057 | 309 | ||||||
| 2025-08-06 | 13F | AE Wealth Management LLC | 6 287 | 2,75 | 321 | 9,97 | ||||
| 2025-08-14 | 13F | Wells Fargo & Company/mn | 0 | −100,00 | 0 | |||||
| 2025-05-06 | 13F | Triumph Capital Management | 0 | −100,00 | 0 | |||||
| 2025-08-01 | 13F | Corrado Advisors, Llc | 26 049 | 1 329 | ||||||
| 2025-08-14 | 13F | GWM Advisors LLC | 11 038 | 0,00 | 563 | 7,03 | ||||
| 2025-08-07 | 13F | Allworth Financial LP | 227 581 | 7,96 | 11 609 | 15,96 | ||||
| 2025-07-14 | 13F | U.S. Capital Wealth Advisors, LLC | 4 414 | 4,85 | 225 | 12,50 | ||||
| 2025-07-22 | 13F | Beacon Financial Advisory LLC | 9 660 | 493 | ||||||
| 2025-07-24 | 13F | Blair William & Co/il | 36 140 | −20,71 | 1 844 | −15,23 | ||||
| 2025-08-13 | 13F | BCJ Capital Management, LLC | 4 479 | −1,10 | 228 | 5,56 | ||||
| 2025-08-01 | 13F | FSA Advisors, Inc. | 15 379 | 12,35 | 784 | 6,81 | ||||
| 2025-08-12 | 13F | Change Path, LLC | 30 801 | 1,88 | 1 571 | 8,95 | ||||
| 2025-05-07 | 13F | First Heartland Consultants, Inc. | 0 | −100,00 | 0 | −100,00 | ||||
| 2025-08-11 | 13F | Blue Bell Private Wealth Management, Llc | 209 | 0,00 | 11 | 11,11 | ||||
| 2025-08-14 | 13F | Certified Advisory Corp | 7 149 | 365 | ||||||
| 2025-08-13 | 13F | M Holdings Securities, Inc. | 21 074 | 0,00 | 1 | 0,00 | ||||
| 2025-08-14 | 13F | Raymond James Financial Inc | 46 912 | 8,10 | 2 393 | 15,61 | ||||
| 2025-08-15 | 13F | Nikulski Financial, Inc. | 5 100 | 0,00 | 260 | 7,00 | ||||
| 2025-08-14 | 13F | Acas, Llc | 9 045 | 66,12 | 471 | 79,77 | ||||
| 2025-07-29 | 13F | Stratos Wealth Advisors, LLC | 8 764 | 0,00 | 447 | 6,94 | ||||
| 2025-08-14 | 13F | Sunbelt Securities, Inc. | 7 673 | 3,37 | 387 | 9,04 | ||||
| 2025-07-31 | 13F | Cambridge Investment Research Advisors, Inc. | 61 620 | −2,75 | 3 | 0,00 | ||||
| 2025-08-01 | 13F | Gwn Securities Inc. | 27 866 | 23,24 | 1 421 | 31,82 | ||||
| 2025-08-19 | 13F | National Asset Management, Inc. | 0 | −100,00 | 0 | |||||
| 2025-07-24 | 13F | Stonebridge Financial Group, LLC | 0 | −100,00 | 0 | |||||
| 2025-07-30 | 13F | Phoenix Holdings Ltd. | 17 495 | 887 | ||||||
| 2025-08-11 | 13F | Principal Securities, Inc. | 73 792 | −29,80 | 3 764 | −28,94 | ||||
| 2025-08-14 | 13F | Hrt Financial Lp | 5 483 | 0 | ||||||
| 2025-04-18 | 13F | Global Trust Asset Management, LLC | 0 | −100,00 | 0 | |||||
| 2025-08-14 | 13F | Goldman Sachs Group Inc | 0 | −100,00 | 0 | |||||
| 2025-08-12 | 13F | Tradition Wealth Management, LLC | 99 949 | 2,47 | 5 098 | 9,59 | ||||
| 2025-07-14 | 13F | CRA Financial Services, LLC | 10 919 | −10,35 | 557 | −4,14 | ||||
| 2025-07-16 | 13F | PFS Partners, LLC | 759 | 39 | ||||||
| 2025-08-19 | 13F | Advisory Services Network, LLC | 13 235 | 3,12 | 683 | 11,44 |