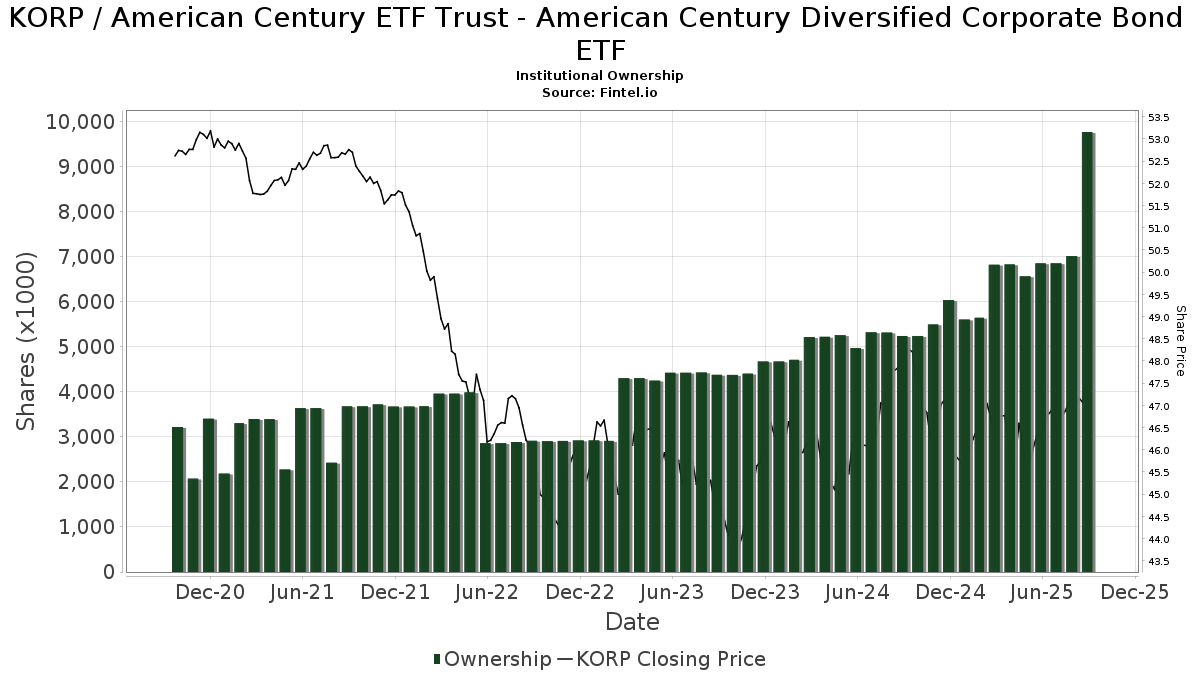
Grundläggande statistik
| Institutionella ägare | 71 total, 71 long only, 0 short only, 0 long/short - change of 16,39% MRQ |
| Genomsnittlig portföljallokering | 0.7209 % - change of 56,53% MRQ |
| Institutionella aktier (lång) | 9 765 767 (ex 13D/G) - change of 2,91MM shares 42,54% MRQ |
| Institutionellt värde (lång) | $ 456 863 USD ($1000) |
Institutionellt ägande och aktieägare
American Century ETF Trust - American Century Diversified Corporate Bond ETF (US:KORP) har 71 Institutionella ägare och aktieägare som har lämnat in 13D/G- eller 13F-formulär till Securities Exchange Commission (SEC). Dessa institut innehar totalt 9,765,767 aktier. Största aktieägare inkluderar Envestnet Asset Management Inc, Morgan Stanley, American Century Companies Inc, Gallagher Fiduciary Advisors, LLC, Atria Investments Llc, TWSMX - Strategic Allocation: Moderate Fund Investor Class, Comprehensive Wealth Management, LLC, LPL Financial LLC, AACRX - Strategic Allocation: Conservative Fund R Class, and Core Wealth Advisors, Inc. .
American Century ETF Trust - American Century Diversified Corporate Bond ETF (ARCA:KORP) Institutionell ägarstruktur visar institutioners och fonders nuvarande positioner i företaget, samt de senaste förändringarna i positionernas storlek. Större aktieägare kan vara enskilda investerare, fonder, hedgefonder eller institutioner. Bilaga 13D visar att investeraren äger (eller ägde) mer än 5% av företaget och avser (eller avsåg) att aktivt eftersträva en förändring av affärsstrategin. Schedule 13G indikerar en passiv investering på över 5%.
The share price as of September 12, 2025 is 47,85 / share. Previously, on September 16, 2024, the share price was 48,46 / share. This represents a decline of 1,26% over that period.
Fondsentimentets poäng
Fondsentimentet poängen(fka Ägarackumulation-poäng) visar vilka aktier som är mest köpta av fonder. Det är resultatet av en sofistikerad kvantitativ flerfaktormodell som identifierar företag med de högsta nivåerna av institutionell ackumulering. Poängsättningsmodellen använder en kombination av den totala ökningen av redovisade ägare, förändringarna i portföljallokeringarna för dessa ägare och andra mått. Siffran sträcker sig från 0 till 100, där högre siffror indikerar en högre nivå av ackumulering i förhållande till sina konkurrenter, och 50 är genomsnittet.
Uppdateringsfrekvens: Dagligen
Se Ownership Explorer, som innehåller en lista över de högst rankade företagen.
Institutionell sälj/köp-kvot
Förutom att rapportera vanliga eget kapital- och skuldemissioner måste institutioner med mer än 100MM tillgångar under förvaltning också avslöja sina innehav av sälj- och köpoptioner. Eftersom säljoptioner i allmänhet indikerar ett negativt sentiment och köpoptioner indikerar ett positivt sentiment, kan vi få en uppfattning om det övergripande institutionella sentimentet genom att plotta förhållandet mellan säljoptioner och köpoptioner. Diagrammet till höger visar det historiska förhållandet mellan sälj- och köpoptioner för detta instrument.
Genom att använda sälj/köp-kvoten som en indikator på aktieägarnas sentiment undviker man en av de största bristerna med att använda det totala institutionella ägandet, nämligen att en betydande del av de förvaltade tillgångarna investeras passivt för att följa index. Passivt förvaltade fonder köper vanligtvis inte optioner, så indikatorn för sälj/köp-kvoten ger en bättre bild av stämningen i aktivt förvaltade fonder.
13F- och NPORT-arkiveringar
Detaljer om 13F-arkiveringar är gratis. Detaljer om NP-arkiveringar kräver ett premiummedlemskap. Gröna rader indikerar nya positioner. Röda rader indikerar stängda positioner. Klicka på länk symbolen för att se hela transaktionshistoriken.
Uppgradera
för att låsa upp premiumdata och exportera till Excel ![]() .
.
| Fil Datum | Källa | Investerare | Typ | Genomsnittligt pris (beräknat) |
Aktier | Δ Aktier (%) |
Rapporterat värde (1000 USD) |
Δ Värde (%) |
Portföljallokering (%) |
|
|---|---|---|---|---|---|---|---|---|---|---|
| 2025-08-14 | 13F | Jane Street Group, Llc | 0 | −100,00 | 0 | |||||
| 2025-07-31 | 13F | Cambridge Investment Research Advisors, Inc. | 10 093 | −1,29 | 0 | |||||
| 2025-08-06 | 13F | AE Wealth Management LLC | 10 547 | 36,83 | 496 | 37,78 | ||||
| 2025-08-08 | 13F | Flaharty Asset Management, LLC | 0 | −100,00 | 0 | |||||
| 2025-08-14 | 13F | Gallagher Fiduciary Advisors, LLC | 962 573 | 45 308 | ||||||
| 2025-08-14 | 13F | Bank Of America Corp /de/ | 316 | 7,85 | 15 | 7,69 | ||||
| 2025-08-14 | 13F | IHT Wealth Management, LLC | 5 280 | −4,16 | 249 | −3,50 | ||||
| 2025-08-12 | 13F | Park Square Financial Group, LLC | 3 147 | 521,94 | 148 | 543,48 | ||||
| 2025-08-18 | 13F | Geneos Wealth Management Inc. | 250 | 0,00 | 12 | 0,00 | ||||
| 2025-08-12 | 13F | LPL Financial LLC | 477 815 | 6,21 | 22 491 | 6,96 | ||||
| 2025-08-11 | 13F | Principal Securities, Inc. | 611 | −2,86 | 29 | 0,00 | ||||
| 2025-08-11 | 13F | Private Advisor Group, LLC | 57 052 | 29,77 | 2 685 | 30,72 | ||||
| 2025-05-05 | 13F | PCG Wealth Advisors, LLC | 0 | −100,00 | 0 | |||||
| 2025-08-11 | 13F | Tidemark, LLC | 0 | −100,00 | 0 | |||||
| 2025-08-15 | 13F | Morgan Stanley | 1 226 055 | 3,06 | 57 710 | 3,79 | ||||
| 2025-07-17 | 13F | Fifth Third Securities, Inc. | 74 551 | 0,11 | 3 509 | 0,83 | ||||
| 2025-08-18 | 13F | Arq Wealth Advisors, Llc | 210 116 | 9 821 | ||||||
| 2025-07-23 | 13F | Morey & Quinn Wealth Partners, LLC | 5 482 | 258 | ||||||
| 2025-08-14 | 13F | GWM Advisors LLC | 207 | 0,00 | 10 | 0,00 | ||||
| 2025-08-04 | 13F | Creative Financial Designs Inc /adv | 521 | 1,17 | 25 | 0,00 | ||||
| 2025-08-06 | 13F | Golden State Wealth Management, LLC | 22 741 | 1 070 | ||||||
| 2025-07-25 | 13F | Atria Wealth Solutions, Inc. | 4 798 | 226 | ||||||
| 2025-08-12 | 13F | J.w. Cole Advisors, Inc. | 164 187 | 7 728 | ||||||
| 2025-08-14 | 13F | Susquehanna International Group, Llp | 12 775 | 601 | ||||||
| 2025-08-13 | 13F | Jones Financial Companies Lllp | 1 614 | 67,78 | 76 | 70,45 | ||||
| 2025-08-15 | 13F | Kestra Advisory Services, LLC | 153 756 | 16,90 | 7 237 | 17,73 | ||||
| 2025-08-14 | 13F | Mml Investors Services, Llc | 5 501 | −7,99 | 0 | |||||
| 2025-08-14 | 13F | Atomi Financial Group, Inc. | 6 273 | 295 | ||||||
| 2025-08-19 | 13F | Cape Investment Advisory, Inc. | 300 | 0,00 | 14 | 0,00 | ||||
| 2025-08-14 | 13F | Sunbelt Securities, Inc. | 13 | 0,00 | 1 | |||||
| 2025-09-04 | 13F/A | Advisor Group Holdings, Inc. | 88 008 | 52,50 | 4 143 | 53,58 | ||||
| 2025-07-28 | 13F | Harbour Investments, Inc. | 4 192 | 202,24 | 197 | 207,81 | ||||
| 2025-08-12 | 13F | Proequities, Inc. | 0 | 0 | ||||||
| 2025-05-12 | 13F | Fmr Llc | 0 | −100,00 | 0 | |||||
| 2025-07-29 | 13F | Ballast, Inc. | 15 822 | 745 | ||||||
| 2025-04-17 | 13F | Sound Income Strategies, LLC | 0 | −100,00 | 0 | |||||
| 2025-08-12 | 13F | Jpmorgan Chase & Co | 56 706 | 2 669 | ||||||
| 2025-08-14 | 13F | Raymond James Financial Inc | 85 625 | 2,86 | 4 030 | 3,60 | ||||
| 2025-08-14 | 13F | Ameriprise Financial Inc | 8 276 | −11,53 | 390 | −10,98 | ||||
| 2025-08-08 | 13F | Avantax Advisory Services, Inc. | 15 528 | −7,71 | 731 | −7,12 | ||||
| 2025-08-05 | 13F | GPS Wealth Strategies Group, LLC | 322 | 0,00 | 15 | 0,00 | ||||
| 2025-08-14 | 13F | Royal Bank Of Canada | 154 777 | 3,60 | 7 285 | 4,32 | ||||
| 2025-05-15 | 13F | Citadel Advisors Llc | 0 | −100,00 | 0 | |||||
| 2025-08-06 | 13F | Commonwealth Equity Services, Llc | 32 741 | 47,68 | 2 | 0,00 | ||||
| 2025-08-08 | 13F | Larson Financial Group LLC | 7 871 | −10,75 | 370 | −10,19 | ||||
| 2025-08-14 | 13F | Comerica Bank | 0 | −100,00 | 0 | |||||
| 2025-07-30 | 13F | D.a. Davidson & Co. | 84 448 | 1,33 | 3 975 | 2,03 | ||||
| 2025-08-05 | 13F | Westside Investment Management, Inc. | 620 | 0,00 | 29 | 3,57 | ||||
| 2025-08-14 | 13F | Wells Fargo & Company/mn | 248 191 | 12,70 | 11 682 | 13,49 | ||||
| 2025-08-12 | 13F | Leigh Baldwin & Co., Llc | 22 555 | 42,62 | 1 062 | 43,57 | ||||
| 2025-08-12 | 13F | Calton & Associates, Inc. | 19 805 | 1,90 | 932 | 2,64 | ||||
| 2025-05-12 | 13F | Aveo Capital Partners, LLC | 0 | −100,00 | 0 | |||||
| 2025-08-13 | 13F | Capital Analysts, Inc. | 2 197 | 0,64 | 0 | |||||
| 2025-08-14 | 13F | Core Wealth Advisors, Inc. | 321 271 | 0,79 | 15 122 | 1,51 | ||||
| 2025-08-14 | 13F | Mariner, LLC | 8 019 | 377 | ||||||
| 2025-08-05 | 13F | Tme Financial, Inc. | 40 239 | 42,28 | 1 894 | 43,38 | ||||
| 2025-08-04 | 13F | Atria Investments Llc | 958 522 | 45 118 | ||||||
| 2025-06-27 | NP | AAARX - Strategic Allocation: Aggressive Fund R Class This fund is a listed as child fund of American Century Companies Inc and if that institution has disclosed ownership in this security, then these positions will not be double counted when calculating total shares and total value | 288 278 | 0,00 | 13 432 | 0,66 | ||||
| 2025-07-07 | 13F | Nova Wealth Management, Inc. | 750 | 35 | ||||||
| 2025-08-11 | 13F | Aptus Capital Advisors, LLC | 382 | 0,00 | 18 | 0,00 | ||||
| 2025-07-24 | 13F | Lindenwold Advisors | 131 447 | 12,78 | 6 187 | 13,59 | ||||
| 2025-08-12 | 13F | Global Retirement Partners, LLC | 610 | 0,00 | 29 | 0,00 | ||||
| 2025-08-01 | 13F | Envestnet Asset Management Inc | 1 492 628 | 12,73 | 70 258 | 13,52 | ||||
| 2025-08-08 | 13F | Pnc Financial Services Group, Inc. | 319 044 | 47,64 | 15 017 | 48,68 | ||||
| 2025-08-07 | 13F | Resources Investment Advisors, LLC. | 11 850 | 558 | ||||||
| 2025-07-10 | 13F | Wealth Enhancement Advisory Services, Llc | 100 360 | −10,83 | 4 694 | −10,78 | ||||
| 2025-07-22 | 13F | Partners Wealth Management, Llc | 21 180 | 0,00 | 988 | −0,10 | ||||
| 2025-08-12 | 13F | American Century Companies Inc | 1 222 328 | −0,00 | 57 535 | 0,71 | ||||
| 2025-08-14 | 13F | UBS Group AG | 153 391 | 195,77 | 7 220 | 197,85 | ||||
| 2025-08-04 | 13F | Joseph P. Lucia & Associates, LLC | 15 822 | 115,76 | 745 | 117,54 | ||||
| 2025-08-11 | 13F | Comprehensive Wealth Management, LLC | 522 960 | 24 616 | ||||||
| 2025-07-25 | 13F | Investment Advisory Group, LLC | 6 200 | −7,46 | 292 | −7,03 | ||||
| 2025-08-08 | 13F | Fortis Group Advisors, LLC | 31 305 | 66,50 | 1 467 | 66,97 | ||||
| 2025-07-22 | 13F | Merit Financial Group, LLC | 71 072 | −36,48 | 3 345 | −36,03 | ||||
| 2025-08-14 | 13F | Camarda Financial Advisors, LLC | 21 053 | 3,09 | 991 | 3,77 | ||||
| 2025-08-11 | 13F | Independent Advisor Alliance | 16 051 | 36,57 | 756 | 37,52 | ||||
| 2025-06-27 | NP | TWSMX - Strategic Allocation: Moderate Fund Investor Class This fund is a listed as child fund of American Century Companies Inc and if that institution has disclosed ownership in this security, then these positions will not be double counted when calculating total shares and total value | 609 783 | 0,00 | 28 413 | 0,66 | ||||
| 2025-06-27 | NP | AACRX - Strategic Allocation: Conservative Fund R Class This fund is a listed as child fund of American Century Companies Inc and if that institution has disclosed ownership in this security, then these positions will not be double counted when calculating total shares and total value | 324 082 | 0,00 | 15 101 | 0,66 | ||||
| 2025-08-08 | 13F | Thoroughbred Financial Services, Llc | 6 083 | 0,00 | 0 | |||||
| 2025-08-08 | 13F | Cooper Capital Advisors LLC | 9 410 | 0,00 | 443 | 0,68 | ||||
| 2025-07-14 | 13F | Southland Equity Partners LLC | 19 532 | 0,77 | 919 | 1,55 |