Grundläggande statistik
| Institutionella ägare | 73 total, 72 long only, 0 short only, 1 long/short - change of −18,89% MRQ |
| Genomsnittlig portföljallokering | 0.1419 % - change of −51,66% MRQ |
| Institutionella aktier (lång) | 6 594 872 (ex 13D/G) - change of −9,66MM shares −59,44% MRQ |
| Institutionellt värde (lång) | $ 123 491 USD ($1000) |
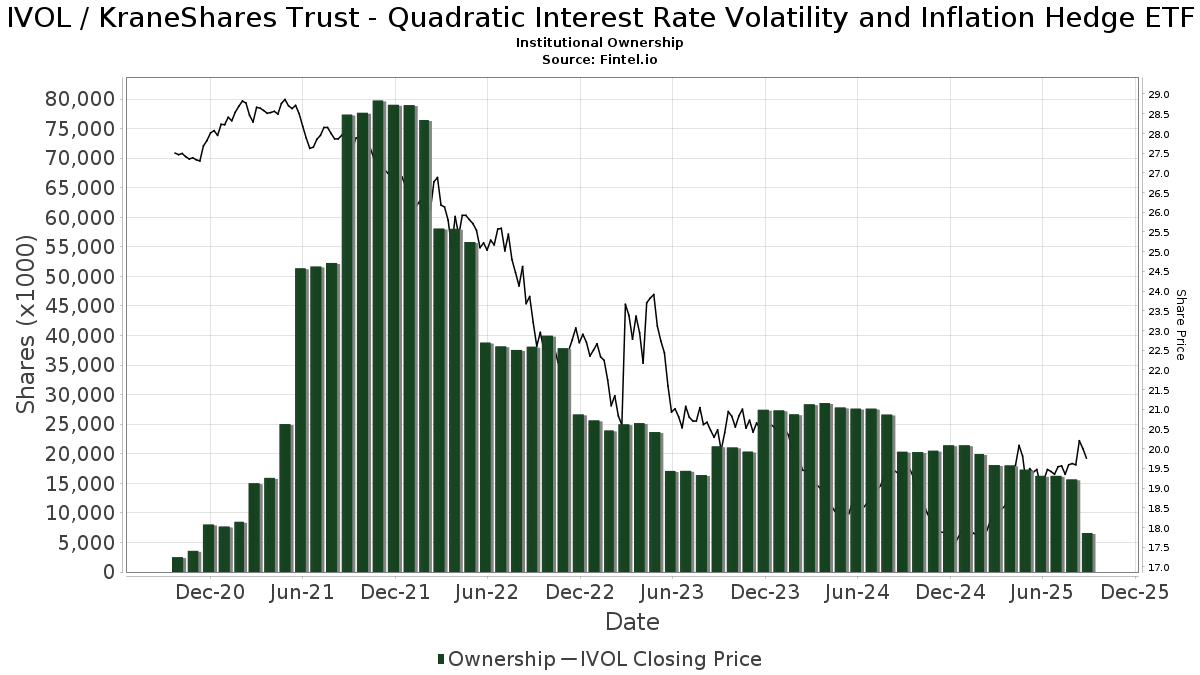
Institutionellt ägande och aktieägare
KraneShares Trust - Quadratic Interest Rate Volatility and Inflation Hedge ETF (US:IVOL) har 73 Institutionella ägare och aktieägare som har lämnat in 13D/G- eller 13F-formulär till Securities Exchange Commission (SEC). Dessa institut innehar totalt 6,594,872 aktier. Största aktieägare inkluderar Raymond James Financial Inc, Wealth Enhancement Advisory Services, Llc, Ambassador Advisors, LLC, CacheTech Inc., Adams Wealth Management, Wells Fargo & Company/mn, Morgan Stanley, Regal Investment Advisors LLC, Royal Bank Of Canada, and BCS Private Wealth Management, Inc. .
KraneShares Trust - Quadratic Interest Rate Volatility and Inflation Hedge ETF (ARCA:IVOL) Institutionell ägarstruktur visar institutioners och fonders nuvarande positioner i företaget, samt de senaste förändringarna i positionernas storlek. Större aktieägare kan vara enskilda investerare, fonder, hedgefonder eller institutioner. Bilaga 13D visar att investeraren äger (eller ägde) mer än 5% av företaget och avser (eller avsåg) att aktivt eftersträva en förändring av affärsstrategin. Schedule 13G indikerar en passiv investering på över 5%.
The share price as of September 10, 2025 is 19,76 / share. Previously, on September 11, 2024, the share price was 19,48 / share. This represents an increase of 1,44% over that period.
Fondsentimentets poäng
Fondsentimentet poängen(fka Ägarackumulation-poäng) visar vilka aktier som är mest köpta av fonder. Det är resultatet av en sofistikerad kvantitativ flerfaktormodell som identifierar företag med de högsta nivåerna av institutionell ackumulering. Poängsättningsmodellen använder en kombination av den totala ökningen av redovisade ägare, förändringarna i portföljallokeringarna för dessa ägare och andra mått. Siffran sträcker sig från 0 till 100, där högre siffror indikerar en högre nivå av ackumulering i förhållande till sina konkurrenter, och 50 är genomsnittet.
Uppdateringsfrekvens: Dagligen
Se Ownership Explorer, som innehåller en lista över de högst rankade företagen.
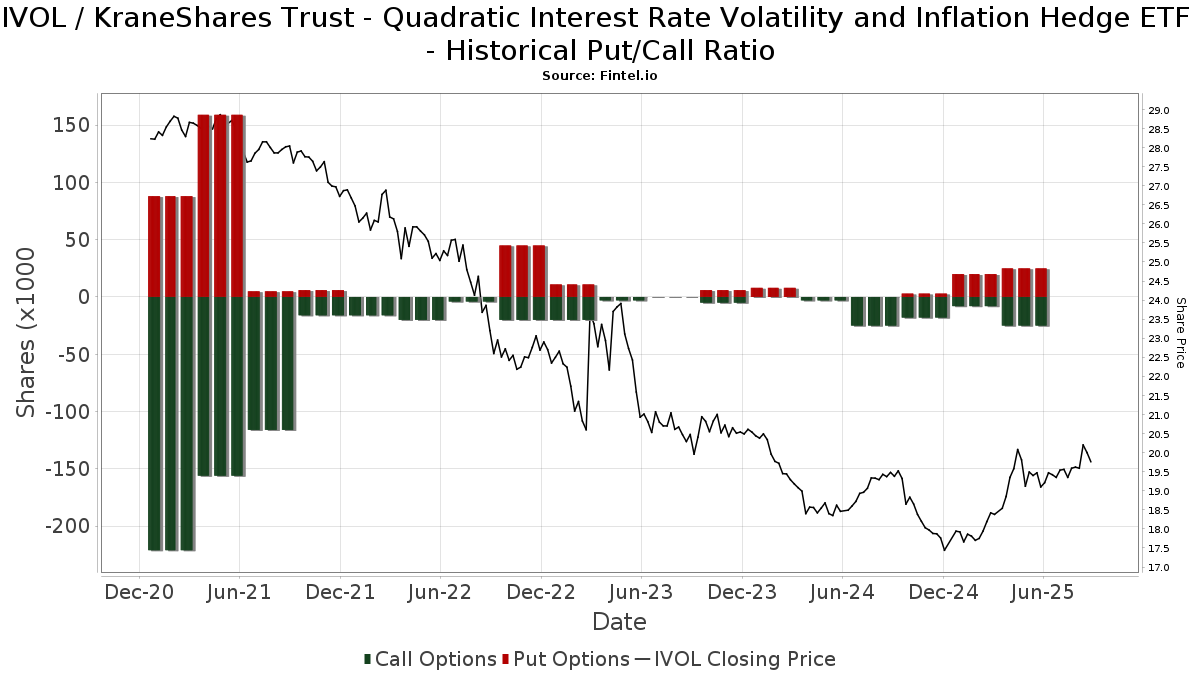
Institutionell sälj/köp-kvot
Förutom att rapportera vanliga eget kapital- och skuldemissioner måste institutioner med mer än 100MM tillgångar under förvaltning också avslöja sina innehav av sälj- och köpoptioner. Eftersom säljoptioner i allmänhet indikerar ett negativt sentiment och köpoptioner indikerar ett positivt sentiment, kan vi få en uppfattning om det övergripande institutionella sentimentet genom att plotta förhållandet mellan säljoptioner och köpoptioner. Diagrammet till höger visar det historiska förhållandet mellan sälj- och köpoptioner för detta instrument.
Genom att använda sälj/köp-kvoten som en indikator på aktieägarnas sentiment undviker man en av de största bristerna med att använda det totala institutionella ägandet, nämligen att en betydande del av de förvaltade tillgångarna investeras passivt för att följa index. Passivt förvaltade fonder köper vanligtvis inte optioner, så indikatorn för sälj/köp-kvoten ger en bättre bild av stämningen i aktivt förvaltade fonder.
13F- och NPORT-arkiveringar
Detaljer om 13F-arkiveringar är gratis. Detaljer om NP-arkiveringar kräver ett premiummedlemskap. Gröna rader indikerar nya positioner. Röda rader indikerar stängda positioner. Klicka på länk symbolen för att se hela transaktionshistoriken.
Uppgradera
för att låsa upp premiumdata och exportera till Excel ![]() .
.
| Fil Datum | Källa | Investerare | Typ | Genomsnittligt pris (beräknat) |
Aktier | Δ Aktier (%) |
Rapporterat värde (1000 USD) |
Δ Värde (%) |
Portföljallokering (%) |
|
|---|---|---|---|---|---|---|---|---|---|---|
| 2025-08-14 | 13F | Hilltop Holdings Inc. | 21 778 | −27,40 | 426 | −24,11 | ||||
| 2025-05-09 | 13F | Cary Street Partners Financial Llc | 0 | −100,00 | 0 | |||||
| 2025-07-24 | 13F | Ronald Blue Trust, Inc. | 0 | −100,00 | 0 | |||||
| 2025-08-06 | 13F | Richard Bernstein Advisors LLC | 406 | −99,99 | 8 | −99,99 | ||||
| 2025-07-23 | 13F | Mraz, Amerine & Associates, Inc. | 30 989 | −8,35 | 606 | −4,11 | ||||
| 2025-08-14 | 13F | Mml Investors Services, Llc | 0 | −100,00 | 0 | |||||
| 2025-08-13 | 13F | Financial Freedom, LLC | 0 | −100,00 | 0 | |||||
| 2025-08-06 | 13F | Commonwealth Equity Services, Llc | 32 352 | 28,69 | 1 | |||||
| 2025-08-11 | 13F | Regal Investment Advisors LLC | 277 662 | 1,66 | 5 431 | 6,45 | ||||
| 2025-08-14 | 13F | Royal Bank Of Canada | 243 738 | −40,78 | 4 758 | −38,10 | ||||
| 2025-07-29 | 13F | Chicago Partners Investment Group LLC | 97 624 | 0,00 | 1 910 | −1,24 | ||||
| 2025-08-14 | 13F | Coastal Bridge Advisors, LLC | 0 | −100,00 | 0 | −100,00 | ||||
| 2025-08-14 | 13F | Balyasny Asset Management Llc | 0 | −100,00 | 0 | |||||
| 2025-08-01 | 13F | Transcend Wealth Collective, Llc | 0 | −100,00 | 0 | |||||
| 2025-08-04 | 13F | Bay Colony Advisory Group, Inc d/b/a Bay Colony Advisors | 44 006 | 0,07 | 861 | 4,62 | ||||
| 2025-08-14 | 13F | Raymond James Financial Inc | 781 437 | −1,63 | 15 285 | 3,00 | ||||
| 2025-05-09 | 13F | Pnc Financial Services Group, Inc. | 0 | −100,00 | 0 | |||||
| 2025-08-15 | 13F | CI Private Wealth, LLC | 0 | −100,00 | 0 | |||||
| 2025-04-28 | 13F | Capital Investment Counsel, Inc | 0 | −100,00 | 0 | −100,00 | ||||
| 2025-08-05 | 13F | EPG Wealth Management LLC | 8 263 | 0,81 | 162 | 5,23 | ||||
| 2025-07-24 | 13F | IFP Advisors, Inc | 20 655 | −70,68 | 404 | −69,30 | ||||
| 2025-07-17 | 13F | Janney Montgomery Scott LLC | 0 | −100,00 | 0 | |||||
| 2025-04-25 | 13F | Stonebridge Financial Group, LLC | 0 | −100,00 | 0 | |||||
| 2025-08-12 | 13F | Steward Partners Investment Advisory, Llc | 13 736 | 0,01 | 269 | 4,69 | ||||
| 2025-08-12 | 13F | TCTC Holdings, LLC | 1 624 | 0,00 | 32 | 3,33 | ||||
| 2025-08-01 | 13F | Brookwood Investment Group LLC | 157 186 | 3 075 | ||||||
| 2025-08-13 | 13F | Scotia Capital Inc. | 0 | −100,00 | 0 | |||||
| 2025-08-14 | 13F | Bank Of America Corp /de/ | 488 | −99,99 | 10 | −99,99 | ||||
| 2025-05-08 | 13F | SlateStone Wealth, LLC | 0 | −100,00 | 0 | |||||
| 2025-07-31 | 13F | Opes Wealth Management LLC | 161 225 | −5,16 | 3 154 | −0,69 | ||||
| 2025-05-16 | 13F | Coppell Advisory Solutions LLC | 0 | −100,00 | 0 | |||||
| 2025-07-24 | 13F | Blair William & Co/il | 3 490 | −14,65 | 68 | −10,53 | ||||
| 2025-07-16 | 13F | Magnus Financial Group LLC | 19 657 | 0,07 | 384 | 4,92 | ||||
| 2025-08-08 | 13F | Islay Capital Management, Llc | 2 400 | 0,00 | 47 | 4,55 | ||||
| 2025-05-14 | 13F | Jane Street Group, Llc | 0 | −100,00 | 0 | |||||
| 2025-08-08 | 13F | Larson Financial Group LLC | 1 293 | 0,94 | 25 | 8,70 | ||||
| 2025-08-01 | 13F | Envestnet Asset Management Inc | 0 | −100,00 | 0 | |||||
| 2025-05-20 | 13F | Belpointe Asset Management LLC | 0 | −100,00 | 0 | |||||
| 2025-08-14 | 13F | UBS Group AG | 30 388 | 594 | ||||||
| 2025-05-15 | 13F | Two Sigma Securities, Llc | 0 | −100,00 | 0 | |||||
| 2025-05-13 | 13F | CacheTech Inc. | 504 723 | −6,70 | 9 428 | −1,76 | ||||
| 2025-08-01 | 13F | Boyd Watterson Asset Management Llc/oh | 919 | 18 | ||||||
| 2025-08-13 | 13F | Bare Financial Services, Inc | 0 | −100,00 | 0 | |||||
| 2025-05-13 | 13F | Adams Wealth Management | 504 723 | −6,70 | 9 428 | −1,76 | ||||
| 2025-08-14 | 13F | Citadel Advisors Llc | Call | 25 400 | 202,38 | 497 | 217,95 | |||
| 2025-04-14 | 13F | LexAurum Advisors, LLC | 0 | −100,00 | 0 | −100,00 | ||||
| 2025-08-14 | 13F | Citadel Advisors Llc | 52 179 | 21,12 | 1 021 | 26,87 | ||||
| 2025-07-24 | 13F | Us Bancorp \de\ | 60 912 | 23,85 | 1 191 | 29,74 | ||||
| 2025-07-25 | 13F | Prostatis Group LLC | 12 637 | 247 | ||||||
| 2025-08-14 | 13F | Stifel Financial Corp | 30 497 | −62,58 | 597 | −60,84 | ||||
| 2025-07-15 | 13F | Fifth Third Bancorp | 23 495 | −6,00 | 460 | −1,50 | ||||
| 2025-08-04 | 13F | Atria Investments Llc | 0 | −100,00 | 0 | |||||
| 2025-07-21 | 13F | Ameriflex Group, Inc. | 0 | −100,00 | 0 | |||||
| 2025-05-16 | 13F | Jones Financial Companies Lllp | 0 | −100,00 | 0 | |||||
| 2025-07-16 | 13F | Highline Wealth Partners Llc | 422 | 0,96 | 8 | 14,29 | ||||
| 2025-08-05 | 13F | Bank Of Montreal /can/ | 200 | 0,00 | 4 | 0,00 | ||||
| 2025-08-15 | 13F | Captrust Financial Advisors | 43 122 | −0,83 | 843 | 3,82 | ||||
| 2025-09-04 | 13F/A | Advisor Group Holdings, Inc. | 124 488 | −4,98 | 2 435 | −0,49 | ||||
| 2025-08-14 | 13F | Ancora Advisors, LLC | 0 | −100,00 | 0 | |||||
| 2025-08-12 | 13F | LPL Financial LLC | 131 924 | −4,71 | 2 580 | −0,23 | ||||
| 2025-08-14 | 13F | Citadel Advisors Llc | Put | 25 800 | 24,64 | 505 | 30,57 | |||
| 2025-08-14 | 13F | Bnp Paribas Arbitrage, Sa | 0 | −100,00 | 0 | |||||
| 2025-08-13 | 13F | BCJ Capital Management, LLC | 0 | −100,00 | 0 | |||||
| 2025-05-13 | 13F | ASB Consultores, LLC | 0 | −100,00 | 0 | |||||
| 2025-07-16 | 13F | West Branch Capital LLC | 500 | 0,00 | 10 | 0,00 | ||||
| 2025-07-28 | 13F | Kiker Wealth Management, LLC | 52 | 0,00 | 1 | |||||
| 2025-08-14 | 13F | Wells Fargo & Company/mn | 409 251 | 141,08 | 8 005 | 152,41 | ||||
| 2025-04-21 | 13F | United Advisor Group, LLC | 0 | −100,00 | 0 | |||||
| 2025-08-12 | 13F | Proequities, Inc. | 0 | 0 | ||||||
| 2025-07-14 | 13F | Painted Porch Advisors LLC | 540 | 0,00 | 11 | 0,00 | ||||
| 2025-07-21 | 13F | Credential Qtrade Securities Inc. | 0 | −100,00 | 0 | −100,00 | ||||
| 2025-05-06 | 13F | Cetera Investment Advisers | 0 | −100,00 | 0 | |||||
| 2025-07-08 | 13F | Lowe Wealth Advisors, LLC | 6 500 | −2,99 | 127 | 1,60 | ||||
| 2025-07-25 | 13F | Griffin Asset Management, Inc. | 0 | −100,00 | 0 | |||||
| 2025-07-30 | 13F | Bleakley Financial Group, LLC | 126 733 | 59,98 | 2 479 | 67,55 | ||||
| 2025-08-06 | 13F | Golden State Wealth Management, LLC | 1 549 | 0,00 | 30 | 7,14 | ||||
| 2025-07-28 | 13F | Harbour Investments, Inc. | 315 | 0,00 | 6 | 20,00 | ||||
| 2025-07-08 | 13F | Ehrlich Financial Group | 0 | −100,00 | 0 | |||||
| 2025-08-08 | 13F | Fortis Group Advisors, LLC | 103 233 | 230,47 | 1 982 | 239,97 | ||||
| 2025-08-12 | 13F | SRS Capital Advisors, Inc. | 10 | 0,00 | 0 | |||||
| 2025-05-21 | 13F/A | Geneos Wealth Management Inc. | 1 384 | 26 | ||||||
| 2025-07-29 | 13F | Straight Path Wealth Management | 13 439 | −10,12 | 263 | −6,09 | ||||
| 2025-07-25 | 13F | Concurrent Investment Advisors, LLC | 0 | −100,00 | 0 | |||||
| 2025-07-23 | 13F | Venturi Wealth Management, LLC | 0 | −100,00 | 0 | |||||
| 2025-08-14 | 13F | DecisionPoint Financial, LLC | 65 | 1 | ||||||
| 2025-07-25 | 13F | Cwm, Llc | 7 033 | 54,81 | 0 | |||||
| 2025-05-14 | 13F | Flow Traders U.s. Llc | 0 | −100,00 | 0 | |||||
| 2025-08-05 | 13F | Simplex Trading, Llc | 250 | 165,96 | 0 | |||||
| 2025-04-21 | 13F | Nelson, Van Denburg & Campbell Wealth Management Group, LLC | 0 | −100,00 | 0 | |||||
| 2025-07-07 | 13F | Investors Research Corp | 642 | 0,00 | 13 | 9,09 | ||||
| 2025-07-10 | 13F | Tompkins Financial Corp | 1 130 | 0,00 | 22 | 4,76 | ||||
| 2025-07-17 | 13F | Beacon Capital Management, LLC | 356 | 0,85 | 7 | 0,00 | ||||
| 2025-08-14 | 13F | Susquehanna International Group, Llp | 43 297 | 847 | ||||||
| 2025-07-16 | 13F | Signaturefd, Llc | 0 | −100,00 | 0 | |||||
| 2025-07-31 | 13F | Brinker Capital Investments, LLC | 0 | −100,00 | 0 | −100,00 | ||||
| 2025-07-17 | 13F | Sound Income Strategies, LLC | 80 | 2 | ||||||
| 2025-07-10 | 13F | Wealth Enhancement Advisory Services, Llc | 748 854 | −1,41 | 14 468 | 1,97 | ||||
| 2025-08-14 | 13F | GWM Advisors LLC | 18 991 | 4,65 | 371 | 9,44 | ||||
| 2025-05-01 | 13F | WESPAC Advisors, LLC | 0 | −100,00 | 0 | |||||
| 2025-08-14 | 13F | BCS Private Wealth Management, Inc. | 183 062 | 4 | ||||||
| 2025-05-15 | 13F | Tower Research Capital LLC (TRC) | 0 | −100,00 | 0 | |||||
| 2025-08-12 | 13F | Jpmorgan Chase & Co | 117 | 588,24 | 2 | |||||
| 2025-04-29 | 13F | U.S. Capital Wealth Advisors, LLC | 0 | −100,00 | 0 | |||||
| 2025-08-08 | 13F | Capital Investment Advisory Services, LLC | 3 245 | 0,00 | 63 | 5,00 | ||||
| 2025-07-11 | 13F | Caldwell Securities, Inc | 0 | −100,00 | 0 | |||||
| 2025-08-15 | 13F | Morgan Stanley | 355 688 | 119,91 | 6 957 | 130,29 | ||||
| 2025-08-11 | 13F | TD Waterhouse Canada Inc. | 2 450 | 0,00 | 47 | 4,44 | ||||
| 2025-07-08 | 13F | Nbc Securities, Inc. | 0 | −100,00 | 0 | |||||
| 2025-08-14 | 13F | Qube Research & Technologies Ltd | 153 | 3 | ||||||
| 2025-07-31 | 13F | Cambridge Investment Research Advisors, Inc. | 0 | −100,00 | 0 | |||||
| 2025-08-14 | 13F | Ambassador Advisors, LLC | 689 405 | 2,26 | 13 485 | 7,08 | ||||
| 2025-07-15 | 13F | MCF Advisors LLC | 7 070 | −0,81 | 138 | 3,76 | ||||
| 2025-05-16 | 13F | Laidlaw Wealth Management LLC | 0 | −100,00 | 0 | −100,00 | ||||
| 2025-08-12 | 13F | Global Retirement Partners, LLC | 2 012 | 39 | ||||||
| 2025-07-28 | 13F | Copia Wealth Management | 1 033 | −12,09 | 20 | −4,76 | ||||
| 2025-07-16 | 13F | One + One Wealth Management, Llc | 46 123 | 3,59 | 902 | 8,54 | ||||
| 2025-08-11 | 13F | HighTower Advisors, LLC | 140 474 | −46,25 | 2 748 | −43,72 | ||||
| 2025-08-14 | 13F | Aqr Capital Management Llc | 10 888 | 213 | ||||||
| 2025-05-14 | 13F | Oarsman Capital, Inc. | 0 | −100,00 | 0 | |||||
| 2025-08-05 | 13F | Bank of New York Mellon Corp | 0 | −100,00 | 0 | |||||
| 2025-07-24 | 13F | Trust Co Of Toledo Na /oh/ | 123 | 2 | ||||||
| 2025-07-30 | 13F | Crewe Advisors LLC | 0 | −100,00 | 0 | |||||
| 2025-08-14 | 13F | Old Mission Capital Llc | 35 218 | 689 | ||||||
| 2025-08-06 | 13F | Pekin Hardy Strauss, Inc. | 182 857 | 6,95 | 3 577 | 11,99 | ||||
| 2025-08-14 | 13F | Comerica Bank | 10 112 | −28,53 | 198 | −25,38 | ||||
| 2025-05-15 | 13F | Centaurus Financial, Inc. | 0 | −100,00 | 0 | |||||
| 2025-07-16 | 13F | Patron Partners Advisors, Llc | 0 | −100,00 | 0 |