Grundläggande statistik
| Institutionella ägare | 86 total, 82 long only, 0 short only, 4 long/short - change of 1,16% MRQ |
| Genomsnittlig portföljallokering | 0.0564 % - change of −0,77% MRQ |
| Institutionella aktier (lång) | 1 705 498 (ex 13D/G) - change of 0,21MM shares 14,17% MRQ |
| Institutionellt värde (lång) | $ 96 059 USD ($1000) |
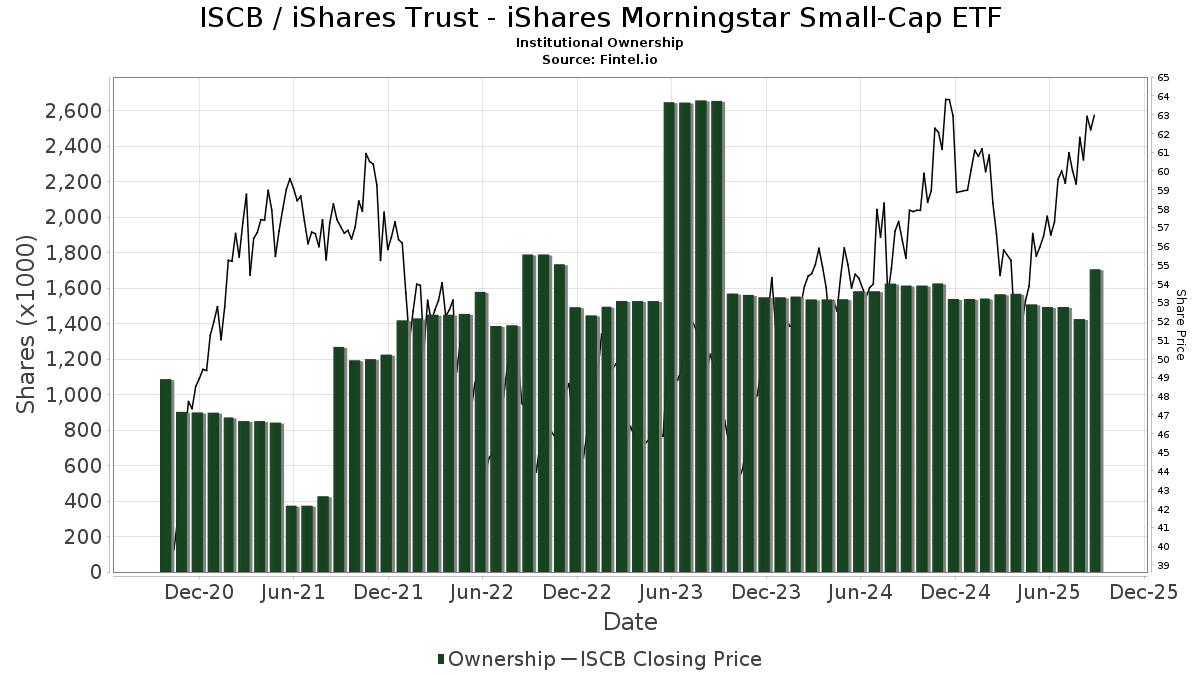
Institutionellt ägande och aktieägare
iShares Trust - iShares Morningstar Small-Cap ETF (US:ISCB) har 86 Institutionella ägare och aktieägare som har lämnat in 13D/G- eller 13F-formulär till Securities Exchange Commission (SEC). Dessa institut innehar totalt 1,705,498 aktier. Största aktieägare inkluderar Simplex Trading, Llc, Simplex Trading, Llc, Morgan Stanley, Group One Trading, L.p., Cetera Investment Advisers, IMC-Chicago, LLC, LPL Financial LLC, IMC-Chicago, LLC, Wells Fargo & Company/mn, and Bank Of America Corp /de/ .
iShares Trust - iShares Morningstar Small-Cap ETF (ARCA:ISCB) Institutionell ägarstruktur visar institutioners och fonders nuvarande positioner i företaget, samt de senaste förändringarna i positionernas storlek. Större aktieägare kan vara enskilda investerare, fonder, hedgefonder eller institutioner. Bilaga 13D visar att investeraren äger (eller ägde) mer än 5% av företaget och avser (eller avsåg) att aktivt eftersträva en förändring av affärsstrategin. Schedule 13G indikerar en passiv investering på över 5%.
The share price as of September 10, 2025 is 62,96 / share. Previously, on September 11, 2024, the share price was 55,35 / share. This represents an increase of 13,74% over that period.
Fondsentimentets poäng
Fondsentimentet poängen(fka Ägarackumulation-poäng) visar vilka aktier som är mest köpta av fonder. Det är resultatet av en sofistikerad kvantitativ flerfaktormodell som identifierar företag med de högsta nivåerna av institutionell ackumulering. Poängsättningsmodellen använder en kombination av den totala ökningen av redovisade ägare, förändringarna i portföljallokeringarna för dessa ägare och andra mått. Siffran sträcker sig från 0 till 100, där högre siffror indikerar en högre nivå av ackumulering i förhållande till sina konkurrenter, och 50 är genomsnittet.
Uppdateringsfrekvens: Dagligen
Se Ownership Explorer, som innehåller en lista över de högst rankade företagen.
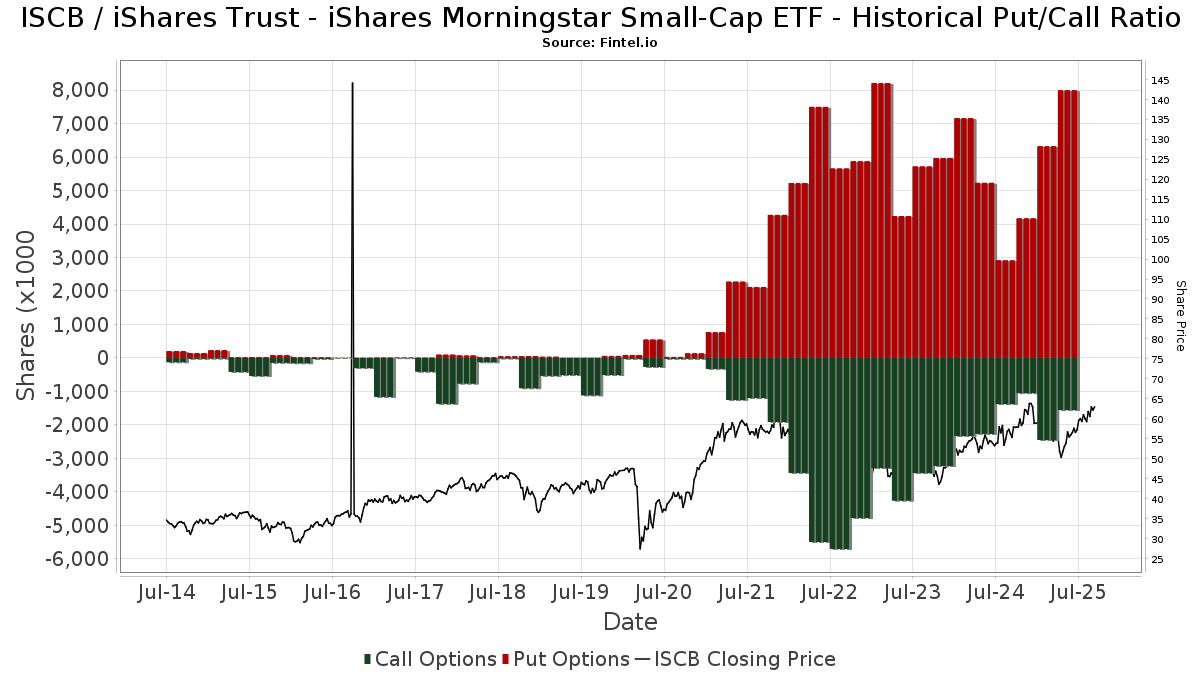
Institutionell sälj/köp-kvot
Förutom att rapportera vanliga eget kapital- och skuldemissioner måste institutioner med mer än 100MM tillgångar under förvaltning också avslöja sina innehav av sälj- och köpoptioner. Eftersom säljoptioner i allmänhet indikerar ett negativt sentiment och köpoptioner indikerar ett positivt sentiment, kan vi få en uppfattning om det övergripande institutionella sentimentet genom att plotta förhållandet mellan säljoptioner och köpoptioner. Diagrammet till höger visar det historiska förhållandet mellan sälj- och köpoptioner för detta instrument.
Genom att använda sälj/köp-kvoten som en indikator på aktieägarnas sentiment undviker man en av de största bristerna med att använda det totala institutionella ägandet, nämligen att en betydande del av de förvaltade tillgångarna investeras passivt för att följa index. Passivt förvaltade fonder köper vanligtvis inte optioner, så indikatorn för sälj/köp-kvoten ger en bättre bild av stämningen i aktivt förvaltade fonder.
13F- och NPORT-arkiveringar
Detaljer om 13F-arkiveringar är gratis. Detaljer om NP-arkiveringar kräver ett premiummedlemskap. Gröna rader indikerar nya positioner. Röda rader indikerar stängda positioner. Klicka på länk symbolen för att se hela transaktionshistoriken.
Uppgradera
för att låsa upp premiumdata och exportera till Excel ![]() .
.
| Fil Datum | Källa | Investerare | Typ | Genomsnittligt pris (beräknat) |
Aktier | Δ Aktier (%) |
Rapporterat värde (1000 USD) |
Δ Värde (%) |
Portföljallokering (%) |
|
|---|---|---|---|---|---|---|---|---|---|---|
| 2025-08-08 | 13F | Pnc Financial Services Group, Inc. | 8 000 | 0,00 | 466 | 7,62 | ||||
| 2025-08-13 | 13F | Beacon Pointe Advisors, LLC | 3 860 | 0,00 | 225 | 7,18 | ||||
| 2025-04-17 | 13F | Janney Montgomery Scott LLC | 0 | −100,00 | 0 | |||||
| 2025-08-08 | 13F | Cetera Investment Advisers | 197 039 | 2 079,88 | 11 483 | 2 248,06 | ||||
| 2025-08-14 | 13F | Mml Investors Services, Llc | 0 | −100,00 | 0 | |||||
| 2025-08-01 | 13F | Envestnet Asset Management Inc | 0 | −100,00 | 0 | |||||
| 2025-08-11 | 13F | Citigroup Inc | 2 493 | −55,31 | 145 | −51,99 | ||||
| 2025-08-12 | 13F | LPL Financial LLC | 154 202 | 82,94 | 8 986 | 96,80 | ||||
| 2025-04-16 | 13F | Wealth Enhancement Advisory Services, Llc | 0 | −100,00 | 0 | |||||
| 2025-07-16 | 13F | ORG Partners LLC | 360 | 0,00 | 21 | 10,53 | ||||
| 2025-08-11 | 13F | Principal Securities, Inc. | 1 221 | 2,09 | 71 | 1,43 | ||||
| 2025-08-14 | 13F | UBS Group AG | 29 211 | −10,37 | 1 702 | −3,57 | ||||
| 2025-07-23 | 13F | Richwood Investment Advisors, LLC | 10 019 | −1,57 | 584 | 5,81 | ||||
| 2025-07-25 | 13F | Cwm, Llc | 1 677 | 280,27 | 0 | |||||
| 2025-07-31 | 13F | Cambridge Investment Research Advisors, Inc. | 8 765 | 9,91 | 1 | |||||
| 2025-08-14 | 13F | Matrix Private Capital Group Llc | 792 | 0,00 | 46 | 9,52 | ||||
| 2025-08-13 | 13F | Jones Financial Companies Lllp | 1 628 | −8,69 | 95 | −2,08 | ||||
| 2025-07-16 | 13F | New Insight Wealth Advisors | 7 105 | −6,44 | 414 | 0,73 | ||||
| 2025-08-12 | 13F | Gladstone Institutional Advisory LLC | 37 840 | −1,07 | 2 205 | 6,42 | ||||
| 2025-07-22 | 13F | Merit Financial Group, LLC | 3 522 | 205 | ||||||
| 2025-08-18 | 13F | Geneos Wealth Management Inc. | 189 | 11 | ||||||
| 2025-08-04 | 13F | Jim Saulnier & Associates, Llc | 10 379 | −4,29 | 605 | 2,90 | ||||
| 2025-08-11 | 13F | HighTower Advisors, LLC | 24 215 | 0,00 | 1 411 | 7,63 | ||||
| 2025-07-24 | 13F | KFA Private Wealth Group, LLC | 10 679 | −1,56 | 622 | 5,96 | ||||
| 2025-08-14 | 13F | Citadel Advisors Llc | 10 750 | 93,76 | 626 | 108,67 | ||||
| 2025-08-19 | 13F | Cape Investment Advisory, Inc. | 300 | 0,00 | 17 | 6,25 | ||||
| 2025-05-12 | 13F | Aveo Capital Partners, LLC | 0 | −100,00 | 0 | −100,00 | ||||
| 2025-07-11 | 13F | Farther Finance Advisors, LLC | 1 552 | 0,00 | 90 | 7,14 | ||||
| 2025-08-05 | 13F | Key FInancial Inc | 772 | 7,67 | 45 | 15,79 | ||||
| 2025-08-13 | 13F | Level Four Advisory Services, Llc | 8 728 | 0,00 | 509 | 7,63 | ||||
| 2025-08-14 | 13F | Guardian Wealth Advisors, Llc / Nc | 3 993 | 0,28 | 233 | 7,91 | ||||
| 2025-08-14 | 13F | Wells Fargo & Company/mn | 71 549 | 3,22 | 4 170 | 11,03 | ||||
| 2025-08-12 | 13F | Jpmorgan Chase & Co | Call | 17 000 | −83,00 | 1 584 | −83,37 | |||
| 2025-08-14 | 13F | Mercer Global Advisors Inc /adv | 26 219 | −0,38 | 1 528 | 7,16 | ||||
| 2025-07-18 | 13F | Bartlett & Co. Wealth Management Llc | 3 600 | 0,00 | 210 | 7,18 | ||||
| 2025-08-14 | 13F | Raymond James Financial Inc | 33 386 | −1,11 | 1 946 | 6,40 | ||||
| 2025-08-14 | 13F/A | Rockefeller Capital Management L.P. | 28 990 | −0,61 | 1 689 | 6,90 | ||||
| 2025-07-15 | 13F | Christensen, King & Associates Investment Services, Inc. | 5 688 | 0,09 | 331 | 3,76 | ||||
| 2025-08-06 | 13F | Commonwealth Equity Services, Llc | 36 620 | −4,33 | 2 | 0,00 | ||||
| 2025-07-25 | 13F | Pathway Financial Advisors LLC | 4 350 | 254 | ||||||
| 2025-08-12 | 13F | Proequities, Inc. | Call | 0 | 0 | |||||
| 2025-08-12 | 13F | Global Retirement Partners, LLC | 287 | 0,00 | 17 | 0,00 | ||||
| 2025-08-14 | 13F | Jane Street Group, Llc | 0 | −100,00 | 0 | |||||
| 2025-05-13 | 13F | Adams Wealth Management | 48 985 | 0,58 | 2 654 | −7,14 | ||||
| 2025-07-23 | 13F | Opulen Financial Group LLC | 7 517 | −10,35 | 438 | −3,52 | ||||
| 2025-07-29 | 13F | Goldstein Advisors, LLC | 41 839 | 0,20 | 2 438 | 7,78 | ||||
| 2025-08-05 | 13F | Huntington National Bank | 13 | 8,33 | ||||||
| 2025-08-12 | 13F | Jpmorgan Chase & Co | 16 393 | −17,72 | 955 | −11,49 | ||||
| 2025-08-13 | 13F | National Bank Of Canada /fi/ | Call | 0 | −100,00 | 0 | ||||
| 2025-08-14 | 13F | Royal Bank Of Canada | 6 327 | −32,51 | 369 | −27,36 | ||||
| 2025-08-12 | 13F | Archer Investment Corp | 208 | 0,00 | 12 | 9,09 | ||||
| 2025-05-14 | 13F | Kestra Advisory Services, LLC | 0 | −100,00 | 0 | |||||
| 2025-08-15 | 13F | Equitable Holdings, Inc. | 3 788 | 0,16 | 221 | 7,84 | ||||
| 2025-05-13 | 13F | CacheTech Inc. | 48 985 | 0,58 | 2 654 | −7,14 | ||||
| 2025-07-09 | 13F | Brand Asset Management Group, Inc. | 24 850 | −14,40 | 1 448 | −7,89 | ||||
| 2025-04-22 | 13F | Continuum Wealth Advisors, Llc | 0 | −100,00 | 0 | |||||
| 2025-08-14 | 13F | Bank Of America Corp /de/ | 65 600 | 13,57 | 3 823 | 22,15 | ||||
| 2025-08-14 | 13F | Comerica Bank | 1 241 | 33,58 | 72 | 44,00 | ||||
| 2025-08-13 | 13F | EverSource Wealth Advisors, LLC | 574 | 0,00 | 33 | 6,45 | ||||
| 2025-08-13 | 13F | IAG Wealth Partners, LLC | 115 | 7 | ||||||
| 2025-08-15 | 13F | Morgan Stanley | 363 666 | −0,56 | 21 193 | 6,97 | ||||
| 2025-08-08 | 13F | Creative Planning | 3 923 | 1,58 | 229 | 9,09 | ||||
| 2025-08-13 | 13F | Strategic Financial Planning, Inc. | 3 580 | 209 | ||||||
| 2025-08-04 | 13F | Spire Wealth Management | 91 | 5 | ||||||
| 2025-09-04 | 13F/A | Advisor Group Holdings, Inc. | 12 192 | 4,50 | 711 | 12,34 | ||||
| 2025-07-23 | 13F | Trifecta Capital Advisors, LLC | 1 276 | 0,00 | 74 | 7,25 | ||||
| 2025-08-11 | 13F | Synergy Investment Management, LLC | 0 | −100,00 | 0 | |||||
| 2025-08-11 | 13F | Nations Financial Group Inc, /ia/ /adv | 20 838 | −0,13 | 1 214 | 7,43 | ||||
| 2025-08-11 | 13F | Aptus Capital Advisors, LLC | 4 060 | 0,27 | 237 | 7,76 | ||||
| 2025-07-18 | 13F | Parsons Capital Management Inc/ri | 6 480 | 0,00 | 378 | 7,41 | ||||
| 2025-08-14 | 13F | Goldman Sachs Group Inc | 43 648 | 0,00 | 2 544 | 7,57 | ||||
| 2025-07-09 | 13F | Pps&v Asset Management Consultants, Inc. | 5 755 | 0,00 | 335 | 7,72 | ||||
| 2025-08-14 | 13F | Mariner, LLC | 6 225 | −29,98 | 363 | −24,74 | ||||
| 2025-07-25 | 13F | Atria Wealth Solutions, Inc. | 0 | −100,00 | 0 | |||||
| 2025-08-14 | 13F | Fmr Llc | 7 275 | 0,25 | 424 | 7,63 | ||||
| 2025-08-11 | 13F | WPG Advisers, LLC | 1 616 | 0,00 | 94 | 8,05 | ||||
| 2025-08-13 | 13F | Northwestern Mutual Wealth Management Co | 16 994 | 24,45 | 990 | 33,96 | ||||
| 2025-07-25 | 13F | NorthRock Partners, LLC | 768 | 0,00 | 45 | 7,32 | ||||
| 2025-08-13 | 13F | Russell Investments Group, Ltd. | 90 | 0,00 | 5 | 25,00 | ||||
| 2025-08-12 | 13F | Proequities, Inc. | 0 | 0 | ||||||
| 2025-08-12 | 13F | Franklin Resources Inc | 2 500 | 0,00 | 146 | 7,41 | ||||
| 2025-08-08 | 13F | Avantax Advisory Services, Inc. | 59 119 | 11,93 | 3 445 | 20,41 | ||||
| 2025-08-12 | 13F | Proequities, Inc. | Put | 0 | 0 | |||||
| 2025-08-14 | 13F | GWM Advisors LLC | 559 | 0,18 | 33 | 6,67 | ||||
| 2025-08-05 | 13F | Simplex Trading, Llc | Put | 7 799 800 | 26,02 | 644 | 27,08 | |||
| 2025-08-05 | 13F | Simplex Trading, Llc | Call | 1 129 100 | −49,14 | 84 | −48,78 | |||
| 2025-07-31 | 13F | Schneider Downs Wealth Management Advisors, LP | 3 572 | 208 | ||||||
| 2025-07-22 | 13F | IMC-Chicago, LLC | Put | 187 300 | 48,77 | 13 721 | 20,42 | |||
| 2025-08-12 | 13F | Steward Partners Investment Advisory, Llc | 5 450 | 4,01 | 318 | 12,01 | ||||
| 2025-07-22 | 13F | IMC-Chicago, LLC | Call | 139 700 | 49,89 | 13 016 | 549,45 | |||
| 2025-08-08 | 13F | Larson Financial Group LLC | 10 | 0,00 | 1 | |||||
| 2025-07-22 | 13F | Apexium Financial, Lp | 8 312 | −9,82 | 484 | −3,01 | ||||
| 2025-08-13 | 13F | Rsm Us Wealth Management Llc | 24 669 | 0,31 | 1 438 | 7,88 | ||||
| 2025-08-14 | 13F | Ameriprise Financial Inc | 22 425 | 0,08 | 1 307 | 7,67 | ||||
| 2025-08-14 | 13F | Group One Trading, L.p. | Call | 266 900 | 696,72 | 22 239 | 1 358,30 | |||
| 2025-08-13 | 13F | Colonial Trust Advisors | 247 | 0,00 | 14 | 7,69 | ||||
| 2025-07-16 | 13F | Perigon Wealth Management, LLC | 7 574 | −1,23 | 441 | 6,27 | ||||
| 2025-07-08 | 13F | Nbc Securities, Inc. | 2 169 | 0,00 | 0 | |||||
| 2025-07-14 | 13F | Signature Securities Group Corporation | 5 656 | −13,05 | 330 | −6,53 | ||||
| 2025-08-11 | 13F | Private Advisor Group, LLC | 7 494 | −9,54 | 437 | −2,68 | ||||
| 2025-08-05 | 13F | Tsfg, Llc | 420 | 0,00 | 0 | |||||
| 2025-08-13 | 13F | Advisor Group Holdings, Inc. | Put | 38 | 1 | |||||
| 2025-08-14 | 13F | Sunbelt Securities, Inc. | 80 | 0,00 | 5 | 0,00 | ||||
| 2025-08-14 | 13F | Group One Trading, L.p. | Put | 2 700 | 3,85 | 134 | 9,92 | |||
| 2025-08-14 | 13F | Susquehanna International Group, Llp | 39 763 | 648,27 | 2 317 | 707,32 | ||||
| 2025-07-07 | 13F | Global Wealth Strategies & Associates | 600 | 0,00 | 35 | 6,25 |