Grundläggande statistik
| Institutionella ägare | 186 total, 186 long only, 0 short only, 0 long/short - change of 3,31% MRQ |
| Genomsnittlig portföljallokering | 0.2536 % - change of −5,66% MRQ |
| Institutionella aktier (lång) | 8 652 062 (ex 13D/G) - change of 1,10MM shares 14,64% MRQ |
| Institutionellt värde (lång) | $ 626 617 USD ($1000) |
Institutionellt ägande och aktieägare
iShares Trust - iShares Morningstar Mid-Cap ETF (US:IMCB) har 186 Institutionella ägare och aktieägare som har lämnat in 13D/G- eller 13F-formulär till Securities Exchange Commission (SEC). Dessa institut innehar totalt 8,652,062 aktier. Största aktieägare inkluderar UBS Group AG, Morgan Stanley, RMG Wealth Management LLC, LPL Financial LLC, Commonwealth Equity Services, Llc, Means Investment Co., Inc., Raymond James Financial Inc, Cetera Investment Advisers, Steele Capital Management, Inc., and Matrix Trust Co .
iShares Trust - iShares Morningstar Mid-Cap ETF (ARCA:IMCB) Institutionell ägarstruktur visar institutioners och fonders nuvarande positioner i företaget, samt de senaste förändringarna i positionernas storlek. Större aktieägare kan vara enskilda investerare, fonder, hedgefonder eller institutioner. Bilaga 13D visar att investeraren äger (eller ägde) mer än 5% av företaget och avser (eller avsåg) att aktivt eftersträva en förändring av affärsstrategin. Schedule 13G indikerar en passiv investering på över 5%.
The share price as of September 9, 2025 is 82,40 / share. Previously, on September 10, 2024, the share price was 72,75 / share. This represents an increase of 13,26% over that period.

Fondsentimentets poäng
Fondsentimentet poängen(fka Ägarackumulation-poäng) visar vilka aktier som är mest köpta av fonder. Det är resultatet av en sofistikerad kvantitativ flerfaktormodell som identifierar företag med de högsta nivåerna av institutionell ackumulering. Poängsättningsmodellen använder en kombination av den totala ökningen av redovisade ägare, förändringarna i portföljallokeringarna för dessa ägare och andra mått. Siffran sträcker sig från 0 till 100, där högre siffror indikerar en högre nivå av ackumulering i förhållande till sina konkurrenter, och 50 är genomsnittet.
Uppdateringsfrekvens: Dagligen
Se Ownership Explorer, som innehåller en lista över de högst rankade företagen.
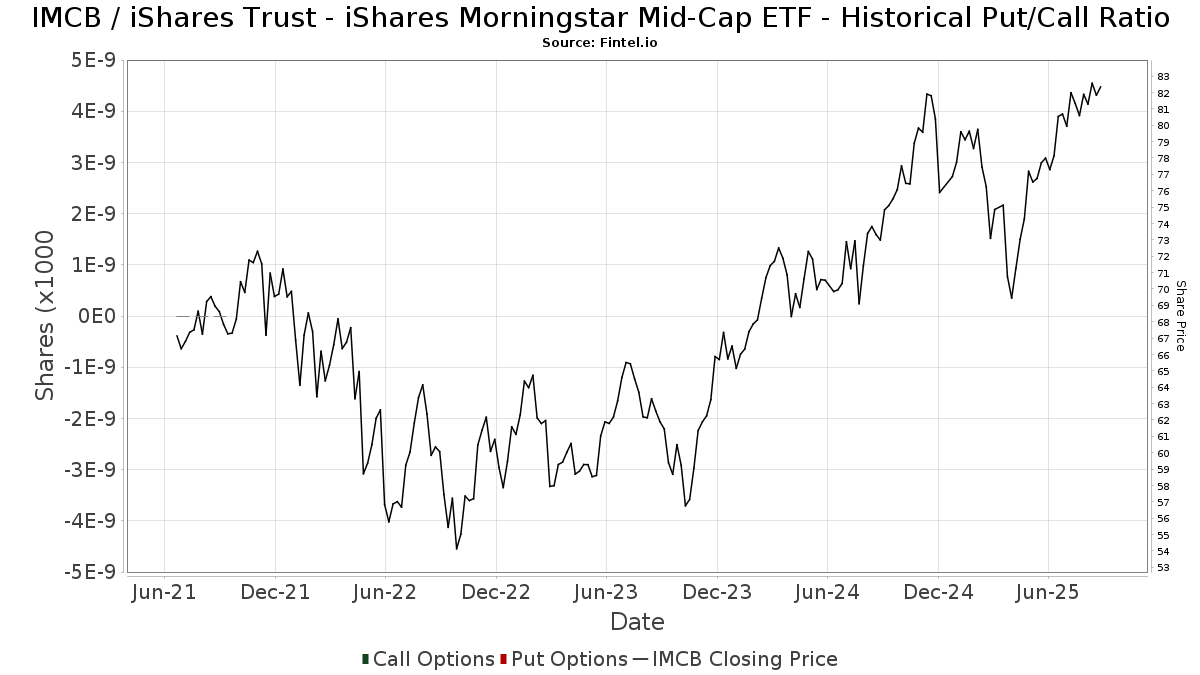
Institutionell sälj/köp-kvot
Förutom att rapportera vanliga eget kapital- och skuldemissioner måste institutioner med mer än 100MM tillgångar under förvaltning också avslöja sina innehav av sälj- och köpoptioner. Eftersom säljoptioner i allmänhet indikerar ett negativt sentiment och köpoptioner indikerar ett positivt sentiment, kan vi få en uppfattning om det övergripande institutionella sentimentet genom att plotta förhållandet mellan säljoptioner och köpoptioner. Diagrammet till höger visar det historiska förhållandet mellan sälj- och köpoptioner för detta instrument.
Genom att använda sälj/köp-kvoten som en indikator på aktieägarnas sentiment undviker man en av de största bristerna med att använda det totala institutionella ägandet, nämligen att en betydande del av de förvaltade tillgångarna investeras passivt för att följa index. Passivt förvaltade fonder köper vanligtvis inte optioner, så indikatorn för sälj/köp-kvoten ger en bättre bild av stämningen i aktivt förvaltade fonder.
13F- och NPORT-arkiveringar
Detaljer om 13F-arkiveringar är gratis. Detaljer om NP-arkiveringar kräver ett premiummedlemskap. Gröna rader indikerar nya positioner. Röda rader indikerar stängda positioner. Klicka på länk symbolen för att se hela transaktionshistoriken.
Uppgradera
för att låsa upp premiumdata och exportera till Excel ![]() .
.
| Fil Datum | Källa | Investerare | Typ | Genomsnittligt pris (beräknat) |
Aktier | Δ Aktier (%) |
Rapporterat värde (1000 USD) |
Δ Värde (%) |
Portföljallokering (%) |
|
|---|---|---|---|---|---|---|---|---|---|---|
| 2025-08-14 | 13F | Diversify Advisory Services, LLC | 8 729 | −3,06 | 706 | 7,29 | ||||
| 2025-08-06 | 13F | Hoxton Planning & Management, LLC | 5 841 | 465 | ||||||
| 2025-08-11 | 13F | Synergy Investment Management, LLC | 0 | −100,00 | 0 | |||||
| 2025-07-16 | 13F | Signaturefd, Llc | 1 596 | 1,79 | 127 | 9,48 | ||||
| 2025-07-15 | 13F | Pitti Group Wealth Management, LLC | 16 507 | −2,66 | 1 315 | 4,62 | ||||
| 2025-05-12 | 13F | C2P Capital Advisory Group, LLC d.b.a. Prosperity Capital Advisors | 0 | −100,00 | 0 | −100,00 | ||||
| 2025-07-31 | 13F | Cambridge Investment Research Advisors, Inc. | 83 538 | 4,81 | 7 | 20,00 | ||||
| 2025-08-14 | 13F | UBS Group AG | 1 309 271 | 3,80 | 104 297 | 11,61 | ||||
| 2025-08-14 | 13F | Wealth Preservation Advisors, LLC | 705 | 0,43 | 56 | 7,69 | ||||
| 2025-08-08 | 13F | Good Life Advisors, LLC | 5 076 | 0,00 | 404 | 7,45 | ||||
| 2025-08-13 | 13F | Financial Freedom, LLC | 936 | 0,00 | 75 | 7,25 | ||||
| 2025-08-05 | 13F | Sigma Planning Corp | 3 911 | 0,10 | 312 | 7,61 | ||||
| 2025-08-05 | 13F | GPS Wealth Strategies Group, LLC | 6 | 0,00 | 0 | |||||
| 2025-08-08 | 13F | Financial Gravity Companies, Inc. | 328 | 0,00 | 26 | 8,33 | ||||
| 2025-08-14 | 13F | Stifel Financial Corp | 74 517 | −1,10 | 5 936 | 6,36 | ||||
| 2025-08-11 | 13F | United Advisor Group, LLC | 22 837 | 16,99 | 1 819 | 25,80 | ||||
| 2025-08-05 | 13F | Ellevest, Inc. | 2 639 | 210 | ||||||
| 2025-07-21 | 13F | HighMark Wealth Management LLC | 1 297 | 0,00 | 103 | 7,29 | ||||
| 2025-07-21 | 13F | Barrett & Company, Inc. | 3 216 | 0,34 | 256 | 8,02 | ||||
| 2025-07-30 | 13F | Fingerlakes Wealth Management, Inc. | 2 618 | 209 | ||||||
| 2025-08-05 | 13F | Atlas Private Wealth Advisors | 3 882 | −34,82 | 309 | −29,93 | ||||
| 2025-08-11 | 13F | Rothschild Investment Llc | 1 451 | 0,00 | 116 | 7,48 | ||||
| 2025-08-19 | 13F | Advisory Services Network, LLC | 12 085 | −6,91 | 978 | 1,77 | ||||
| 2025-08-13 | 13F | Haverford Trust Co | 6 517 | 0,00 | 519 | 7,68 | ||||
| 2025-07-21 | 13F | Pacific Financial Group Inc | 64 764 | 1,21 | 5 159 | 8,84 | ||||
| 2025-08-06 | 13F | AE Wealth Management LLC | 1 348 | 97,65 | 107 | 114,00 | ||||
| 2025-07-28 | 13F | Private Wealth Asset Management, LLC | 1 245 | −23,85 | 99 | −18,18 | ||||
| 2025-08-14 | 13F | Citadel Advisors Llc | 12 425 | 990 | ||||||
| 2025-04-29 | 13F | Resources Investment Advisors, LLC. | 0 | −100,00 | 0 | −100,00 | ||||
| 2025-08-15 | 13F | Truefg, Llc | 9 332 | −0,70 | 743 | 6,75 | ||||
| 2025-07-23 | 13F | Detalus Advisors, LLC | 3 184 | 6,88 | 254 | 15,00 | ||||
| 2025-08-07 | 13F | Addison Advisors LLC | 2 650 | −33,50 | 211 | −28,47 | ||||
| 2025-07-25 | 13F | Cwm, Llc | 13 933 | 3,84 | 1 | |||||
| 2025-04-10 | 13F | EWG Elevate Inc. | 0 | −100,00 | 0 | |||||
| 2025-07-24 | 13F | Morton Brown Family Wealth, LLC | 482 | 0,21 | 38 | 8,57 | ||||
| 2025-07-23 | 13F | Opulen Financial Group LLC | 8 149 | −3,34 | 649 | 4,01 | ||||
| 2025-08-13 | 13F | Capital Analysts, Inc. | 209 | 0,00 | 0 | |||||
| 2025-08-14 | 13F | Goldman Sachs Group Inc | 43 380 | 0,00 | 3 456 | 7,53 | ||||
| 2025-08-12 | 13F | PSI Advisors, LLC | 0 | −100,00 | 0 | |||||
| 2025-08-08 | 13F | Pnc Financial Services Group, Inc. | 692 | 0,29 | 55 | 7,84 | ||||
| 2025-08-12 | 13F | Ameritas Investment Partners, Inc. | 9 380 | 39,81 | 747 | 50,30 | ||||
| 2025-08-07 | 13F | Vise Technologies, Inc. | 4 978 | 397 | ||||||
| 2025-04-24 | 13F | Loring Wolcott & Coolidge Fiduciary Advisors Llp/ma | 0 | −100,00 | 0 | |||||
| 2025-08-12 | 13F | Franklin Resources Inc | 2 000 | 0,00 | 159 | 7,43 | ||||
| 2025-07-29 | 13F | Financial Futures Ltd Liability Co. | 5 586 | 0,00 | 445 | 7,51 | ||||
| 2025-08-13 | 13F | Flow Traders U.s. Llc | 0 | −100,00 | 0 | |||||
| 2025-08-14 | 13F | Glen Eagle Advisors, LLC | 184 | 0,00 | 15 | 7,69 | ||||
| 2025-08-08 | 13F | Evolution Wealth Advisors, LLC | 4 000 | 0,00 | 319 | 7,43 | ||||
| 2025-08-14 | 13F | Mercer Global Advisors Inc /adv | 81 572 | 6 498 | ||||||
| 2025-08-05 | 13F | Huntington National Bank | 80 | 6,76 | ||||||
| 2025-08-07 | 13F | Summit Asset Management, LLC | 9 855 | 0,00 | 785 | 7,53 | ||||
| 2025-08-06 | 13F | Commonwealth Equity Services, Llc | 382 362 | −4,16 | 30 | 3,45 | ||||
| 2025-08-12 | 13F | Proequities, Inc. | 0 | 0 | ||||||
| 2025-08-26 | 13F/A | Thrivent Financial For Lutherans | 0 | −100,00 | 0 | |||||
| 2025-07-25 | 13F | Means Investment Co., Inc. | 319 053 | 5,32 | 25 416 | 13,25 | ||||
| 2025-08-07 | 13F | Allworth Financial LP | 439 | 0,00 | 35 | 9,68 | ||||
| 2025-08-14 | 13F | CoreCap Advisors, LLC | 1 360 | 0,00 | 108 | 8,00 | ||||
| 2025-08-04 | 13F | Wealth Management Associates, Inc. | 3 822 | 0,00 | 304 | 7,42 | ||||
| 2025-08-13 | 13F | Russell Investments Group, Ltd. | 382 | 5,82 | 30 | 15,38 | ||||
| 2025-07-10 | 13F | Marshall Financial Group LLC | 5 600 | −9,98 | 450 | −2,17 | ||||
| 2025-08-12 | 13F | Archer Investment Corp | 1 099 | 242,37 | 88 | 278,26 | ||||
| 2025-07-17 | 13F | Janney Montgomery Scott LLC | 11 659 | 4,57 | 1 | |||||
| 2025-07-14 | 13F | AdvisorNet Financial, Inc | 977 | 0,21 | 78 | 6,94 | ||||
| 2025-08-05 | 13F | Westside Investment Management, Inc. | 177 | 0,57 | 14 | 7,69 | ||||
| 2025-07-10 | 13F | Wealth Enhancement Advisory Services, Llc | 30 634 | −1,47 | 2 482 | 7,73 | ||||
| 2025-07-31 | 13F | Glass Jacobson Investment Advisors llc | 957 | −2,15 | 76 | 2,70 | ||||
| 2025-08-08 | 13F | Creative Planning | 4 592 | 13,95 | 366 | 22,48 | ||||
| 2025-07-14 | 13F | Matrix Trust Co | 177 216 | 1,39 | 14 | 16,67 | ||||
| 2025-07-28 | 13F | Copia Wealth Management | 10 | 0,00 | 1 | |||||
| 2025-07-25 | 13F | Yarger Wealth Strategies, Llc | 68 964 | 0,25 | 5 494 | 7,79 | ||||
| 2025-07-29 | 13F | Woodard & Co Asset Management Group Inc /adv | 48 553 | −2,79 | 3 868 | 4,51 | ||||
| 2025-08-12 | 13F | MAI Capital Management | 340 | 0,00 | 27 | 8,00 | ||||
| 2025-08-12 | 13F | Bedel Financial Consulting, Inc. | 47 512 | 2,22 | 3 785 | 10,39 | ||||
| 2025-08-11 | 13F | Aptus Capital Advisors, LLC | 108 491 | 2,80 | 8 642 | 10,54 | ||||
| 2025-08-14 | 13F | Hilltop Holdings Inc. | 7 671 | 611 | ||||||
| 2025-08-18 | 13F | Tyler-Stone Wealth Management | 3 526 | 0,00 | 281 | 7,28 | ||||
| 2025-07-24 | 13F | Blair William & Co/il | 19 | 0,00 | 2 | 0,00 | ||||
| 2025-08-13 | 13F | Northwestern Mutual Wealth Management Co | 34 308 | 5,89 | 2 733 | 13,83 | ||||
| 2025-08-19 | 13F | Asset Dedication, LLC | 42 | 0,00 | 3 | 0,00 | ||||
| 2025-08-14 | 13F | Capital Planning Advisors, LLC | 7 963 | 6,27 | 634 | 14,23 | ||||
| 2025-07-07 | 13F | Global Wealth Strategies & Associates | 1 100 | 0,00 | 88 | 7,41 | ||||
| 2025-07-18 | 13F | PFG Investments, LLC | 6 354 | 29,07 | 506 | 39,01 | ||||
| 2025-08-12 | 13F | O'shaughnessy Asset Management, Llc | 2 | 0 | ||||||
| 2025-07-28 | 13F | Harbour Investments, Inc. | 1 930 | −1,43 | 154 | 5,52 | ||||
| 2025-07-21 | 13F | Ameritas Advisory Services, LLC | 370 | 29 | ||||||
| 2025-07-30 | 13F | Financial Perspectives, Inc | 6 138 | 4,12 | 489 | 11,93 | ||||
| 2025-06-11 | 13F | Fortitude Financial, LLC | 70 502 | −85,42 | 5 223 | −85,82 | ||||
| 2025-07-22 | 13F | Olistico Wealth, LLC | 300 | 0,00 | 24 | 4,55 | ||||
| 2025-07-25 | 13F | Apollon Wealth Management, LLC | 10 838 | 0,00 | 863 | 7,61 | ||||
| 2025-08-14 | 13F | Mml Investors Services, Llc | 121 599 | 1,08 | 10 | 12,50 | ||||
| 2025-08-14 | 13F | Ameriprise Financial Inc | 113 909 | −2,91 | 9 074 | 4,46 | ||||
| 2025-08-26 | NP | EQ ADVISORS TRUST - EQ/Mid Cap Value Managed Volatility Portfolio Class IB | 7 464 | 0,00 | 595 | 7,61 | ||||
| 2025-07-25 | 13F | Atria Wealth Solutions, Inc. | 8 727 | −84,34 | 695 | −83,16 | ||||
| 2025-08-14 | 13F | Mariner, LLC | 7 121 | −3,27 | 567 | 4,04 | ||||
| 2025-05-12 | 13F | Independent Advisor Alliance | 0 | −100,00 | 0 | |||||
| 2025-08-04 | 13F | Creative Financial Designs Inc /adv | 153 163 | 2 080,88 | 12 201 | 2 246,15 | ||||
| 2025-08-13 | 13F | M&t Bank Corp | 6 162 | 69,47 | 491 | 82,16 | ||||
| 2025-08-05 | 13F | Plante Moran Financial Advisors, LLC | 1 675 | 0,00 | 133 | 7,26 | ||||
| 2025-08-12 | 13F | Global Retirement Partners, LLC | 11 938 | −16,70 | 951 | −12,92 | ||||
| 2025-08-12 | 13F | J.w. Cole Advisors, Inc. | 13 139 | 1,99 | 1 047 | 9,64 | ||||
| 2025-07-25 | 13F | Lion Street Advisors, LLC | 2 880 | −18,53 | 229 | −12,26 | ||||
| 2025-07-14 | 13F | S.A. Mason LLC | 11 930 | 0,50 | 950 | 8,08 | ||||
| 2025-08-13 | 13F | Cerity Partners LLC | 20 889 | 0,18 | 1 664 | 7,77 | ||||
| 2025-05-09 | 13F | Bouchey Financial Group Ltd | 0 | −100,00 | 0 | |||||
| 2025-08-04 | 13F | Rede Wealth, LLC | 10 445 | 2,99 | 832 | 10,79 | ||||
| 2025-09-04 | 13F/A | Advisor Group Holdings, Inc. | 128 821 | 1,29 | 10 266 | 8,91 | ||||
| 2025-08-14 | 13F | Arete Wealth Advisors, LLC | 2 707 | 0,11 | 0 | |||||
| 2025-07-18 | 13F | Liberty Capital Management, Inc. | 10 200 | 0,00 | 813 | 7,55 | ||||
| 2025-07-24 | 13F | Robertson Stephens Wealth Management, LLC | 3 560 | 0,00 | 284 | 7,60 | ||||
| 2025-07-24 | 13F | IFP Advisors, Inc | 240 | 0,00 | 19 | 11,76 | ||||
| 2025-08-05 | 13F | Tsfg, Llc | 420 | 0,00 | 0 | |||||
| 2025-08-14 | 13F | Glenview Trust Co | 3 887 | 0,00 | 310 | 7,67 | ||||
| 2025-07-14 | 13F | Signature Securities Group Corporation | 23 750 | −1,80 | 1 892 | 5,58 | ||||
| 2025-08-05 | 13F | EPG Wealth Management LLC | 1 423 | −20,86 | 113 | −15,04 | ||||
| 2025-08-14 | 13F | Wells Fargo & Company/mn | 81 593 | −21,23 | 6 500 | −15,30 | ||||
| 2025-08-05 | 13F | Integrity Financial Corp /WA | 220 | 0,00 | 18 | 6,25 | ||||
| 2025-08-05 | 13F | Sunburst Financial Group, LLC | 107 230 | 2,84 | 8 542 | 10,58 | ||||
| 2025-08-01 | 13F | Envestnet Asset Management Inc | 67 204 | 31,88 | 5 353 | 41,80 | ||||
| 2025-07-22 | 13F | Merit Financial Group, LLC | 27 254 | 10,63 | 2 171 | 18,96 | ||||
| 2025-05-08 | 13F | NorthRock Partners, LLC | 0 | −100,00 | 0 | |||||
| 2025-07-18 | 13F | Philip James Wealth Mangement, LLC | 5 694 | 0,33 | 454 | 7,86 | ||||
| 2025-08-12 | 13F | NFP Retirement, Inc. | 4 803 | 0,00 | 383 | 7,61 | ||||
| 2025-07-31 | 13F/A | Avion Wealth | 643 | 0,00 | 0 | |||||
| 2025-08-13 | 13F | Jones Financial Companies Lllp | 4 402 | 29,78 | 348 | 39,76 | ||||
| 2025-07-08 | 13F | Apella Capital, LLC | 11 532 | 0,00 | 928 | 13,60 | ||||
| 2025-08-12 | 13F | Clearwater Capital Advisors, LLC | 3 446 | 0,00 | 275 | 7,45 | ||||
| 2025-08-19 | 13F | Cape Investment Advisory, Inc. | 1 786 | 0,00 | 142 | 7,58 | ||||
| 2025-08-11 | 13F | Western Wealth Management, LLC | 0 | −100,00 | 0 | |||||
| 2025-08-12 | 13F | LPL Financial LLC | 498 843 | 9,97 | 39 738 | 18,25 | ||||
| 2025-07-17 | 13F | Global Trust Asset Management, LLC | 12 | 0,00 | 1 | |||||
| 2025-08-11 | 13F | Citigroup Inc | 4 103 | −2,10 | 327 | 5,16 | ||||
| 2025-04-30 | 13F | Sofos Investments, Inc. | 328 | 0,00 | 24 | 9,09 | ||||
| 2025-08-08 | 13F | Cetera Investment Advisers | 181 928 | 0,89 | 14 492 | 8,49 | ||||
| 2025-08-12 | 13F | CIBC Private Wealth Group, LLC | 7 264 | −23,58 | 579 | −6,92 | ||||
| 2025-08-11 | 13F | Principal Securities, Inc. | 316 | −22,55 | 25 | −19,35 | ||||
| 2025-08-14 | 13F | Matrix Private Capital Group Llc | 2 617 | −3,25 | 208 | 4,00 | ||||
| 2025-07-31 | 13F | Carnegie Capital Asset Management, LLC | 6 935 | 552 | ||||||
| 2025-07-18 | 13F | Benchmark Wealth Management, LLC | 55 403 | 0,04 | 4 413 | 7,58 | ||||
| 2025-08-04 | 13F | Jim Saulnier & Associates, Llc | 17 856 | −7,91 | 1 422 | −0,97 | ||||
| 2025-08-15 | 13F | Morgan Stanley | 1 254 715 | 5,02 | 99 951 | 12,93 | ||||
| 2025-08-12 | 13F | Howe & Rusling Inc | 1 736 | 138 | ||||||
| 2025-07-28 | 13F | RFG Advisory, LLC | 3 051 | −3,91 | 243 | 3,40 | ||||
| 2025-07-17 | 13F | Sound Income Strategies, LLC | 280 | 0,00 | 22 | 10,00 | ||||
| 2025-07-21 | 13F | Patriot Financial Group Insurance Agency, LLC | 38 738 | 8,69 | 3 086 | 16,86 | ||||
| 2025-08-01 | 13F | Boyd Watterson Asset Management Llc/oh | 184 | 0,00 | 15 | 7,69 | ||||
| 2025-08-04 | 13F | Adell Harriman & Carpenter Inc | 4 300 | 0,00 | 343 | 7,55 | ||||
| 2025-07-11 | 13F | Farther Finance Advisors, LLC | 42 691 | 1 347,15 | 3 401 | 1 452,51 | ||||
| 2025-08-11 | 13F | HighTower Advisors, LLC | 43 592 | 0,00 | 3 473 | 7,53 | ||||
| 2025-04-10 | 13F | Portside Wealth Group, LLC | 0 | −100,00 | 0 | −100,00 | ||||
| 2025-07-18 | 13F | Centricity Wealth Management, LLC | 308 | 0,00 | 25 | 9,09 | ||||
| 2025-08-14 | 13F | Integrated Wealth Concepts LLC | 6 860 | 0,18 | 546 | 7,69 | ||||
| 2025-08-14 | 13F | Fmr Llc | 14 672 | −12,54 | 1 169 | −5,96 | ||||
| 2025-08-15 | 13F | CI Private Wealth, LLC | 9 450 | 20,41 | 753 | 29,43 | ||||
| 2025-07-09 | 13F | Procyon Private Wealth Partners, LLC | 4 594 | 0,15 | 366 | 7,67 | ||||
| 2025-07-17 | 13F | XML Financial, LLC | 3 740 | −1,24 | 298 | 6,07 | ||||
| 2025-08-04 | 13F | Pensionmark Financial Group, Llc | 19 056 | −7,99 | 1 518 | −1,04 | ||||
| 2025-08-08 | 13F | Avantax Advisory Services, Inc. | 83 245 | 1,08 | 6 631 | 8,69 | ||||
| 2025-08-15 | 13F | Tower Research Capital LLC (TRC) | 0 | −100,00 | 0 | |||||
| 2025-08-07 | 13F | 49 Wealth Management, Llc | 4 790 | 0,34 | 382 | 7,93 | ||||
| 2025-08-08 | 13F | Gts Securities Llc | 0 | −100,00 | 0 | |||||
| 2025-08-14 | 13F | Raymond James Financial Inc | 317 974 | −1,15 | 25 330 | 6,29 | ||||
| 2025-08-14 | 13F | IHT Wealth Management, LLC | 4 711 | −0,32 | 375 | 7,14 | ||||
| 2025-08-06 | 13F | Decker Retirement Planning Inc. | 17 | 0,00 | 1 | 0,00 | ||||
| 2025-07-29 | 13F | Goldstein Advisors, LLC | 39 303 | 4,60 | 3 131 | 12,47 | ||||
| 2025-07-09 | 13F | Brand Asset Management Group, Inc. | 36 400 | 1,20 | 2 900 | 8,82 | ||||
| 2025-08-13 | 13F | Summit Wealth Group Llc / Co | 3 825 | 305 | ||||||
| 2025-05-14 | 13F | Jane Street Group, Llc | 0 | −100,00 | 0 | |||||
| 2025-08-14 | 13F | Bank Of America Corp /de/ | 92 496 | 3,33 | 7 368 | 11,11 | ||||
| 2025-08-12 | 13F | Jpmorgan Chase & Co | 25 892 | 3,99 | 2 063 | 11,82 | ||||
| 2025-08-14 | 13F | Comerica Bank | 6 077 | 6,15 | 484 | 14,15 | ||||
| 2025-08-08 | 13F | Foundations Investment Advisors, LLC | 3 161 | 0,00 | 252 | 7,26 | ||||
| 2025-08-06 | 13F | Savant Capital, LLC | 5 284 | 0,00 | 421 | 7,42 | ||||
| 2025-08-15 | 13F | Equitable Holdings, Inc. | 34 725 | 7,43 | 2 766 | 15,54 | ||||
| 2025-05-14 | 13F | Van Hulzen Asset Management, LLC | 0 | −100,00 | 0 | |||||
| 2025-07-18 | 13F | Truist Financial Corp | 23 209 | −1,44 | 1 849 | 5,96 | ||||
| 2025-08-14 | 13F | Royal Bank Of Canada | 53 929 | 16,56 | 4 296 | 25,32 | ||||
| 2025-07-23 | 13F | Kingswood Wealth Advisors, Llc | 0 | −100,00 | 0 | |||||
| 2025-04-21 | 13F | Nelson, Van Denburg & Campbell Wealth Management Group, LLC | 0 | −100,00 | 0 | |||||
| 2025-07-18 | 13F | Parsons Capital Management Inc/ri | 17 498 | −1,80 | 1 394 | 5,53 | ||||
| 2025-07-28 | 13F | Mutual Advisors, LLC | 4 520 | 0,00 | 372 | 13,46 | ||||
| 2025-07-30 | 13F | Whittier Trust Co Of Nevada Inc | 68 | 0,00 | 5 | 0,00 | ||||
| 2025-07-09 | 13F | Pps&v Asset Management Consultants, Inc. | 3 851 | 0,00 | 307 | 7,37 | ||||
| 2025-08-14 | 13F | Silvercrest Asset Management Group Llc | 3 089 | 0,00 | 246 | 7,89 | ||||
| 2025-07-10 | 13F | Three Seasons Wealth, LLC | 4 686 | −0,66 | 373 | 6,88 | ||||
| 2025-08-14 | 13F | Susquehanna International Group, Llp | 0 | −100,00 | 0 | |||||
| 2025-08-14 | 13F | GWM Advisors LLC | 2 001 | 0,25 | 159 | 8,16 | ||||
| 2025-08-08 | 13F | WASHINGTON TRUST Co | 0 | −100,00 | 0 | |||||
| 2025-07-22 | 13F | Steele Capital Management, Inc. | 177 217 | 1,39 | 14 117 | 9,03 | ||||
| 2025-05-28 | 13F | Silicon Valley Capital Partners | 954 | 70 | ||||||
| 2025-08-15 | 13F | Kestra Advisory Services, LLC | 47 602 | 11,28 | 3 792 | 19,63 | ||||
| 2025-08-08 | 13F | Capital Investment Advisory Services, LLC | 96 | 8 | ||||||
| 2025-08-13 | 13F | Proactive Wealth Strategies LLC | 4 256 | 0,33 | 0 | |||||
| 2025-07-31 | 13F | Briaud Financial Planning, Inc | 60 | 0,00 | 0 | |||||
| 2025-05-08 | 13F | Empirical Financial Services, LLC d.b.a. Empirical Wealth Management | 0 | −100,00 | 0 | |||||
| 2025-07-21 | 13F | Triad Wealth Partners, LLC | 7 632 | 608 | ||||||
| 2025-07-22 | 13F | Miracle Mile Advisors, LLC | 8 522 | −18,80 | 679 | −12,74 | ||||
| 2025-04-30 | 13F | Stratos Wealth Partners, LTD. | 0 | −100,00 | 0 | |||||
| 2025-08-04 | 13F | Assetmark, Inc | 2 383 | −76,52 | 190 | −74,83 | ||||
| 2025-07-23 | 13F | RMG Wealth Management LLC | 1 083 709 | 87 672 | ||||||
| 2025-07-29 | 13F | Salomon & Ludwin, LLC | 241 | 0,00 | 19 | 11,76 | ||||
| 2025-08-12 | 13F | Steward Partners Investment Advisory, Llc | 2 163 | 0,84 | 172 | 8,86 | ||||
| 2025-08-12 | 13F | Gladstone Institutional Advisory LLC | 67 124 | −0,44 | 5 347 | 7,07 | ||||
| 2025-07-14 | 13F | Farmers & Merchants Investments Inc | 3 012 | 0,00 | 240 | 7,17 | ||||
| 2025-07-31 | 13F | Schneider Downs Wealth Management Advisors, LP | 4 053 | 323 | ||||||
| 2025-07-11 | 13F | Kaydan Wealth Management, Inc. | 5 392 | 0,00 | 430 | 7,52 | ||||
| 2025-08-18 | 13F | Geneos Wealth Management Inc. | 4 480 | 100,00 | 357 | 115,76 | ||||
| 2025-05-14 | 13F | Mission Creek Capital Partners, Inc. | 0 | −100,00 | 0 | |||||
| 2025-08-05 | 13F | Bank Of Montreal /can/ | 0 | −100,00 | 0 | |||||
| 2025-07-24 | 13F | Edge Financial Advisors LLC | 3 114 | 250 | ||||||
| 2025-07-10 | 13F | Security National Bank | 100 | 0,00 | 8 | 0,00 | ||||
| 2025-08-01 | 13F | SYM FINANCIAL Corp | 228 | 18 | ||||||
| 2025-07-14 | 13F | Sowell Financial Services LLC | 38 539 | 3 070 | ||||||
| 2025-08-11 | 13F | Private Advisor Group, LLC | 2 893 | 4,82 | 230 | 12,75 |