Grundläggande statistik
| Institutionella ägare | 115 total, 115 long only, 0 short only, 0 long/short - change of −3,36% MRQ |
| Genomsnittlig portföljallokering | 0.0883 % - change of −5,66% MRQ |
| Institutionella aktier (lång) | 37 968 578 (ex 13D/G) - change of −1,25MM shares −3,19% MRQ |
| Institutionellt värde (lång) | $ 179 103 USD ($1000) |
Institutionellt ägande och aktieägare
CBRE Global Real Estate Income Fund (US:IGR) har 115 Institutionella ägare och aktieägare som har lämnat in 13D/G- eller 13F-formulär till Securities Exchange Commission (SEC). Dessa institut innehar totalt 37,968,578 aktier. Största aktieägare inkluderar Morgan Stanley, UBS Group AG, Penserra Capital Management LLC, YYY - Amplify High Income ETF, Flagship Harbor Advisors, Llc, Bank Of America Corp /de/, Wells Fargo & Company/mn, Ameriprise Financial Inc, LPL Financial LLC, and Pacific Wealth Strategies Group, Inc. .
CBRE Global Real Estate Income Fund (NYSE:IGR) Institutionell ägarstruktur visar institutioners och fonders nuvarande positioner i företaget, samt de senaste förändringarna i positionernas storlek. Större aktieägare kan vara enskilda investerare, fonder, hedgefonder eller institutioner. Bilaga 13D visar att investeraren äger (eller ägde) mer än 5% av företaget och avser (eller avsåg) att aktivt eftersträva en förändring av affärsstrategin. Schedule 13G indikerar en passiv investering på över 5%.
The share price as of September 10, 2025 is 5,05 / share. Previously, on September 11, 2024, the share price was 6,37 / share. This represents a decline of 20,72% over that period.

Fondsentimentets poäng
Fondsentimentet poängen(fka Ägarackumulation-poäng) visar vilka aktier som är mest köpta av fonder. Det är resultatet av en sofistikerad kvantitativ flerfaktormodell som identifierar företag med de högsta nivåerna av institutionell ackumulering. Poängsättningsmodellen använder en kombination av den totala ökningen av redovisade ägare, förändringarna i portföljallokeringarna för dessa ägare och andra mått. Siffran sträcker sig från 0 till 100, där högre siffror indikerar en högre nivå av ackumulering i förhållande till sina konkurrenter, och 50 är genomsnittet.
Uppdateringsfrekvens: Dagligen
Se Ownership Explorer, som innehåller en lista över de högst rankade företagen.
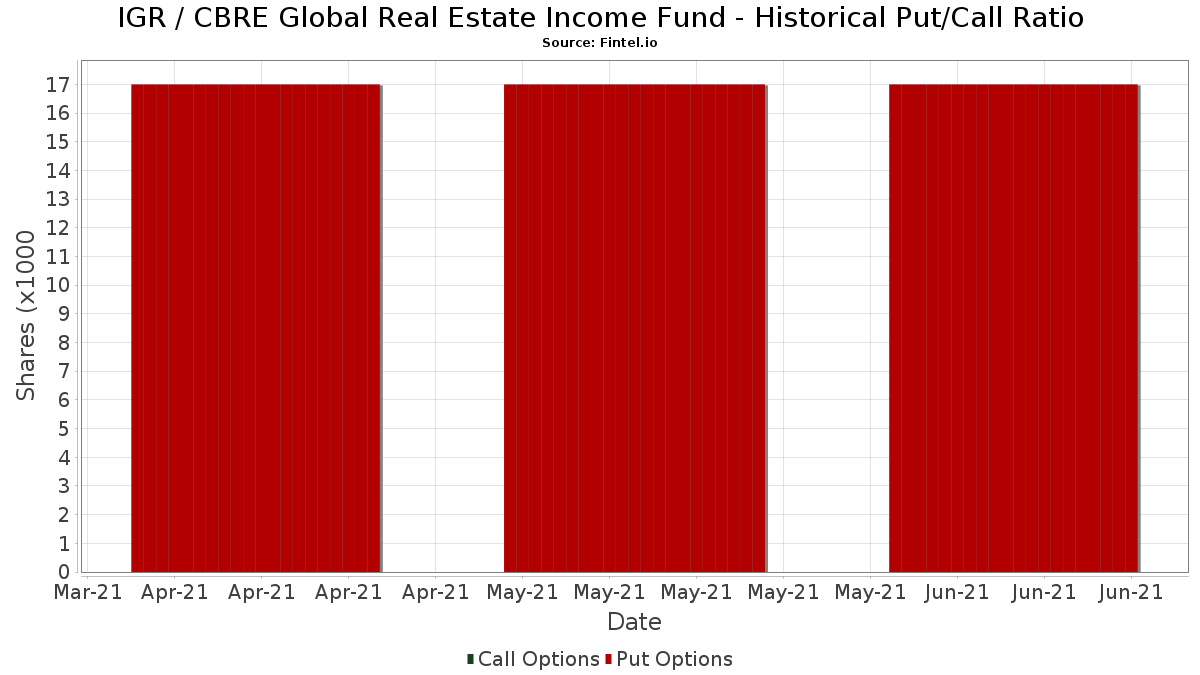
Institutionell sälj/köp-kvot
Förutom att rapportera vanliga eget kapital- och skuldemissioner måste institutioner med mer än 100MM tillgångar under förvaltning också avslöja sina innehav av sälj- och köpoptioner. Eftersom säljoptioner i allmänhet indikerar ett negativt sentiment och köpoptioner indikerar ett positivt sentiment, kan vi få en uppfattning om det övergripande institutionella sentimentet genom att plotta förhållandet mellan säljoptioner och köpoptioner. Diagrammet till höger visar det historiska förhållandet mellan sälj- och köpoptioner för detta instrument.
Genom att använda sälj/köp-kvoten som en indikator på aktieägarnas sentiment undviker man en av de största bristerna med att använda det totala institutionella ägandet, nämligen att en betydande del av de förvaltade tillgångarna investeras passivt för att följa index. Passivt förvaltade fonder köper vanligtvis inte optioner, så indikatorn för sälj/köp-kvoten ger en bättre bild av stämningen i aktivt förvaltade fonder.
13F- och NPORT-arkiveringar
Detaljer om 13F-arkiveringar är gratis. Detaljer om NP-arkiveringar kräver ett premiummedlemskap. Gröna rader indikerar nya positioner. Röda rader indikerar stängda positioner. Klicka på länk symbolen för att se hela transaktionshistoriken.
Uppgradera
för att låsa upp premiumdata och exportera till Excel ![]() .
.
| Fil Datum | Källa | Investerare | Typ | Genomsnittligt pris (beräknat) |
Aktier | Δ Aktier (%) |
Rapporterat värde (1000 USD) |
Δ Värde (%) |
Portföljallokering (%) |
|
|---|---|---|---|---|---|---|---|---|---|---|
| 2025-08-11 | 13F | Private Advisor Group, LLC | 14 953 | 0,00 | 79 | 2,60 | ||||
| 2025-08-07 | 13F | Kestra Private Wealth Services, Llc | 24 600 | 0,00 | 130 | 3,17 | ||||
| 2025-05-08 | 13F | Harbour Investments, Inc. | 0 | −100,00 | 0 | |||||
| 2025-05-08 | 13F | XTX Topco Ltd | 0 | −100,00 | 0 | |||||
| 2025-08-01 | 13F | Transcend Wealth Collective, Llc | 0 | −100,00 | 0 | |||||
| 2025-08-06 | 13F | Golden State Wealth Management, LLC | 900 | 0,00 | 5 | 0,00 | ||||
| 2025-08-14 | 13F | IHT Wealth Management, LLC | 97 489 | −0,96 | 516 | 1,58 | ||||
| 2025-07-11 | 13F | Seacrest Wealth Management, Llc | 42 345 | 7,77 | 224 | 10,89 | ||||
| 2025-08-14 | 13F | Royal Bank Of Canada | 479 852 | 31,38 | 2 538 | 34,64 | ||||
| 2025-08-07 | 13F | Samalin Investment Counsel, LLC | 90 111 | 2,12 | 477 | 4,62 | ||||
| 2025-08-14 | 13F | Mercer Global Advisors Inc /adv | 0 | −100,00 | 0 | |||||
| 2025-08-13 | 13F | Rsm Us Wealth Management Llc | 76 339 | −10,17 | 404 | −7,99 | ||||
| 2025-07-18 | 13F | Cooper Financial Group | 236 055 | 3,12 | 1 249 | 5,67 | ||||
| 2025-08-18 | 13F | Geneos Wealth Management Inc. | 40 688 | −13,00 | 215 | −10,79 | ||||
| 2025-07-22 | 13F | Merit Financial Group, LLC | 78 690 | 33,71 | 416 | 37,29 | ||||
| 2025-07-18 | 13F | SOA Wealth Advisors, LLC. | 174 | 3,57 | 1 | |||||
| 2025-05-13 | 13F | HighTower Advisors, LLC | 0 | −100,00 | 0 | −100,00 | ||||
| 2025-07-09 | 13F | Sunpointe, LLC | 84 900 | 449 | ||||||
| 2025-08-05 | 13F | Pacific Wealth Strategies Group, Inc. | 635 083 | −10,06 | 3 074 | −15,65 | ||||
| 2025-08-14 | 13F | Stifel Financial Corp | 225 100 | 1,94 | 1 191 | 4,48 | ||||
| 2025-08-14 | 13F | Ameriprise Financial Inc | 945 863 | 5,35 | 5 004 | 8,03 | ||||
| 2025-07-21 | 13F | Future Financial Wealth Managment LLC | 10 000 | 0,00 | 53 | 1,96 | ||||
| 2025-08-12 | 13F | LPL Financial LLC | 943 534 | 11,16 | 4 991 | 13,98 | ||||
| 2025-08-04 | 13F | Spire Wealth Management | 523 | 0,00 | 3 | 0,00 | ||||
| 2025-08-12 | 13F | Jpmorgan Chase & Co | 0 | −100,00 | 0 | |||||
| 2025-07-14 | 13F | Pacifica Partners Inc. | 550 | 0,00 | 3 | 0,00 | ||||
| 2025-08-11 | 13F | One Capital Management, LLC | 13 552 | 0,00 | 72 | 2,90 | ||||
| 2025-08-12 | 13F | Coldstream Capital Management Inc | 0 | −100,00 | 0 | |||||
| 2025-08-13 | 13F | Colonial Trust Advisors | 2 750 | 15 | ||||||
| 2025-08-19 | 13F | National Asset Management, Inc. | 21 093 | 1,34 | 112 | 11,00 | ||||
| 2025-08-15 | 13F | Prevail Innovative Wealth Advisors, Llc | 316 674 | 11,55 | 1 675 | 14,41 | ||||
| 2025-08-11 | 13F | PFG Private Wealth Management, LLC | 0 | −100,00 | 0 | |||||
| 2025-07-10 | 13F | Stolper Co | 105 933 | 8,33 | 1 | |||||
| 2025-08-14 | 13F | EP Wealth Advisors, Inc. | 35 249 | 0,00 | 186 | 2,76 | ||||
| 2025-07-16 | 13F | Investment Partners Asset Management, Inc. | 173 024 | −0,21 | 915 | 2,35 | ||||
| 2025-07-25 | 13F | Cwm, Llc | 3 621 | 0,00 | 0 | |||||
| 2025-08-14 | 13F | Mariner, LLC | 85 415 | 3,60 | 452 | 6,12 | ||||
| 2025-08-14 | 13F | Moneta Group Investment Advisors Llc | 0 | −100,00 | 0 | |||||
| 2025-05-12 | 13F | Fmr Llc | 0 | −100,00 | 0 | |||||
| 2025-08-05 | 13F | Bank of New York Mellon Corp | 0 | −100,00 | 0 | |||||
| 2025-08-12 | 13F | Evelyn Partners Asset Management Ltd | 2 823 | 15 | ||||||
| 2025-08-14 | 13F | Two Sigma Securities, Llc | 0 | −100,00 | 0 | |||||
| 2025-08-04 | 13F | Flagship Harbor Advisors, Llc | 1 916 196 | 3,34 | 10 137 | 5,94 | ||||
| 2025-07-25 | 13F | Hazlett, Burt & Watson, Inc. | 1 000 | 0,00 | 0 | |||||
| 2025-05-13 | 13F | SFI Advisors, LLC | 0 | −100,00 | 0 | |||||
| 2025-07-31 | 13F | 180 Wealth Advisors, Llc | 165 457 | −0,37 | 875 | 2,58 | ||||
| 2025-08-13 | 13F | Fiduciary Group LLC | 15 953 | 6,50 | 84 | 9,09 | ||||
| 2025-08-14 | 13F | GWM Advisors LLC | 42 605 | 123,18 | 225 | 129,59 | ||||
| 2025-07-24 | 13F | Leo Wealth, LLC | 13 981 | 3,60 | 74 | 5,80 | ||||
| 2025-08-14 | 13F | Bank Of America Corp /de/ | 1 845 097 | 0,13 | 9 761 | 2,65 | ||||
| 2025-07-21 | 13F | Ameriflex Group, Inc. | 4 200 | −85,31 | 22 | −85,71 | ||||
| 2025-05-14 | 13F | Susquehanna International Group, Llp | 0 | −100,00 | 0 | |||||
| 2025-08-08 | 13F | Larson Financial Group LLC | 6 000 | 0,00 | 32 | 3,33 | ||||
| 2025-08-11 | 13F | Citigroup Inc | 2 | 0,00 | 0 | |||||
| 2025-08-15 | 13F | Captrust Financial Advisors | 39 877 | 211 | ||||||
| 2025-08-11 | 13F | Actinver Wealth Management, Inc. | 22 442 | 30,43 | 119 | 34,09 | ||||
| 2025-07-23 | 13F | Clear Creek Financial Management, LLC | 0 | −100,00 | 0 | |||||
| 2025-08-13 | 13F | Baird Financial Group, Inc. | 60 734 | −8,60 | 321 | −6,14 | ||||
| 2025-07-10 | 13F | Wealth Enhancement Advisory Services, Llc | 66 389 | −1,71 | 356 | 2,01 | ||||
| 2025-08-12 | 13F | MAI Capital Management | 1 286 | 365,94 | 7 | 500,00 | ||||
| 2025-08-13 | 13F | Guggenheim Capital Llc | 64 197 | −2,40 | 340 | 0,00 | ||||
| 2025-05-12 | 13F | Peapack Gladstone Financial Corp | 0 | −100,00 | 0 | |||||
| 2025-09-09 | 13F | NWF Advisory Services Inc. | 273 500 | −0,94 | 1 447 | 1,54 | ||||
| 2025-08-12 | 13F | J.w. Cole Advisors, Inc. | 431 757 | 2,81 | 2 284 | 5,35 | ||||
| 2025-08-07 | 13F | Addison Advisors LLC | 61 | 0,00 | 0 | |||||
| 2025-08-11 | 13F | Nations Financial Group Inc, /ia/ /adv | 14 436 | 0,00 | 76 | 2,70 | ||||
| 2025-08-18 | 13F/A | National Bank Of Canada /fi/ | 55 845 | 1 560,08 | 295 | 1 629,41 | ||||
| 2025-08-06 | 13F | Commonwealth Equity Services, Llc | 80 608 | −39,27 | 0 | |||||
| 2025-04-30 | 13F | Heritage Wealth Management, Inc. /CA/ | 0 | −100,00 | 0 | |||||
| 2025-07-07 | 13F | Nova Wealth Management, Inc. | 7 897 | 0,00 | 42 | 2,50 | ||||
| 2025-08-06 | 13F | AE Wealth Management LLC | 12 700 | 67 | ||||||
| 2025-04-16 | 13F | Caldwell Securities, Inc | 0 | −100,00 | 0 | |||||
| 2025-08-04 | 13F | Creative Financial Designs Inc /adv | 1 315 | 0,00 | 7 | 0,00 | ||||
| 2025-07-17 | 13F | Janney Montgomery Scott LLC | 53 273 | 0,61 | 0 | |||||
| 2025-08-13 | 13F | Northwestern Mutual Wealth Management Co | 7 766 | 41 | ||||||
| 2025-07-31 | 13F | Cambridge Investment Research Advisors, Inc. | 52 563 | −2,92 | 0 | |||||
| 2025-08-28 | NP | YYY - Amplify High Income ETF | 3 658 899 | 2,00 | 19 356 | 4,57 | ||||
| 2025-05-16 | 13F | Jones Financial Companies Lllp | 0 | −100,00 | 0 | |||||
| 2025-08-12 | 13F | Proequities, Inc. | 0 | 0 | ||||||
| 2025-04-24 | 13F | Decker Retirement Planning Inc. | 0 | −100,00 | 0 | |||||
| 2025-07-29 | 13F | Stephens Inc /ar/ | 10 278 | −2,59 | 54 | 0,00 | ||||
| 2025-08-04 | 13F | Assetmark, Inc | 144 | 0,00 | 1 | |||||
| 2025-07-30 | 13F | Blume Capital Management, Inc. | 3 000 | 0,00 | 16 | 0,00 | ||||
| 2025-05-14 | 13F | Landscape Capital Management, L.l.c. | 0 | −100,00 | 0 | |||||
| 2025-08-08 | 13F | Schwarz Dygos Wheeler Investment Advisors Llc | 291 921 | 8,65 | 1 544 | 11,40 | ||||
| 2025-07-25 | 13F | We Are One Seven, LLC | 18 336 | 9,93 | 97 | 11,63 | ||||
| 2025-07-30 | 13F | Roman Butler Fullerton & Co | 257 529 | 1,18 | 1 282 | 6,74 | ||||
| 2025-07-14 | 13F | Sowell Financial Services LLC | 11 798 | −55,79 | 62 | −54,74 | ||||
| 2025-05-19 | 13F/A | Jane Street Group, Llc | 0 | −100,00 | 0 | −100,00 | ||||
| 2025-07-14 | 13F | GAMMA Investing LLC | 12 | 0 | ||||||
| 2025-08-15 | 13F | Tower Research Capital LLC (TRC) | 45 | 0 | ||||||
| 2025-08-14 | 13F | CoreCap Advisors, LLC | 2 153 | 0,00 | 11 | 0,00 | ||||
| 2025-08-14 | 13F | Atomi Financial Group, Inc. | 100 808 | −0,67 | 533 | 1,91 | ||||
| 2025-08-14 | 13F | Comerica Bank | 31 339 | −9,92 | 166 | −7,82 | ||||
| 2025-04-14 | 13F | Daymark Wealth Partners, Llc | 0 | −100,00 | 0 | |||||
| 2025-07-17 | 13F/A | Capital Investment Advisors, LLC | 12 982 | −7,44 | 69 | −5,56 | ||||
| 2025-07-10 | 13F | Atticus Wealth Management, Llc | 7 340 | 41,05 | 39 | 46,15 | ||||
| 2025-07-25 | 13F | Atria Wealth Solutions, Inc. | 53 750 | 0,00 | 285 | 2,53 | ||||
| 2025-07-14 | 13F | Occidental Asset Management, LLC | 15 844 | −11,42 | 84 | −9,78 | ||||
| 2025-08-13 | 13F | Level Four Advisory Services, Llc | 14 409 | −35,90 | 76 | −33,91 | ||||
| 2025-05-14 | 13F | Walleye Capital LLC | 0 | −100,00 | 0 | |||||
| 2025-08-14 | 13F | Hrt Financial Lp | 0 | −100,00 | 0 | |||||
| 2025-08-11 | 13F | Elequin Capital Lp | 0 | −100,00 | 0 | |||||
| 2025-08-14 | 13F | Raymond James Financial Inc | 166 585 | 7,17 | 881 | 9,85 | ||||
| 2025-05-09 | 13F | Shaker Financial Services, LLC | 0 | −100,00 | 0 | |||||
| 2025-05-16 | 13F | Coppell Advisory Solutions LLC | 0 | −100,00 | 0 | |||||
| 2025-05-20 | 13F/A | Colony Group, LLC | 0 | −100,00 | 0 | −100,00 | ||||
| 2025-08-11 | 13F | United Capital Financial Advisers, Llc | 10 447 | 0,00 | 55 | 3,77 | ||||
| 2025-08-08 | 13F | Good Life Advisors, LLC | 14 181 | −0,43 | 75 | 2,74 | ||||
| 2025-08-13 | 13F | WealthTrust Axiom LLC | 352 815 | 0,18 | 1 866 | 2,70 | ||||
| 2025-09-04 | 13F/A | Advisor Group Holdings, Inc. | 506 876 | 4,21 | 2 681 | 6,86 | ||||
| 2025-08-12 | 13F | Steward Partners Investment Advisory, Llc | 13 104 | −24,86 | 69 | −22,47 | ||||
| 2025-07-10 | 13F | Kozak & Associates, Inc. | 1 931 | 10 | ||||||
| 2025-08-05 | 13F | Holistic Financial Partners | 14 440 | 0,00 | 76 | 2,70 | ||||
| 2025-08-14 | 13F | Ieq Capital, Llc | 20 141 | −6,07 | 107 | −3,64 | ||||
| 2025-08-11 | 13F | WPG Advisers, LLC | 7 261 | −30,72 | 38 | −29,63 | ||||
| 2025-07-14 | 13F | Park Avenue Securities Llc | 41 403 | −13,00 | 0 | |||||
| 2025-07-21 | 13F | Ameritas Advisory Services, LLC | 19 010 | 79,17 | 101 | 92,31 | ||||
| 2025-05-09 | 13F | Cornerstone Advisors, LLC | 0 | −100,00 | 0 | −100,00 | ||||
| 2025-07-24 | 13F | Us Bancorp \de\ | 45 074 | 0,00 | 238 | 2,59 | ||||
| 2025-08-07 | 13F | Allworth Financial LP | 1 809 | 3 073,68 | 10 | |||||
| 2025-08-12 | 13F | Advisors Asset Management, Inc. | 121 136 | −60,95 | 641 | −60,00 | ||||
| 2025-08-06 | 13F | Mark Sheptoff Financial Planning, Llc | 1 000 | 0,00 | 5 | 0,00 | ||||
| 2025-07-28 | 13F | Axxcess Wealth Management, Llc | 16 538 | −4,81 | 87 | −2,25 | ||||
| 2025-08-05 | 13F | Sigma Planning Corp | 19 820 | 1,11 | 105 | 2,97 | ||||
| 2025-08-01 | 13F | Envestnet Asset Management Inc | 21 237 | 112 | ||||||
| 2025-07-30 | 13F | Whittier Trust Co | 5 | 0 | ||||||
| 2025-07-15 | 13F | Highland Financial Advisors, LLC | 11 600 | 61 | ||||||
| 2025-07-31 | 13F | Leavell Investment Management, Inc. | 12 500 | 0,00 | 66 | 3,13 | ||||
| 2025-08-29 | 13F | Centaurus Financial, Inc. | 0 | −100,00 | 0 | |||||
| 2025-07-29 | 13F | Private Trust Co Na | 1 000 | 0,00 | 5 | 0,00 | ||||
| 2025-07-25 | 13F | GFS Advisors, LLC | 0 | −100,00 | 0 | |||||
| 2025-08-06 | 13F | Moors & Cabot, Inc. | 73 113 | 2,48 | 387 | 4,89 | ||||
| 2025-08-12 | 13F | Global Retirement Partners, LLC | 22 286 | 0,02 | 118 | 9,35 | ||||
| 2025-05-02 | 13F | BlackRock, Inc. | 0 | −100,00 | 0 | |||||
| 2025-08-11 | 13F | Principal Securities, Inc. | 1 576 | 88,07 | 8 | 100,00 | ||||
| 2025-05-12 | 13F | Wolverine Asset Management Llc | 0 | −100,00 | 0 | |||||
| 2025-04-23 | 13F | Walkner Condon Financial Advisors LLC | 0 | −100,00 | 0 | |||||
| 2025-08-08 | 13F | Pnc Financial Services Group, Inc. | 36 662 | −21,09 | 194 | −19,25 | ||||
| 2025-08-15 | 13F | Morgan Stanley | 10 482 631 | −8,82 | 55 453 | −6,52 | ||||
| 2025-08-08 | 13F | Cetera Investment Advisers | 386 511 | 11,62 | 2 045 | 14,45 | ||||
| 2025-08-11 | 13F | Alteri Wealth LLC | 49 327 | 0,00 | 261 | 2,36 | ||||
| 2025-08-05 | 13F | Burney Co/ | 25 437 | 3,20 | 135 | 5,51 | ||||
| 2025-08-14 | 13F | Wells Fargo & Company/mn | 1 585 773 | 3,01 | 8 389 | 5,60 | ||||
| 2025-08-14 | 13F | UBS Group AG | 5 346 993 | −0,09 | 28 286 | 2,43 | ||||
| 2025-08-04 | 13F | Live Oak Private Wealth LLC | 54 884 | 0,00 | 290 | 2,47 | ||||
| 2025-08-05 | 13F | Tsfg, Llc | 1 500 | 0,00 | 0 | |||||
| 2025-05-06 | 13F | Readystate Asset Management Lp | 0 | −100,00 | 0 | −100,00 | ||||
| 2025-07-07 | 13F | Centurion Wealth Management LLC | 10 295 | 0,00 | 54 | 10,20 | ||||
| 2025-08-14 | 13F/A | Rockefeller Capital Management L.P. | 199 200 | 33,58 | 1 054 | 36,93 | ||||
| 2025-07-21 | 13F | Quattro Financial Advisors Llc | 40 291 | 0,00 | 213 | 2,90 | ||||
| 2025-08-06 | 13F | Penserra Capital Management LLC | 3 696 579 | 3,05 | 20 | 5,56 |