Grundläggande statistik
| Institutionella ägare | 105 total, 105 long only, 0 short only, 0 long/short - change of −0,94% MRQ |
| Genomsnittlig portföljallokering | 0.3578 % - change of −6,26% MRQ |
| Institutionella aktier (lång) | 6 776 341 (ex 13D/G) - change of 0,36MM shares 5,64% MRQ |
| Institutionellt värde (lång) | $ 401 551 USD ($1000) |
Institutionellt ägande och aktieägare
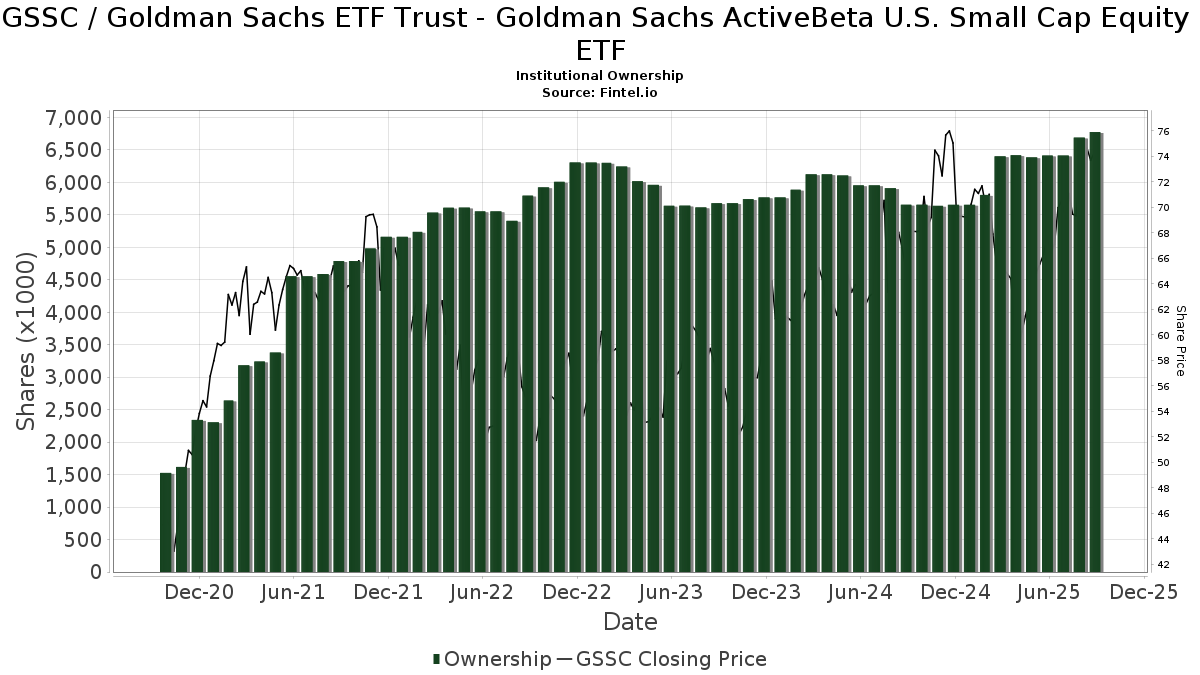
Goldman Sachs ETF Trust - Goldman Sachs ActiveBeta U.S. Small Cap Equity ETF (US:GSSC) har 105 Institutionella ägare och aktieägare som har lämnat in 13D/G- eller 13F-formulär till Securities Exchange Commission (SEC). Dessa institut innehar totalt 6,776,341 aktier. Största aktieägare inkluderar Betterment LLC, LPL Financial LLC, First Foundation Advisors, American National Bank, Bank Of America Corp /de/, Richard P Slaughter Associates Inc, Envestnet Asset Management Inc, Raymond James Financial Inc, Morgan Stanley, and Brinker Capital Investments, LLC .
Goldman Sachs ETF Trust - Goldman Sachs ActiveBeta U.S. Small Cap Equity ETF (ARCA:GSSC) Institutionell ägarstruktur visar institutioners och fonders nuvarande positioner i företaget, samt de senaste förändringarna i positionernas storlek. Större aktieägare kan vara enskilda investerare, fonder, hedgefonder eller institutioner. Bilaga 13D visar att investeraren äger (eller ägde) mer än 5% av företaget och avser (eller avsåg) att aktivt eftersträva en förändring av affärsstrategin. Schedule 13G indikerar en passiv investering på över 5%.
The share price as of September 9, 2025 is 74,34 / share. Previously, on September 10, 2024, the share price was 65,04 / share. This represents an increase of 14,31% over that period.
Fondsentimentets poäng
Fondsentimentet poängen(fka Ägarackumulation-poäng) visar vilka aktier som är mest köpta av fonder. Det är resultatet av en sofistikerad kvantitativ flerfaktormodell som identifierar företag med de högsta nivåerna av institutionell ackumulering. Poängsättningsmodellen använder en kombination av den totala ökningen av redovisade ägare, förändringarna i portföljallokeringarna för dessa ägare och andra mått. Siffran sträcker sig från 0 till 100, där högre siffror indikerar en högre nivå av ackumulering i förhållande till sina konkurrenter, och 50 är genomsnittet.
Uppdateringsfrekvens: Dagligen
Se Ownership Explorer, som innehåller en lista över de högst rankade företagen.
Institutionell sälj/köp-kvot
Förutom att rapportera vanliga eget kapital- och skuldemissioner måste institutioner med mer än 100MM tillgångar under förvaltning också avslöja sina innehav av sälj- och köpoptioner. Eftersom säljoptioner i allmänhet indikerar ett negativt sentiment och köpoptioner indikerar ett positivt sentiment, kan vi få en uppfattning om det övergripande institutionella sentimentet genom att plotta förhållandet mellan säljoptioner och köpoptioner. Diagrammet till höger visar det historiska förhållandet mellan sälj- och köpoptioner för detta instrument.
Genom att använda sälj/köp-kvoten som en indikator på aktieägarnas sentiment undviker man en av de största bristerna med att använda det totala institutionella ägandet, nämligen att en betydande del av de förvaltade tillgångarna investeras passivt för att följa index. Passivt förvaltade fonder köper vanligtvis inte optioner, så indikatorn för sälj/köp-kvoten ger en bättre bild av stämningen i aktivt förvaltade fonder.
13F- och NPORT-arkiveringar
Detaljer om 13F-arkiveringar är gratis. Detaljer om NP-arkiveringar kräver ett premiummedlemskap. Gröna rader indikerar nya positioner. Röda rader indikerar stängda positioner. Klicka på länk symbolen för att se hela transaktionshistoriken.
Uppgradera
för att låsa upp premiumdata och exportera till Excel ![]() .
.
| Fil Datum | Källa | Investerare | Typ | Genomsnittligt pris (beräknat) |
Aktier | Δ Aktier (%) |
Rapporterat värde (1000 USD) |
Δ Värde (%) |
Portföljallokering (%) |
|
|---|---|---|---|---|---|---|---|---|---|---|
| 2025-08-11 | 13F | Blue Bell Private Wealth Management, Llc | 16 | 0,00 | 1 | 0,00 | ||||
| 2025-07-17 | 13F | HB Wealth Management, LLC | 21 190 | 0,00 | 1 454 | 8,11 | ||||
| 2025-08-13 | 13F | Lido Advisors, LLC | 7 752 | 0,00 | 532 | 8,15 | ||||
| 2025-08-13 | 13F | Maia Wealth LLC | 5 844 | −1,96 | 401 | 13,31 | ||||
| 2025-08-11 | 13F | Principal Securities, Inc. | 90 763 | 12,88 | 6 227 | 12,04 | ||||
| 2025-08-12 | 13F | Segall Bryant & Hamill, Llc | 0 | −100,00 | 0 | |||||
| 2025-07-10 | 13F | Sovran Advisors, LLC | 9 255 | −3,56 | 648 | 14,49 | ||||
| 2025-07-29 | 13F | Stephens Inc /ar/ | 28 190 | 0,00 | 1 934 | 8,17 | ||||
| 2025-08-13 | 13F | EverSource Wealth Advisors, LLC | 381 | 0,26 | 26 | 8,33 | ||||
| 2025-07-31 | 13F | Wealthfront Advisers Llc | 11 155 | −18,19 | 765 | −11,46 | ||||
| 2025-08-05 | 13F | Bank of New York Mellon Corp | 7 097 | 4,74 | 487 | 13,29 | ||||
| 2025-07-09 | 13F | Dynamic Advisor Solutions LLC | 39 166 | −21,64 | 2 687 | −15,24 | ||||
| 2025-08-07 | 13F | SFE Investment Counsel | 0 | −100,00 | 0 | |||||
| 2025-08-14 | 13F | First Foundation Advisors | 564 889 | −5,38 | 38 757 | 2,34 | ||||
| 2025-07-08 | 13F | Richard P Slaughter Associates Inc | 298 022 | −6,21 | 20 447 | 1,45 | ||||
| 2025-07-21 | 13F | Quent Capital, LLC | 0 | −100,00 | 0 | |||||
| 2025-07-15 | 13F | McCarthy & Cox | 144 227 | 3,63 | 9 895 | 12,10 | ||||
| 2025-07-17 | 13F | Fifth Third Securities, Inc. | 8 198 | −13,08 | 562 | −6,02 | ||||
| 2025-07-14 | 13F | Gries Financial Llc | 3 029 | 208 | ||||||
| 2025-05-15 | 13F | Stonehaven Wealth & Tax Solutions, Llc | 0 | −100,00 | 0 | |||||
| 2025-08-11 | 13F | TD Waterhouse Canada Inc. | 0 | −100,00 | 0 | |||||
| 2025-07-31 | 13F | CNB Bank | 170 | 0,00 | 12 | 10,00 | ||||
| 2025-08-14 | 13F | Glenview Trust Co | 11 630 | −0,03 | 798 | 8,14 | ||||
| 2025-08-11 | 13F | Citigroup Inc | 2 | 0 | ||||||
| 2025-08-14 | 13F | Bank Of America Corp /de/ | 316 676 | −2,39 | 21 727 | 5,59 | ||||
| 2025-07-28 | 13F | Mutual Advisors, LLC | 4 079 | −8,54 | 286 | 4,76 | ||||
| 2025-08-14 | 13F | Integrated Wealth Concepts LLC | 3 810 | 4,01 | 261 | 12,50 | ||||
| 2025-08-07 | 13F | Verus Capital Partners, Llc | 24 870 | 1 706 | ||||||
| 2025-08-14 | 13F | Susquehanna International Group, Llp | 0 | −100,00 | 0 | |||||
| 2025-07-11 | 13F/A | Umb Bank N A/mo | 116 | −54,86 | 8 | −56,25 | ||||
| 2025-07-24 | 13F | Louisbourg Investments Inc. | 30 | 0,00 | 2 | 100,00 | ||||
| 2025-07-25 | 13F | Envestnet Portfolio Solutions, Inc. | 39 010 | −0,49 | 2 676 | 7,64 | ||||
| 2025-08-06 | 13F | AE Wealth Management LLC | 43 | 59,26 | 3 | 100,00 | ||||
| 2025-08-11 | 13F | Paul R. Ried Financial Group, LLC | 164 732 | −18,41 | 11 302 | −11,75 | ||||
| 2025-08-15 | 13F | Morgan Stanley | 178 181 | 11,99 | 12 225 | 21,14 | ||||
| 2025-08-07 | 13F | Vise Technologies, Inc. | 0 | −100,00 | 0 | |||||
| 2025-07-31 | 13F | Hixon Zuercher, LLC | 38 609 | −17,74 | 2 649 | −11,05 | ||||
| 2025-07-21 | 13F | Ameritas Advisory Services, LLC | 649 | 45 | ||||||
| 2025-04-30 | 13F | Axxcess Wealth Management, Llc | 0 | −100,00 | 0 | |||||
| 2025-08-14 | 13F | LifePlan Investment Advisors, Inc. | 6 380 | 39,82 | 438 | 51,21 | ||||
| 2025-05-16 | 13F | Coppell Advisory Solutions LLC | 0 | −100,00 | 0 | |||||
| 2025-08-14 | 13F | Comerica Bank | 194 | 0,00 | 13 | 8,33 | ||||
| 2025-08-04 | 13F | Linscomb & Williams, Inc. | 48 556 | 5,49 | 3 331 | 14,11 | ||||
| 2025-08-14 | 13F | Fmr Llc | 917 | −34,17 | 63 | −29,55 | ||||
| 2025-08-04 | 13F | Kovack Advisors, Inc. | 3 000 | 206 | ||||||
| 2025-07-23 | 13F | Heck Capital Advisors, LLC | 168 642 | 0,05 | 11 571 | 8,22 | ||||
| 2025-08-01 | 13F | Strategic Financial Services, Inc, | 105 706 | 79,39 | 7 252 | 94,06 | ||||
| 2025-08-12 | 13F | Jpmorgan Chase & Co | 161 | 0,00 | 11 | 10,00 | ||||
| 2025-08-07 | 13F | CENTRAL TRUST Co | 25 636 | −16,36 | 1 759 | −9,57 | ||||
| 2025-07-29 | NP | EBI - Longview Advantage ETF | 0 | −100,00 | 0 | −100,00 | ||||
| 2025-08-14 | 13F | Betterment LLC | 762 667 | 27,97 | 52 | 40,54 | ||||
| 2025-07-22 | 13F | Miracle Mile Advisors, LLC | 6 484 | −42,69 | 445 | −38,08 | ||||
| 2025-08-14 | 13F | Raymond James Financial Inc | 231 414 | 12,02 | 15 877 | 21,17 | ||||
| 2025-09-04 | 13F/A | Advisor Group Holdings, Inc. | 50 258 | 280,14 | 3 448 | 311,46 | ||||
| 2025-05-06 | 13F | Venturi Wealth Management, LLC | 0 | −100,00 | 0 | |||||
| 2025-08-14 | 13F | Two Sigma Investments, Lp | 0 | −100,00 | 0 | |||||
| 2025-04-22 | 13F | Private Wealth Partners, LLC | 0 | −100,00 | 0 | |||||
| 2025-08-27 | 13F/A | Brinker Capital Investments, LLC | 177 845 | 0,18 | 12 202 | 8,36 | ||||
| 2025-05-15 | 13F | Citadel Advisors Llc | 0 | −100,00 | 0 | |||||
| 2025-08-11 | 13F | Private Advisor Group, LLC | 21 427 | −9,80 | 1 470 | −2,39 | ||||
| 2025-08-12 | 13F | Proequities, Inc. | 0 | 0 | ||||||
| 2025-08-12 | 13F | O'shaughnessy Asset Management, Llc | 94 | 46,88 | 6 | 50,00 | ||||
| 2025-07-28 | 13F | Morris Financial Concepts, Inc. | 3 545 | −23,98 | 243 | −17,63 | ||||
| 2025-07-21 | 13F | Financial Architects, LLC | 170 750 | −2,23 | 11 715 | 5,75 | ||||
| 2025-07-21 | 13F | Monticello Wealth Management, Llc | 143 342 | −2,12 | 9 835 | 5,87 | ||||
| 2025-08-11 | 13F | Aptus Capital Advisors, LLC | 992 | 0,00 | 68 | 9,68 | ||||
| 2025-07-28 | 13F | Harbour Investments, Inc. | 665 | −11,33 | 46 | −4,26 | ||||
| 2025-08-11 | 13F | HHM Wealth Advisors, LLC | 196 | −40,24 | 13 | −35,00 | ||||
| 2025-05-15 | 13F/A | Orion Portfolio Solutions, LLC | 177 532 | 1,74 | 11 261 | −6,65 | ||||
| 2025-08-12 | 13F | Steward Partners Investment Advisory, Llc | 408 | 0,00 | 28 | 8,00 | ||||
| 2025-07-24 | 13F | Blair William & Co/il | 218 | 0,00 | 15 | 7,69 | ||||
| 2025-07-24 | 13F | IFP Advisors, Inc | 173 626 | 4,10 | 11 913 | 12,60 | ||||
| 2025-05-01 | 13F | Freedom Day Solutions, LLC | 0 | −100,00 | 0 | −100,00 | ||||
| 2025-07-11 | 13F | Spence Asset Management | 38 107 | 4,20 | 3 | 0,00 | ||||
| 2025-08-14 | 13F | GWM Advisors LLC | 6 937 | 8,83 | 476 | 17,57 | ||||
| 2025-07-10 | 13F | Community Trust & Investment Co | 3 866 | 0,00 | 265 | 8,16 | ||||
| 2025-08-15 | 13F | CI Private Wealth, LLC | 10 947 | −19,08 | 751 | −12,47 | ||||
| 2025-07-24 | 13F | Us Bancorp \de\ | 33 | 0,00 | 2 | 0,00 | ||||
| 2025-08-04 | 13F | Great Lakes Retirement, Inc. | 109 821 | −39,21 | 7 535 | −34,25 | ||||
| 2025-07-22 | 13F/A | Duncan Williams Asset Management, LLC | 134 394 | 420,79 | 9 221 | 463,57 | ||||
| 2025-08-21 | 13F | Aveo Capital Partners, LLC | 0 | −100,00 | 0 | |||||
| 2025-07-25 | 13F | Cwm, Llc | 50 | 0 | ||||||
| 2025-08-12 | 13F | MAI Capital Management | 1 813 | 0,00 | 124 | 8,77 | ||||
| 2025-07-30 | 13F | Syntegra Private Wealth Group, LLC | 17 104 | 1 174 | ||||||
| 2025-07-14 | 13F | U.S. Capital Wealth Advisors, LLC | 3 240 | 0,00 | 222 | 8,29 | ||||
| 2025-07-10 | 13F | Wealth Enhancement Advisory Services, Llc | 30 842 | −35,63 | 2 179 | −28,33 | ||||
| 2025-04-21 | 13F | Nelson, Van Denburg & Campbell Wealth Management Group, LLC | 0 | −100,00 | 0 | |||||
| 2025-08-14 | 13F | Wells Fargo & Company/mn | 391 | 551,67 | 27 | 766,67 | ||||
| 2025-08-04 | 13F | Creative Financial Designs Inc /adv | 8 | 1 | ||||||
| 2025-08-12 | 13F | Gladstone Institutional Advisory LLC | 15 486 | 6,67 | 1 062 | 15,43 | ||||
| 2025-08-13 | 13F | Northwestern Mutual Wealth Management Co | 42 | 0,00 | 3 | 0,00 | ||||
| 2025-08-06 | 13F | Commonwealth Equity Services, Llc | 107 352 | 4,42 | 7 | 16,67 | ||||
| 2025-08-05 | 13F | Bank Of Montreal /can/ | 50 | 0,00 | 3 | 0,00 | ||||
| 2025-08-14 | 13F | CoreCap Advisors, LLC | 38 121 | 1,74 | 2 616 | 10,06 | ||||
| 2025-07-23 | 13F | Sax Wealth Advisors, Llc | 3 590 | 246 | ||||||
| 2025-08-15 | 13F | Equitable Holdings, Inc. | 0 | −100,00 | 0 | |||||
| 2025-05-14 | 13F | Ameriprise Financial Inc | 0 | −100,00 | 0 | −100,00 | ||||
| 2025-08-12 | 13F | Coldstream Capital Management Inc | 0 | −100,00 | 0 | |||||
| 2025-08-12 | 13F | Global Retirement Partners, LLC | 2 785 | −73,61 | 191 | −73,80 | ||||
| 2025-08-06 | 13F | Ethos Financial Group, LLC | 3 047 | 209 | ||||||
| 2025-08-08 | 13F | Cetera Investment Advisers | 121 886 | 3,78 | 8 363 | 12,26 | ||||
| 2025-05-07 | 13F | WMS Partners, LLC | 0 | −100,00 | 0 | |||||
| 2025-08-01 | 13F | Envestnet Asset Management Inc | 290 428 | 8,10 | 19 926 | 16,93 | ||||
| 2025-08-12 | 13F | LPL Financial LLC | 647 204 | 5,03 | 44 405 | 13,60 | ||||
| 2025-08-14 | 13F | Goldman Sachs Group Inc | 12 406 | −0,59 | 851 | 7,59 | ||||
| 2025-07-08 | 13F | Apella Capital, LLC | 3 549 | 0,14 | 247 | 15,49 | ||||
| 2025-07-16 | 13F | American National Bank | 460 771 | −8,21 | 31 613 | −0,71 | ||||
| 2025-08-12 | 13F | SRS Capital Advisors, Inc. | 0 | −100,00 | 0 | |||||
| 2025-08-14 | 13F | Royal Bank Of Canada | 90 047 | 5,66 | 6 178 | 14,30 | ||||
| 2025-08-14 | 13F | UBS Group AG | 133 | −96,44 | 9 | −96,20 | ||||
| 2025-07-24 | 13F | Edge Financial Advisors LLC | 3 653 | −25,14 | 253 | −18,45 | ||||
| 2025-08-18 | 13F | Hollencrest Capital Management | 29 | 2 | ||||||
| 2025-08-07 | 13F | Allworth Financial LP | 303 | 0,00 | 21 | 11,11 | ||||
| 2025-08-14 | 13F | Smartleaf Asset Management LLC | 0 | −100,00 | 0 | |||||
| 2025-07-29 | 13F | Private Trust Co Na | 599 | 49,75 | 41 | 64,00 | ||||
| 2025-08-13 | 13F | Russell Investments Group, Ltd. | 49 | −78,22 | 3 | −78,57 | ||||
| 2025-07-17 | 13F | Wagner Wealth Management, Llc | 2 | 0,00 | 0 | |||||
| 2025-08-12 | 13F | Ameritas Investment Partners, Inc. | 36 | 2 | ||||||
| 2025-08-08 | 13F | Crossmark Global Holdings, Inc. | 29 945 | 2,67 | 2 051 | 10,99 | ||||
| 2025-08-18 | 13F | Tyler-Stone Wealth Management | 3 600 | −23,40 | 247 | −17,45 | ||||
| 2025-07-25 | 13F | PrairieView Partners, LLC | 11 | 0,00 | 0 | |||||
| 2025-08-12 | 13F | Inscription Capital, LLC | 0 | −100,00 | 0 | |||||
| 2025-07-30 | 13F | Gables Capital Management Inc. | 6 | 0,00 | 0 | |||||
| 2025-07-09 | 13F | High Probability Advisors, LLC | 148 937 | 14,48 | 10 219 | 23,82 | ||||
| 2025-05-12 | 13F | Independent Advisor Alliance | 0 | −100,00 | 0 | |||||
| 2025-07-29 | 13F | Aire Advisors, Llc | 5 000 | 0,00 | 343 | 8,20 | ||||
| 2025-08-12 | 13F | Change Path, LLC | 12 955 | −12,23 | 889 | −5,13 | ||||
| 2025-05-07 | 13F | David R. Rahn & Associates Inc. | 0 | −100,00 | 0 | |||||
| 2025-07-08 | 13F | Nbc Securities, Inc. | 3 493 | 0,00 | 0 | |||||
| 2025-08-11 | 13F | Bell Investment Advisors, Inc | 96 836 | 11,12 | 6 644 | 20,19 | ||||
| 2025-08-14 | 13F | Keebeck Wealth Management, LLC | 9 698 | 665 | ||||||
| 2025-07-25 | 13F | Atria Wealth Solutions, Inc. | 4 303 | −55,39 | 295 | −51,72 |