Grundläggande statistik
| Institutionella ägare | 143 total, 143 long only, 0 short only, 0 long/short - change of 37,50% MRQ |
| Genomsnittlig portföljallokering | 0.6605 % - change of −12,59% MRQ |
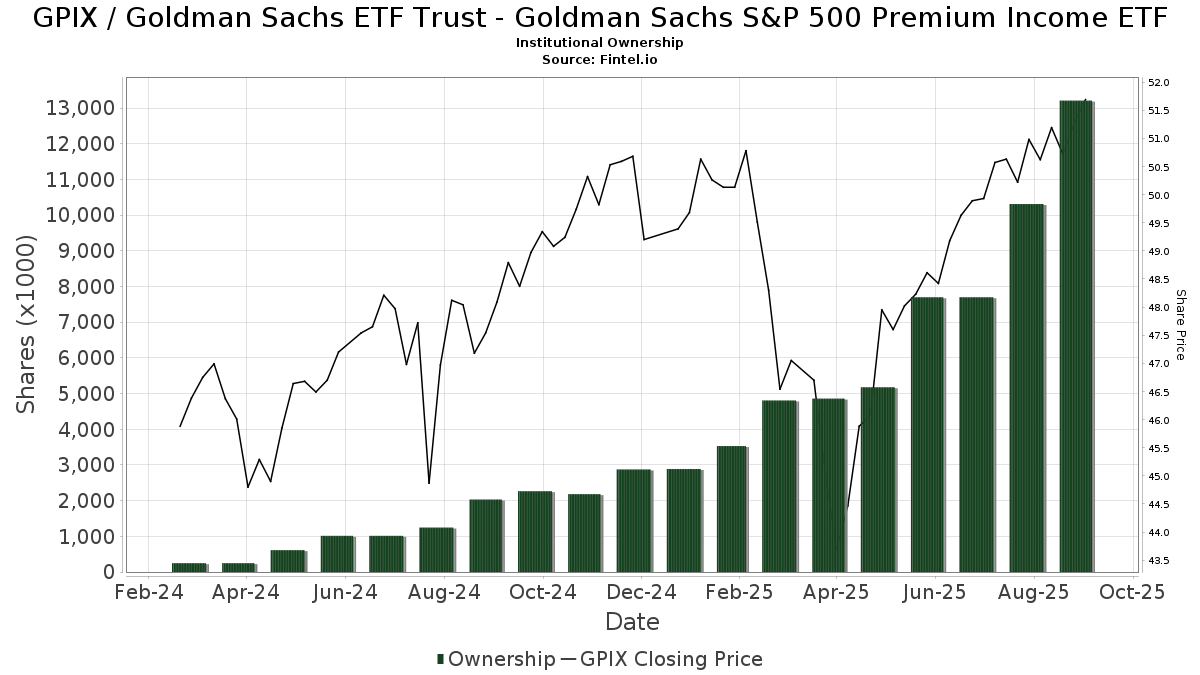
| Institutionella aktier (lång) | 13 211 219 (ex 13D/G) - change of 5,51MM shares 71,57% MRQ |
| Institutionellt värde (lång) | $ 650 333 USD ($1000) |
Institutionellt ägande och aktieägare
Goldman Sachs ETF Trust - Goldman Sachs S&P 500 Premium Income ETF (US:GPIX) har 143 Institutionella ägare och aktieägare som har lämnat in 13D/G- eller 13F-formulär till Securities Exchange Commission (SEC). Dessa institut innehar totalt 13,211,219 aktier. Största aktieägare inkluderar LPL Financial LLC, HighTower Advisors, LLC, Requisite Capital Management, LLC, Cornerstone Advisory, LLC, Bank Of America Corp /de/, Eaton Financial Holdings Company, LLC, McCarthy & Cox, Royal Bank Of Canada, Graney & King, LLC, and SK Wealth Management, LLC .
Goldman Sachs ETF Trust - Goldman Sachs S&P 500 Premium Income ETF (NasdaqGM:GPIX) Institutionell ägarstruktur visar institutioners och fonders nuvarande positioner i företaget, samt de senaste förändringarna i positionernas storlek. Större aktieägare kan vara enskilda investerare, fonder, hedgefonder eller institutioner. Bilaga 13D visar att investeraren äger (eller ägde) mer än 5% av företaget och avser (eller avsåg) att aktivt eftersträva en förändring av affärsstrategin. Schedule 13G indikerar en passiv investering på över 5%.
The share price as of September 15, 2025 is 51,76 / share. Previously, on September 16, 2024, the share price was 48,16 / share. This represents an increase of 7,48% over that period.
Fondsentimentets poäng
Fondsentimentet poängen(fka Ägarackumulation-poäng) visar vilka aktier som är mest köpta av fonder. Det är resultatet av en sofistikerad kvantitativ flerfaktormodell som identifierar företag med de högsta nivåerna av institutionell ackumulering. Poängsättningsmodellen använder en kombination av den totala ökningen av redovisade ägare, förändringarna i portföljallokeringarna för dessa ägare och andra mått. Siffran sträcker sig från 0 till 100, där högre siffror indikerar en högre nivå av ackumulering i förhållande till sina konkurrenter, och 50 är genomsnittet.
Uppdateringsfrekvens: Dagligen
Se Ownership Explorer, som innehåller en lista över de högst rankade företagen.
Institutionell sälj/köp-kvot
Förutom att rapportera vanliga eget kapital- och skuldemissioner måste institutioner med mer än 100MM tillgångar under förvaltning också avslöja sina innehav av sälj- och köpoptioner. Eftersom säljoptioner i allmänhet indikerar ett negativt sentiment och köpoptioner indikerar ett positivt sentiment, kan vi få en uppfattning om det övergripande institutionella sentimentet genom att plotta förhållandet mellan säljoptioner och köpoptioner. Diagrammet till höger visar det historiska förhållandet mellan sälj- och köpoptioner för detta instrument.
Genom att använda sälj/köp-kvoten som en indikator på aktieägarnas sentiment undviker man en av de största bristerna med att använda det totala institutionella ägandet, nämligen att en betydande del av de förvaltade tillgångarna investeras passivt för att följa index. Passivt förvaltade fonder köper vanligtvis inte optioner, så indikatorn för sälj/köp-kvoten ger en bättre bild av stämningen i aktivt förvaltade fonder.
13F- och NPORT-arkiveringar
Detaljer om 13F-arkiveringar är gratis. Detaljer om NP-arkiveringar kräver ett premiummedlemskap. Gröna rader indikerar nya positioner. Röda rader indikerar stängda positioner. Klicka på länk symbolen för att se hela transaktionshistoriken.
Uppgradera
för att låsa upp premiumdata och exportera till Excel ![]() .
.
| Fil Datum | Källa | Investerare | Typ | Genomsnittligt pris (beräknat) |
Aktier | Δ Aktier (%) |
Rapporterat värde (1000 USD) |
Δ Värde (%) |
Portföljallokering (%) |
|
|---|---|---|---|---|---|---|---|---|---|---|
| 2025-07-28 | 13F | Elmwood Wealth Management, Inc. | 76 885 | −7,60 | 3 830 | −1,24 | ||||
| 2025-08-01 | 13F | Private Wealth Partners, LLC | 72 754 | 30,49 | 3 625 | 39,49 | ||||
| 2025-07-22 | 13F | Chung Wu Investment Group, LLC | 25 460 | −12,36 | 1 268 | −6,35 | ||||
| 2025-07-15 | 13F | Eaton Financial Holdings Company, LLC | 501 313 | 43,85 | 24 975 | 53,76 | ||||
| 2025-07-17 | 13F | Forefront Wealth Management Inc. | 41 032 | −56,29 | 2 044 | −53,28 | ||||
| 2025-08-14 | 13F | RMB Capital Management, LLC | 17 646 | 0,44 | 879 | 7,46 | ||||
| 2025-08-11 | 13F | Principal Securities, Inc. | 135 | 7 | ||||||
| 2025-08-13 | 13F | Cerity Partners LLC | 6 967 | 347 | ||||||
| 2025-08-14 | 13F | Stifel Financial Corp | 54 965 | 17,02 | 2 738 | 25,08 | ||||
| 2025-08-14 | 13F | Herold Advisors, Inc. | 5 888 | 293 | ||||||
| 2025-07-25 | 13F | Ellis Investment Partners, LLC | 42 685 | 711,19 | 2 127 | 767,76 | ||||
| 2025-08-07 | 13F | David R. Rahn & Associates Inc. | 55 166 | 1,84 | 2 748 | 8,87 | ||||
| 2025-07-17 | 13F | LexAurum Advisors, LLC | 14 666 | 6,14 | 731 | 13,35 | ||||
| 2025-07-15 | 13F | Graypoint LLC | 78 344 | 3 903 | ||||||
| 2025-07-18 | 13F | Requisite Capital Management, LLC | 1 356 462 | 67 579 | ||||||
| 2025-07-22 | 13F | Wealthcare Advisory Partners LLC | 74 372 | 5,40 | 3 705 | 12,68 | ||||
| 2025-07-09 | 13F | Dynamic Advisor Solutions LLC | 11 557 | 156,65 | 576 | 175,12 | ||||
| 2025-08-07 | 13F | American Alpha Advisors, LLC | 102 810 | 5 122 | ||||||
| 2025-08-13 | 13F | Cary Street Partners Financial Llc | 11 546 | 9,51 | 575 | 17,11 | ||||
| 2025-05-14 | 13F | Ameriprise Financial Inc | 0 | −100,00 | 0 | |||||
| 2025-08-19 | 13F | Advisory Services Network, LLC | 0 | −100,00 | 0 | |||||
| 2025-08-01 | 13F | Pasadena Private Wealth, LLC | 7 465 | 12,85 | 372 | 20,45 | ||||
| 2025-08-11 | 13F | Semus Wealth Partners LLC | 55 982 | 6,23 | 2 789 | 13,56 | ||||
| 2025-07-31 | 13F | Richards, Merrill & Peterson, Inc. | 0 | −100,00 | 0 | |||||
| 2025-08-06 | 13F | Founders Financial Securities Llc | 48 711 | 2,59 | 2 427 | 11,90 | ||||
| 2025-07-21 | 13F | Jmac Enterprises Llc | 189 347 | 51,77 | 9 433 | 62,22 | ||||
| 2025-07-29 | 13F | Private Trust Co Na | 1 100 | 0,00 | 55 | 5,88 | ||||
| 2025-07-30 | 13F | Prosperity Financial Group, Inc. | 49 229 | 9,21 | 2 453 | 16,71 | ||||
| 2025-07-15 | 13F | McCarthy & Cox | 389 310 | 13,72 | 19 395 | 21,55 | ||||
| 2025-08-08 | 13F | CFO4Life Group, LLC | 6 766 | 44,11 | 337 | 54,59 | ||||
| 2025-08-12 | 13F | RiverFront Investment Group, LLC | 33 558 | 66,51 | 1 672 | 77,96 | ||||
| 2025-08-14 | 13F | Jupiter Wealth Management LLC | 5 889 | 0,00 | 300 | 5,26 | ||||
| 2025-07-30 | 13F | Strategic Blueprint, LLC | 8 982 | 447 | ||||||
| 2025-08-12 | 13F | LPL Financial LLC | 1 745 651 | 33,16 | 86 968 | 42,33 | ||||
| 2025-07-18 | 13F | Truist Financial Corp | 48 368 | 2 410 | ||||||
| 2025-08-14 | 13F | Bank Of America Corp /de/ | 769 371 | 38 330 | ||||||
| 2025-08-05 | 13F | Bank of New York Mellon Corp | 273 625 | 13 632 | ||||||
| 2025-08-11 | 13F | Cannon Advisors, Inc. | 56 478 | 60,70 | 2 814 | 71,73 | ||||
| 2025-08-14 | 13F | Fort Point Capital Partners LLC | 7 910 | 23,40 | 394 | 32,21 | ||||
| 2025-08-14 | 13F | Citadel Advisors Llc | 4 445 | 221 | ||||||
| 2025-08-12 | 13F | Jpmorgan Chase & Co | 0 | −100,00 | 0 | |||||
| 2025-08-01 | 13F | Delta Investment Management, LLC | 41 984 | 11,22 | 2 092 | 18,87 | ||||
| 2025-07-25 | 13F | Envestnet Portfolio Solutions, Inc. | 129 069 | 6 430 | ||||||
| 2025-07-16 | 13F | Perigon Wealth Management, LLC | 43 522 | 87,89 | 2 168 | 100,93 | ||||
| 2025-08-14 | 13F | Visionary Wealth Advisors | 0 | −100,00 | 0 | |||||
| 2025-08-15 | 13F | Captrust Financial Advisors | 50 765 | 18,31 | 2 529 | 26,51 | ||||
| 2025-08-14 | 13F | Betterment LLC | 4 277 | −28,48 | 0 | |||||
| 2025-08-04 | 13F | FRG Family Wealth Advisors LLC | 18 435 | −4,70 | 918 | 1,89 | ||||
| 2025-08-14 | 13F | Great Valley Advisor Group, Inc. | 13 130 | 73,95 | 654 | 86,32 | ||||
| 2025-08-14 | 13F | White Knight Strategic Wealth Advisors, LLC | 15 360 | 7,16 | 765 | 14,52 | ||||
| 2025-08-11 | 13F | Pin Oak Investment Advisors Inc | 0 | −100,00 | 0 | |||||
| 2025-07-10 | 13F | Financial Management Network Inc | 19 127 | 3,24 | 955 | 21,84 | ||||
| 2025-08-14 | 13F | Susquehanna International Group, Llp | 134 457 | 239,83 | 6 699 | 263,23 | ||||
| 2025-07-29 | 13F | Balboa Wealth Partners | 7 470 | 3,03 | 372 | 10,39 | ||||
| 2025-07-29 | 13F | Fundamentun, Llc | 12 188 | 607 | ||||||
| 2025-08-14 | 13F/A | Rockefeller Capital Management L.P. | 12 678 | 632 | ||||||
| 2025-07-18 | 13F | Parsons Capital Management Inc/ri | 6 280 | −5,99 | 313 | 0,32 | ||||
| 2025-08-12 | 13F | Proequities, Inc. | 0 | 0 | ||||||
| 2025-07-07 | 13F | Thurston, Springer, Miller, Herd & Titak, Inc. | 3 040 | 151 | ||||||
| 2025-08-04 | 13F | Daymark Wealth Partners, Llc | 4 396 | 219 | ||||||
| 2025-07-08 | 13F | Next Level Private LLC | 13 820 | −32,61 | 688 | −27,96 | ||||
| 2025-08-12 | 13F | Cornerstone Wealth Management, LLC | 5 681 | 0,74 | 283 | 8,02 | ||||
| 2025-09-04 | 13F/A | Advisor Group Holdings, Inc. | 115 986 | 18,97 | 5 779 | 27,10 | ||||
| 2025-07-10 | 13F | Wealth Enhancement Advisory Services, Llc | 57 475 | 31,50 | 2 869 | 40,80 | ||||
| 2025-08-14 | 13F | Warren Averett Asset Management, LLC | 9 680 | 482 | ||||||
| 2025-08-13 | 13F | BlackDiamond Wealth Management Inc. | 5 481 | −6,86 | 271 | −0,37 | ||||
| 2025-08-11 | 13F | Private Advisor Group, LLC | 23 174 | −65,07 | 1 155 | −62,68 | ||||
| 2025-08-15 | 13F | Synergy Financial Group, LTD | 14 443 | −9,83 | 720 | −3,62 | ||||
| 2025-07-02 | 13F | Waller Financial Planning Group, Inc | 6 809 | 339 | ||||||
| 2025-08-14 | 13F | Horizon Investments, LLC | 50 607 | 2 486 | ||||||
| 2025-08-12 | 13F | Jacobi Capital Management LLC | 4 225 | 210 | ||||||
| 2025-08-26 | 13F | Nautilus Advisors LLC | 5 820 | −29,71 | 290 | −24,94 | ||||
| 2025-07-22 | 13F | DAVENPORT & Co LLC | 58 625 | 24,67 | 2 921 | 33,27 | ||||
| 2025-07-31 | 13F | CAP Partners, LLC | 21 791 | 23,70 | 1 086 | 32,16 | ||||
| 2025-08-19 | 13F | Newbridge Financial Services Group, Inc. | 3 189 | −30,85 | 159 | −26,17 | ||||
| 2025-07-23 | 13F | Castle Rock Wealth Management, LLC | 29 782 | 17,55 | 1 500 | 27,77 | ||||
| 2025-07-24 | 13F | Ulland Investment Advisors, LLC | 12 980 | 464,35 | 1 | |||||
| 2025-08-05 | 13F | Mission Wealth Management, Lp | 128 534 | 6 404 | ||||||
| 2025-08-14 | 13F | Raymond James Financial Inc | 31 663 | 1 577 | ||||||
| 2025-08-15 | 13F | Equitable Holdings, Inc. | 162 054 | 171,27 | 8 074 | 189,98 | ||||
| 2025-07-14 | 13F | Park Avenue Securities Llc | 5 299 | −3,64 | 0 | |||||
| 2025-07-17 | 13F | KWB Wealth | 5 820 | 271 | ||||||
| 2025-07-29 | 13F | Stratos Wealth Partners, LTD. | 15 696 | 782 | ||||||
| 2025-08-05 | 13F | Greater Midwest Financial Group, LLC | 0 | −100,00 | 0 | |||||
| 2025-08-12 | 13F | Steward Partners Investment Advisory, Llc | 12 232 | 36,64 | 609 | 46,04 | ||||
| 2025-08-13 | 13F | Quadrature Capital Ltd | 4 300 | 214 | ||||||
| 2025-08-14 | 13F | First Commonwealth Financial Corp /pa/ | 0 | −100,00 | 0 | |||||
| 2025-07-15 | 13F | Regatta Capital Group, Llc | 5 755 | 287 | ||||||
| 2025-08-13 | 13F | Jones Financial Companies Lllp | 200 | 10 | ||||||
| 2025-07-29 | 13F | Latitude Advisors, LLC | 4 288 | 214 | ||||||
| 2025-08-15 | 13F | Morgan Stanley | 32 | 0,00 | 2 | 0,00 | ||||
| 2025-08-06 | 13F | Moors & Cabot, Inc. | 17 738 | −19,56 | 884 | −14,02 | ||||
| 2025-08-14 | 13F | GWM Advisors LLC | 8 931 | −84,58 | 445 | −83,54 | ||||
| 2025-07-28 | 13F | Sagespring Wealth Partners, Llc | 80 443 | 4 008 | ||||||
| 2025-08-08 | 13F | Thoroughbred Financial Services, Llc | 12 050 | 1 | ||||||
| 2025-08-15 | 13F | Kestra Advisory Services, LLC | 24 788 | 1 235 | ||||||
| 2025-07-21 | 13F | Investment Planning Advisors, Inc. | 24 733 | 7,23 | 1 232 | 14,60 | ||||
| 2025-07-03 | 13F | Collective Family Office Llc | 12 871 | 2,98 | 641 | 10,14 | ||||
| 2025-07-10 | 13F | Fortress Wealth Management, Inc. | 24 118 | 0,08 | 1 202 | 6,95 | ||||
| 2025-08-14 | 13F | Mariner, LLC | 45 528 | −49,59 | 2 268 | −46,12 | ||||
| 2025-07-24 | 13F | Us Bancorp \de\ | 3 631 | 52,88 | 181 | 63,64 | ||||
| 2025-07-11 | 13F | Seacrest Wealth Management, Llc | 10 367 | 516 | ||||||
| 2025-08-04 | 13F | Whalen Wealth Management Inc. | 47 654 | 2 374 | ||||||
| 2025-07-18 | 13F | Childress Capital Advisors, Llc | 93 069 | 149,51 | 4 637 | 166,74 | ||||
| 2025-07-10 | 13F | High Net Worth Advisory Group LLC | 13 499 | 6,29 | 673 | 13,71 | ||||
| 2025-08-06 | 13F | Commonwealth Equity Services, Llc | 78 224 | −80,84 | 4 | −84,21 | ||||
| 2025-08-13 | 13F | B&D White Capital Company, LLC | 172 332 | 8 586 | ||||||
| 2025-07-17 | 13F | Wolff Wiese Magana Llc | 185 | 9 | ||||||
| 2025-08-11 | 13F | HighTower Advisors, LLC | 1 673 352 | 111,52 | 83 366 | 126,08 | ||||
| 2025-08-14 | 13F | Wick Capital Partners, LLC | 3 429 | −82,29 | 4 524 | 401,44 | ||||
| 2025-08-13 | 13F | Integrity Investment Advisors, LLC | 24 811 | −2,53 | 1 236 | 4,22 | ||||
| 2025-07-24 | 13F | Comprehensive Money Management Services LLC | 5 205 | 259 | ||||||
| 2025-07-24 | 13F | Aurora Private Wealth, Inc. | 83 932 | 5,43 | 4 | 33,33 | ||||
| 2025-07-16 | 13F | Register Financial Advisors LLC | 5 540 | 0,00 | 276 | 6,98 | ||||
| 2025-08-12 | 13F | Gladstone Institutional Advisory LLC | 31 430 | 109,44 | 1 566 | 123,89 | ||||
| 2025-08-14 | 13F | Jane Street Group, Llc | 14 961 | −81,75 | 745 | −80,50 | ||||
| 2025-08-14 | 13F | Wells Fargo & Company/mn | 39 494 | 9,44 | 1 968 | 16,94 | ||||
| 2025-08-11 | 13F | Hexagon Capital Partners LLC | 12 984 | 9,27 | 647 | 16,82 | ||||
| 2025-08-05 | 13F | Aurdan Capital Management, LLC | 26 756 | 1 333 | ||||||
| 2025-07-25 | 13F | Apollon Wealth Management, LLC | 27 592 | 0,00 | 1 375 | 6,84 | ||||
| 2025-08-08 | 13F | Cetera Investment Advisers | 25 766 | 1 284 | ||||||
| 2025-08-05 | 13F | Simplex Trading, Llc | 0 | −100,00 | 0 | |||||
| 2025-08-12 | 13F | Winnow Wealth Llc | 0 | −100,00 | 0 | −100,00 | ||||
| 2025-08-14 | 13F | MidWestOne Financial Group, Inc. | 6 850 | 341 | ||||||
| 2025-08-06 | 13F | Wedbush Securities Inc | 6 781 | 8,98 | 0 | |||||
| 2025-08-14 | 13F | Royal Bank Of Canada | 362 355 | 250,76 | 18 052 | 274,91 | ||||
| 2025-08-12 | 13F | J.w. Cole Advisors, Inc. | 10 031 | 500 | ||||||
| 2025-07-10 | 13F | SK Wealth Management, LLC | 276 514 | 37,29 | 13 795 | 60,30 | ||||
| 2025-08-01 | 13F | Envestnet Asset Management Inc | 264 837 | 13 194 | ||||||
| 2025-08-14 | 13F | Goldman Sachs Group Inc | 34 857 | 1 737 | ||||||
| 2025-08-08 | 13F | Good Life Advisors, LLC | 38 133 | −4,71 | 1 900 | 1,82 | ||||
| 2025-08-13 | 13F | M Holdings Securities, Inc. | 40 318 | 65,70 | 2 | 100,00 | ||||
| 2025-07-22 | 13F | Beacon Financial Advisory LLC | 16 757 | 191,38 | 835 | 211,19 | ||||
| 2025-08-08 | 13F/A | Ignite Planners, LLC | 4 618 | 232 | ||||||
| 2025-08-14 | 13F | Graney & King, LLC | 340 501 | −7,92 | 16 964 | −1,58 | ||||
| 2025-07-28 | 13F | Axxcess Wealth Management, Llc | 0 | −100,00 | 0 | |||||
| 2025-07-08 | 13F/A | Salem Investment Counselors Inc | 2 500 | 85,19 | 125 | 100,00 | ||||
| 2025-08-08 | 13F | Meridian Wealth Management, LLC | 13 304 | 663 | ||||||
| 2025-08-14 | 13F | Mercer Global Advisors Inc /adv | 0 | −100,00 | 0 | |||||
| 2025-07-17 | 13F | Clay Northam Wealth Management, LLC | 26 140 | 8,62 | 1 302 | 16,15 | ||||
| 2025-08-14 | 13F | IHT Wealth Management, LLC | 8 659 | 431 | ||||||
| 2025-07-25 | 13F | We Are One Seven, LLC | 10 420 | −7,65 | 519 | −1,14 | ||||
| 2025-07-24 | 13F | Moseley Investment Management Inc | 7 262 | 4,03 | 362 | 11,08 | ||||
| 2025-07-30 | 13F | Princeton Global Asset Management LLC | 6 815 | 23,57 | 340 | 31,91 | ||||
| 2025-07-31 | 13F | Mason & Associates Inc | 207 975 | −5,73 | 10 361 | 0,76 | ||||
| 2025-08-18 | 13F | Tyler-Stone Wealth Management | 15 989 | −0,03 | 797 | 6,85 | ||||
| 2025-07-24 | 13F | Robertson Stephens Wealth Management, LLC | 0 | −100,00 | 0 | |||||
| 2025-04-17 | 13F | Janney Montgomery Scott LLC | 0 | −100,00 | 0 | |||||
| 2025-07-30 | 13F | Canvas Wealth Advisors, LLC | 11 137 | −14,12 | 565 | −0,53 | ||||
| 2025-07-18 | 13F | Northeast Financial Group, Inc. | 114 551 | 10,25 | 5 707 | 17,84 | ||||
| 2025-08-14 | 13F | Lebenthal Global Advisors, LLC | 13 384 | 667 | ||||||
| 2025-08-07 | 13F | Americana Partners, LLC | 5 313 | 265 | ||||||
| 2025-07-31 | 13F | Whipplewood Advisors, LLC | 7 533 | 2 411,00 | 375 | −57,24 | ||||
| 2025-07-15 | 13F | BKA Wealth Consulting, Inc. | 62 901 | 13,94 | 3 134 | 21,76 | ||||
| 2025-08-12 | 13F | Global Retirement Partners, LLC | 83 516 | 4 161 | ||||||
| 2025-08-04 | 13F | Bay Colony Advisory Group, Inc d/b/a Bay Colony Advisors | 4 108 | 205 | ||||||
| 2025-07-30 | 13F | Cornerstone Advisory, LLC | 973 018 | 10,41 | 48 476 | 19,76 | ||||
| 2025-08-14 | 13F | Vienna Asset Management LLC | 4 270 | 213 |