Grundläggande statistik
| Institutionella ägare | 116 total, 116 long only, 0 short only, 0 long/short - change of −3,28% MRQ |
| Genomsnittlig portföljallokering | 0.0327 % - change of −31,82% MRQ |
| Institutionella aktier (lång) | 10 006 711 (ex 13D/G) - change of −1,55MM shares −13,41% MRQ |
| Institutionellt värde (lång) | $ 144 673 USD ($1000) |
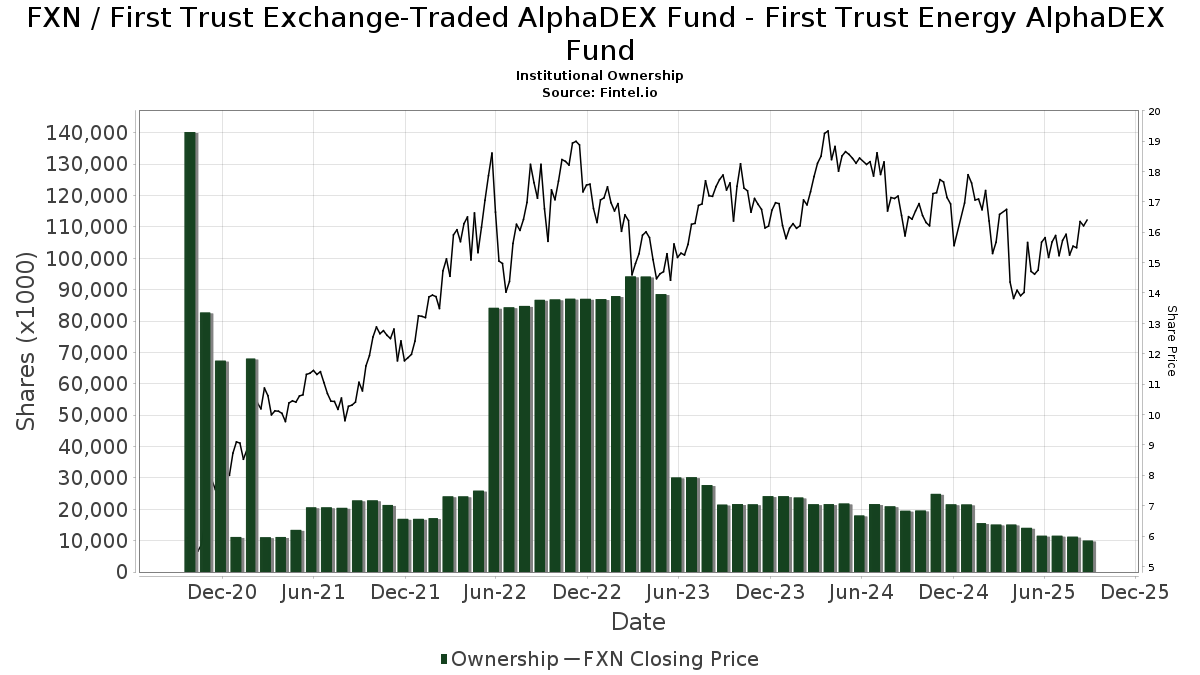
Institutionellt ägande och aktieägare
First Trust Exchange-Traded AlphaDEX Fund - First Trust Energy AlphaDEX Fund (US:FXN) har 116 Institutionella ägare och aktieägare som har lämnat in 13D/G- eller 13F-formulär till Securities Exchange Commission (SEC). Dessa institut innehar totalt 10,006,711 aktier. Största aktieägare inkluderar Morgan Stanley, Wells Fargo & Company/mn, LPL Financial LLC, Bnp Paribas Arbitrage, Sa, UBS Group AG, Bank Of America Corp /de/, Raymond James Financial Inc, Crumly & Associates Inc., Royal Bank Of Canada, and Independent Advisor Alliance .
First Trust Exchange-Traded AlphaDEX Fund - First Trust Energy AlphaDEX Fund (ARCA:FXN) Institutionell ägarstruktur visar institutioners och fonders nuvarande positioner i företaget, samt de senaste förändringarna i positionernas storlek. Större aktieägare kan vara enskilda investerare, fonder, hedgefonder eller institutioner. Bilaga 13D visar att investeraren äger (eller ägde) mer än 5% av företaget och avser (eller avsåg) att aktivt eftersträva en förändring av affärsstrategin. Schedule 13G indikerar en passiv investering på över 5%.
The share price as of September 12, 2025 is 16,16 / share. Previously, on September 13, 2024, the share price was 16,07 / share. This represents an increase of 0,56% over that period.
Fondsentimentets poäng
Fondsentimentet poängen(fka Ägarackumulation-poäng) visar vilka aktier som är mest köpta av fonder. Det är resultatet av en sofistikerad kvantitativ flerfaktormodell som identifierar företag med de högsta nivåerna av institutionell ackumulering. Poängsättningsmodellen använder en kombination av den totala ökningen av redovisade ägare, förändringarna i portföljallokeringarna för dessa ägare och andra mått. Siffran sträcker sig från 0 till 100, där högre siffror indikerar en högre nivå av ackumulering i förhållande till sina konkurrenter, och 50 är genomsnittet.
Uppdateringsfrekvens: Dagligen
Se Ownership Explorer, som innehåller en lista över de högst rankade företagen.
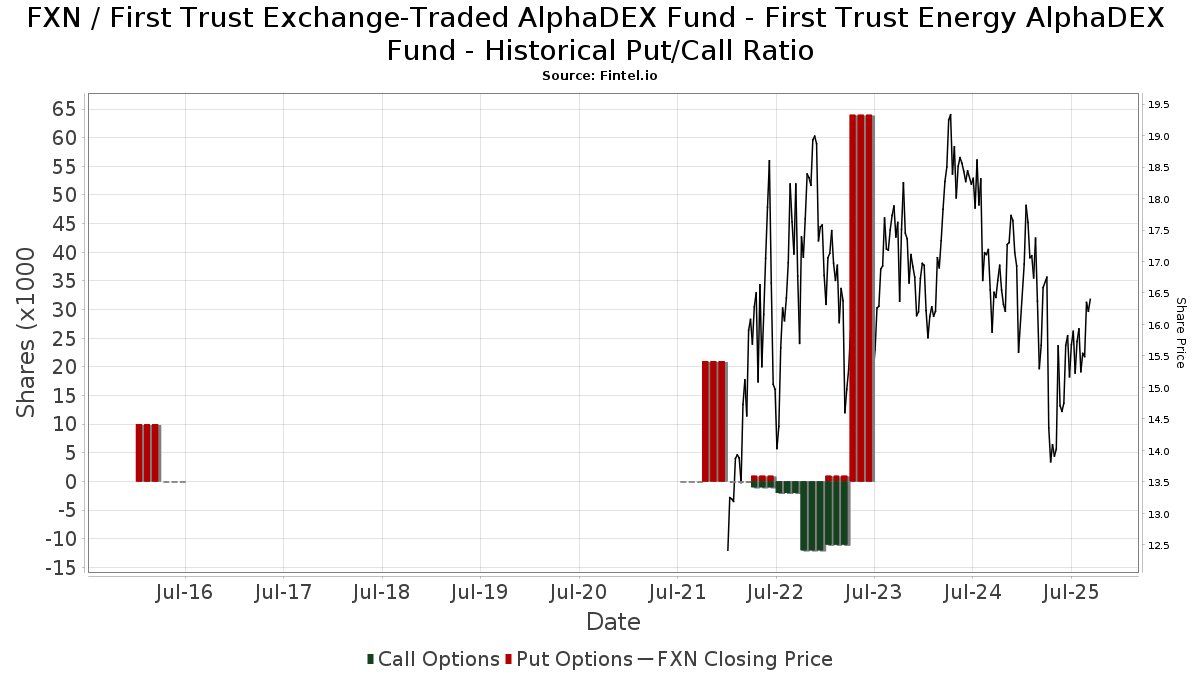
Institutionell sälj/köp-kvot
Förutom att rapportera vanliga eget kapital- och skuldemissioner måste institutioner med mer än 100MM tillgångar under förvaltning också avslöja sina innehav av sälj- och köpoptioner. Eftersom säljoptioner i allmänhet indikerar ett negativt sentiment och köpoptioner indikerar ett positivt sentiment, kan vi få en uppfattning om det övergripande institutionella sentimentet genom att plotta förhållandet mellan säljoptioner och köpoptioner. Diagrammet till höger visar det historiska förhållandet mellan sälj- och köpoptioner för detta instrument.
Genom att använda sälj/köp-kvoten som en indikator på aktieägarnas sentiment undviker man en av de största bristerna med att använda det totala institutionella ägandet, nämligen att en betydande del av de förvaltade tillgångarna investeras passivt för att följa index. Passivt förvaltade fonder köper vanligtvis inte optioner, så indikatorn för sälj/köp-kvoten ger en bättre bild av stämningen i aktivt förvaltade fonder.
13F- och NPORT-arkiveringar
Detaljer om 13F-arkiveringar är gratis. Detaljer om NP-arkiveringar kräver ett premiummedlemskap. Gröna rader indikerar nya positioner. Röda rader indikerar stängda positioner. Klicka på länk symbolen för att se hela transaktionshistoriken.
Uppgradera
för att låsa upp premiumdata och exportera till Excel ![]() .
.
| Fil Datum | Källa | Investerare | Typ | Genomsnittligt pris (beräknat) |
Aktier | Δ Aktier (%) |
Rapporterat värde (1000 USD) |
Δ Värde (%) |
Portföljallokering (%) |
|
|---|---|---|---|---|---|---|---|---|---|---|
| 2025-08-07 | 13F | PFG Advisors | 0 | −100,00 | 0 | |||||
| 2025-08-07 | 13F | PCG Wealth Advisors, LLC | 149 576 | −1,79 | 2 271 | −9,74 | ||||
| 2025-08-08 | 13F | Avantax Advisory Services, Inc. | 14 583 | −50,12 | 221 | −54,24 | ||||
| 2025-05-15 | 13F | Qube Research & Technologies Ltd | 0 | −100,00 | 0 | |||||
| 2025-07-21 | 13F | Ameriflex Group, Inc. | 0 | −100,00 | 0 | |||||
| 2025-08-07 | 13F | Kestra Private Wealth Services, Llc | 12 023 | −4,27 | 183 | −12,08 | ||||
| 2025-08-14 | 13F | Goldman Sachs Group Inc | 100 222 | −4,83 | 1 521 | −12,54 | ||||
| 2025-07-24 | 13F | Blair William & Co/il | 786 | 0,00 | 12 | −8,33 | ||||
| 2025-08-08 | 13F | Capital Investment Advisory Services, LLC | 204 | 0,49 | 3 | 0,00 | ||||
| 2025-08-14 | 13F | Citadel Advisors Llc | 19 719 | −65,89 | 299 | −68,69 | ||||
| 2025-08-14 | 13F | Sunbelt Securities, Inc. | 2 759 | 26,56 | 45 | 25,00 | ||||
| 2025-07-08 | 13F | Nbc Securities, Inc. | 26 620 | 43,31 | 0 | |||||
| 2025-07-17 | 13F | Wagner Wealth Management, Llc | 80 | 0,00 | 1 | 0,00 | ||||
| 2025-05-13 | 13F | EverSource Wealth Advisors, LLC | 0 | −100,00 | 0 | |||||
| 2025-08-11 | 13F | Aptus Capital Advisors, LLC | 487 | 1 523,33 | 7 | |||||
| 2025-08-08 | 13F | Hartland & Co., LLC | 1 763 | 27 | ||||||
| 2025-07-28 | 13F | Harbour Investments, Inc. | 9 138 | −14,77 | 139 | −22,03 | ||||
| 2025-08-12 | 13F | LPL Financial LLC | 1 366 928 | −11,77 | 20 750 | −18,93 | ||||
| 2025-08-14 | 13F | Wiley Bros.-aintree Capital, Llc | 16 589 | 252 | ||||||
| 2025-04-28 | 13F | Private Trust Co Na | 0 | −100,00 | 0 | |||||
| 2025-07-15 | 13F | MCF Advisors LLC | 2 500 | 0,00 | 38 | −9,76 | ||||
| 2025-08-06 | 13F | AE Wealth Management LLC | 16 839 | 40,06 | 256 | 28,79 | ||||
| 2025-07-25 | 13F | Cwm, Llc | 4 862 | 0,08 | 0 | |||||
| 2025-08-06 | 13F | Commonwealth Equity Services, Llc | 113 421 | −11,14 | 2 | −50,00 | ||||
| 2025-07-21 | 13F | Mechanics Financial Corp | 1 004 | 0,00 | 15 | −6,25 | ||||
| 2025-08-06 | 13F | Golden State Wealth Management, LLC | 1 503 | 0,00 | 23 | −8,33 | ||||
| 2025-08-08 | 13F | SBI Securities Co., Ltd. | 3 | 0,00 | 0 | |||||
| 2025-08-14 | 13F | Bank Of America Corp /de/ | 513 034 | −2,75 | 7 788 | −10,65 | ||||
| 2025-08-14 | 13F | GWM Advisors LLC | 42 983 | 1,15 | 652 | −7,12 | ||||
| 2025-08-14 | 13F | Guardian Wealth Advisors, Llc / Nc | 30 | 0,00 | 0 | |||||
| 2025-07-24 | 13F | IFP Advisors, Inc | 5 482 | −12,22 | 83 | −19,42 | ||||
| 2025-07-31 | 13F | Topsail Wealth Management, LLC | 2 600 | 0,00 | 39 | −7,14 | ||||
| 2025-08-13 | 13F | Level Four Advisory Services, Llc | 14 807 | −6,99 | 225 | −14,50 | ||||
| 2025-08-01 | 13F | Rossby Financial, LCC | 395 | 0,00 | 6 | 0,00 | ||||
| 2025-07-17 | 13F | Global Trust Asset Management, LLC | 405 | 0,00 | 6 | 0,00 | ||||
| 2025-08-08 | 13F | Pnc Financial Services Group, Inc. | 10 092 | 0,47 | 153 | −7,27 | ||||
| 2025-08-11 | 13F | Citigroup Inc | 28 393 | −11,98 | 431 | −19,17 | ||||
| 2025-08-18 | 13F | Geneos Wealth Management Inc. | 13 392 | 2,74 | 203 | −5,58 | ||||
| 2025-08-29 | 13F | Centaurus Financial, Inc. | 24 834 | −1,53 | 0 | |||||
| 2025-03-21 | 13F | Prostatis Group LLC | 0 | −100,00 | 0 | −100,00 | ||||
| 2025-08-11 | 13F | Principal Securities, Inc. | 3 557 | 4,65 | 54 | −3,64 | ||||
| 2025-05-14 | 13F | Venture Visionary Partners LLC | 0 | −100,00 | 0 | |||||
| 2025-08-12 | 13F | OneAscent Financial Services LLC | 42 614 | −2,64 | 1 | |||||
| 2025-07-21 | 13F | Ameritas Advisory Services, LLC | 719 | 11 | ||||||
| 2025-08-14 | 13F | Wells Fargo & Company/mn | 1 444 480 | −19,35 | 21 927 | −25,89 | ||||
| 2025-08-04 | 13F | Creative Financial Designs Inc /adv | 1 350 | 0,00 | 20 | −9,09 | ||||
| 2025-08-15 | 13F | Tower Research Capital LLC (TRC) | 81 560 | 57,26 | 1 238 | 44,63 | ||||
| 2025-08-26 | 13F/A | Thrivent Financial For Lutherans | 0 | −100,00 | 0 | |||||
| 2025-08-13 | 13F | Northwestern Mutual Wealth Management Co | 24 536 | 3,14 | 372 | −5,34 | ||||
| 2025-07-24 | 13F | Ronald Blue Trust, Inc. | 611 | 0,66 | 9 | −10,00 | ||||
| 2025-07-02 | 13F | Crumly & Associates Inc. | 194 856 | −14,32 | 2 958 | −21,29 | ||||
| 2025-07-28 | 13F | Private Wealth Asset Management, LLC | 3 775 | 0,00 | 57 | −8,06 | ||||
| 2025-07-18 | 13F | Truist Financial Corp | 35 621 | −14,21 | 541 | −21,17 | ||||
| 2025-08-13 | 13F | StoneX Group Inc. | 12 753 | −35,27 | 194 | −40,62 | ||||
| 2025-07-17 | 13F | Janney Montgomery Scott LLC | 72 180 | −6,55 | 1 | 0,00 | ||||
| 2025-08-13 | 13F | RPg Family Wealth Advisory, LLC | 41 886 | −0,92 | 636 | −9,03 | ||||
| 2025-08-14 | 13F | Financial Advisory Service, Inc. | 18 | 0 | ||||||
| 2025-08-01 | 13F | Envestnet Asset Management Inc | 47 953 | 10,72 | 728 | 1,68 | ||||
| 2025-08-13 | 13F | Jones Financial Companies Lllp | 25 218 | −51,95 | 383 | −55,31 | ||||
| 2025-08-14 | 13F | Comerica Bank | 4 455 | −1,24 | 68 | −9,46 | ||||
| 2025-08-06 | 13F | Moors & Cabot, Inc. | 12 361 | 0,08 | 188 | −8,33 | ||||
| 2025-07-17 | 13F | Vermillion Wealth Management, Inc. | 961 | 0,63 | 15 | −6,67 | ||||
| 2025-07-31 | 13F | Moment Partners, LLC | 0 | −100,00 | 0 | |||||
| 2025-08-06 | 13F | Prospera Financial Services Inc | 46 318 | −2,18 | 703 | −10,10 | ||||
| 2025-08-08 | 13F | 1776 Wealth LLC | 20 100 | 0,00 | 305 | −8,13 | ||||
| 2025-08-12 | 13F | Calton & Associates, Inc. | 0 | −100,00 | 0 | |||||
| 2025-08-14 | 13F | Raymond James Financial Inc | 477 076 | −21,17 | 7 242 | −27,56 | ||||
| 2025-04-22 | 13F | Synergy Financial Management, LLC | 0 | −100,00 | 0 | |||||
| 2025-08-05 | 13F | Integrity Financial Corp /WA | 381 | 6 | ||||||
| 2025-08-13 | 13F | Flow Traders U.s. Llc | 69 382 | −12,63 | 1 | 0,00 | ||||
| 2025-08-13 | 13F | Transce3nd, LLC | 281 | −29,40 | 4 | −33,33 | ||||
| 2025-08-14 | 13F | Royal Bank Of Canada | 168 820 | −40,66 | 2 563 | −45,47 | ||||
| 2025-09-04 | 13F/A | Advisor Group Holdings, Inc. | 152 098 | −1,54 | 2 309 | −9,53 | ||||
| 2025-07-11 | 13F | Pinnacle Bancorp, Inc. | 1 100 | 0,00 | 17 | −11,11 | ||||
| 2025-08-14 | 13F | Jane Street Group, Llc | 77 631 | 1 178 | ||||||
| 2025-05-06 | 13F | Assetmark, Inc | 0 | −100,00 | 0 | |||||
| 2025-08-12 | 13F | SRS Capital Advisors, Inc. | 2 610 | 61,01 | 40 | 50,00 | ||||
| 2025-08-08 | 13F | Larson Financial Group LLC | 275 | 0,00 | 4 | 0,00 | ||||
| 2025-08-14 | 13F | Two Sigma Securities, Llc | 0 | −100,00 | 0 | |||||
| 2025-08-13 | 13F | Gateway Wealth Partners, LLC | 22 352 | −20,64 | 339 | −27,10 | ||||
| 2025-08-14 | 13F | Fmr Llc | 1 099 | −30,92 | 17 | −38,46 | ||||
| 2025-08-14 | 13F | Mpwm Advisory Solutions, Llc | 0 | 0 | ||||||
| 2025-07-07 | 13F | Nova Wealth Management, Inc. | 9 465 | −32,00 | 144 | −37,55 | ||||
| 2025-07-16 | 13F | Register Financial Advisors LLC | 1 000 | 0,00 | 15 | −6,25 | ||||
| 2025-08-11 | 13F | HighTower Advisors, LLC | 123 906 | −21,23 | 1 881 | −27,64 | ||||
| 2025-07-24 | 13F | Us Bancorp \de\ | 160 | 8,84 | 2 | 0,00 | ||||
| 2025-07-11 | 13F | Farther Finance Advisors, LLC | 20 739 | 0,17 | 315 | −8,45 | ||||
| 2025-08-14 | 13F | Transamerica Financial Advisors, Inc. | 113 | 0,00 | 2 | |||||
| 2025-07-16 | 13F/A | CX Institutional | 79 | −93,18 | 0 | |||||
| 2025-05-12 | 13F | C2P Capital Advisory Group, LLC d.b.a. Prosperity Capital Advisors | 0 | −100,00 | 0 | −100,00 | ||||
| 2025-08-12 | 13F | Jpmorgan Chase & Co | 0 | 0 | ||||||
| 2025-07-03 | 13F | Arvest Investments, Inc. | 156 | 0,00 | 2 | 0,00 | ||||
| 2025-05-13 | 13F | Vestmark Advisory Solutions, Inc. | 0 | −100,00 | 0 | |||||
| 2025-07-21 | 13F | DHJJ Financial Advisors, Ltd. | 795 | 0,00 | 12 | −7,69 | ||||
| 2025-08-05 | 13F | HFG Advisors, Inc. | 13 890 | −2,46 | 211 | −10,64 | ||||
| 2025-05-15 | 13F | Hrt Financial Lp | 0 | −100,00 | 0 | |||||
| 2025-08-05 | 13F | Sigma Planning Corp | 0 | −100,00 | 0 | |||||
| 2025-08-04 | 13F | Spire Wealth Management | 277 | 0,00 | 4 | 0,00 | ||||
| 2025-08-13 | 13F | Avestar Capital, LLC | 0 | −100,00 | 0 | |||||
| 2025-08-15 | 13F | Morgan Stanley | 1 757 417 | −23,04 | 26 678 | −29,28 | ||||
| 2025-07-22 | 13F | Global Assets Advisory, LLC | 28 815 | −57,81 | 443 | −55,61 | ||||
| 2025-08-14 | 13F | CoreCap Advisors, LLC | 2 135 | −25,56 | 32 | −31,91 | ||||
| 2025-07-23 | 13F | REAP Financial Group, LLC | 7 365 | −31,26 | 112 | −37,29 | ||||
| 2025-08-08 | 13F | MTM Investment Management, LLC | 2 044 | 0,00 | 31 | −6,06 | ||||
| 2025-08-11 | 13F | Private Advisor Group, LLC | 93 216 | −9,44 | 1 415 | −16,76 | ||||
| 2025-08-14 | 13F | Susquehanna International Group, Llp | 12 217 | 185 | ||||||
| 2025-07-15 | 13F | Armis Advisers, LLC | 0 | −100,00 | 0 | −100,00 | ||||
| 2025-08-05 | 13F | Dunhill Financial, LLC | 1 180 | 18 | ||||||
| 2025-05-06 | 13F | Atria Investments Llc | 0 | −100,00 | 0 | |||||
| 2025-08-14 | 13F | UBS Group AG | 592 430 | 8,60 | 8 993 | −0,21 | ||||
| 2025-08-14 | 13F | Benjamin Edwards Inc | 42 322 | 0,00 | 642 | −8,15 | ||||
| 2025-08-12 | 13F | Steward Partners Investment Advisory, Llc | 6 782 | −20,57 | 103 | −27,66 | ||||
| 2025-07-30 | 13F | D.a. Davidson & Co. | 11 290 | 0,29 | 171 | −7,57 | ||||
| 2025-07-30 | 13F | Prosperity Financial Group, Inc. | 11 867 | 0,60 | 180 | −7,22 | ||||
| 2025-08-05 | 13F | Kesler, Norman & Wride, LLC | 42 668 | 0,63 | 648 | −7,57 | ||||
| 2025-07-29 | 13F | Cottonwood Capital Advisors, Llc | 21 322 | 0,00 | 324 | −8,24 | ||||
| 2025-08-12 | 13F | Nemes Rush Group LLC | 0 | −100,00 | 0 | |||||
| 2025-07-31 | 13F | Cambridge Investment Research Advisors, Inc. | 95 157 | −13,52 | 1 | 0,00 | ||||
| 2025-08-15 | 13F | Equitable Holdings, Inc. | 35 236 | 535 | ||||||
| 2025-08-11 | 13F | Independent Advisor Alliance | 156 601 | 2 377 | ||||||
| 2025-08-13 | 13F | Quadrature Capital Ltd | 144 242 | 70,68 | 2 190 | 57,03 | ||||
| 2025-07-25 | 13F | Atria Wealth Solutions, Inc. | 0 | −100,00 | 0 | |||||
| 2025-07-16 | 13F | ORG Partners LLC | 2 000 | 0,00 | 31 | −9,09 | ||||
| 2025-08-13 | 13F | JBR Co Financial Management Inc | 22 235 | −2,90 | 338 | −10,85 | ||||
| 2025-08-08 | 13F | Cetera Investment Advisers | 118 012 | −2,53 | 1 791 | −10,45 | ||||
| 2025-07-28 | 13F | Kiker Wealth Management, LLC | 79 | 1,28 | 1 | 0,00 | ||||
| 2025-07-11 | 13F | SILVER OAK SECURITIES, Inc | 10 167 | 0,26 | 154 | −6,67 | ||||
| 2025-08-12 | 13F | Global Retirement Partners, LLC | 7 614 | 39,04 | 116 | 29,21 | ||||
| 2025-07-25 | 13F | Hazlett, Burt & Watson, Inc. | 1 466 | 91,38 | 0 | |||||
| 2025-07-17 | 13F | Sound Income Strategies, LLC | 0 | 0 | ||||||
| 2025-08-14 | 13F | Bnp Paribas Arbitrage, Sa | 651 200 | 543,48 | 9 885 | 491,56 | ||||
| 2025-08-14 | 13F | Stifel Financial Corp | 114 838 | −15,30 | 1 743 | −22,15 | ||||
| 2025-08-01 | 13F | Biltmore Family Office, LLC | 3 226 | 49 | ||||||
| 2025-08-14 | 13F | Mml Investors Services, Llc | 23 101 | −24,50 | 0 | |||||
| 2025-07-29 | 13F | Stratos Wealth Partners, LTD. | 121 047 | −12,00 | 1 837 | −19,15 | ||||
| 2025-08-12 | 13F | Marshall & Sterling Wealth Advisors Inc. | 437 | −99,54 | 7 | −99,61 | ||||
| 2025-05-15 | 13F | Baird Financial Group, Inc. | 0 | −100,00 | 0 | |||||
| 2025-07-15 | 13F | Wealth Effects Llc | 10 500 | 0,00 | 159 | −8,09 | ||||
| 2025-08-15 | 13F | Kestra Advisory Services, LLC | 62 417 | −2,65 | 947 | −10,58 | ||||
| 2025-05-16 | 13F | Coppell Advisory Solutions LLC | 0 | −100,00 | 0 | −100,00 | ||||
| 2025-08-08 | 13F | Emerald Investment Partners, Llc | 508 | 0,00 | 8 | −12,50 | ||||
| 2025-07-07 | 13F | Thurston, Springer, Miller, Herd & Titak, Inc. | 200 | 0,00 | 3 | 0,00 | ||||
| 2025-07-31 | 13F | Brinker Capital Investments, LLC | 0 | −100,00 | 0 | −100,00 | ||||
| 2025-08-04 | 13F | Waterfront Wealth Inc. | 13 735 | 0,00 | 208 | −7,96 | ||||
| 2025-08-12 | 13F | Proequities, Inc. | 0 | 0 |