Grundläggande statistik
| Institutionella ägare | 101 total, 101 long only, 0 short only, 0 long/short - change of −2,86% MRQ |
| Genomsnittlig portföljallokering | 0.1649 % - change of 0,11% MRQ |
| Institutionella aktier (lång) | 3 381 434 (ex 13D/G) - change of −0,31MM shares −8,31% MRQ |
| Institutionellt värde (lång) | $ 268 572 USD ($1000) |
Institutionellt ägande och aktieägare
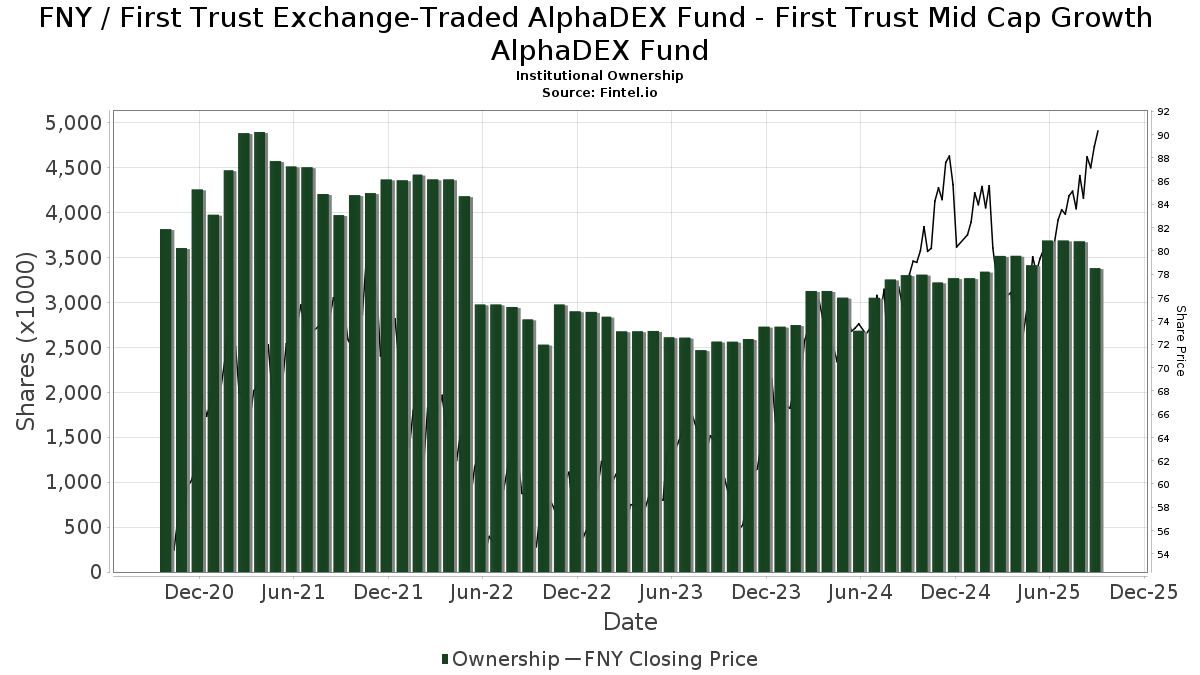
First Trust Exchange-Traded AlphaDEX Fund - First Trust Mid Cap Growth AlphaDEX Fund (US:FNY) har 101 Institutionella ägare och aktieägare som har lämnat in 13D/G- eller 13F-formulär till Securities Exchange Commission (SEC). Dessa institut innehar totalt 3,381,434 aktier. Största aktieägare inkluderar LPL Financial LLC, Wells Fargo & Company/mn, Morgan Stanley, GWM Advisors LLC, Wiley Bros.-aintree Capital, Llc, UBS Group AG, Envestnet Asset Management Inc, Raymond James Financial Inc, Kingsview Wealth Management, LLC, and Benjamin Edwards Inc .
First Trust Exchange-Traded AlphaDEX Fund - First Trust Mid Cap Growth AlphaDEX Fund (NasdaqGM:FNY) Institutionell ägarstruktur visar institutioners och fonders nuvarande positioner i företaget, samt de senaste förändringarna i positionernas storlek. Större aktieägare kan vara enskilda investerare, fonder, hedgefonder eller institutioner. Bilaga 13D visar att investeraren äger (eller ägde) mer än 5% av företaget och avser (eller avsåg) att aktivt eftersträva en förändring av affärsstrategin. Schedule 13G indikerar en passiv investering på över 5%.
The share price as of September 16, 2025 is 90,00 / share. Previously, on September 17, 2024, the share price was 78,04 / share. This represents an increase of 15,33% over that period.
Fondsentimentets poäng
Fondsentimentet poängen(fka Ägarackumulation-poäng) visar vilka aktier som är mest köpta av fonder. Det är resultatet av en sofistikerad kvantitativ flerfaktormodell som identifierar företag med de högsta nivåerna av institutionell ackumulering. Poängsättningsmodellen använder en kombination av den totala ökningen av redovisade ägare, förändringarna i portföljallokeringarna för dessa ägare och andra mått. Siffran sträcker sig från 0 till 100, där högre siffror indikerar en högre nivå av ackumulering i förhållande till sina konkurrenter, och 50 är genomsnittet.
Uppdateringsfrekvens: Dagligen
Se Ownership Explorer, som innehåller en lista över de högst rankade företagen.
Institutionell sälj/köp-kvot
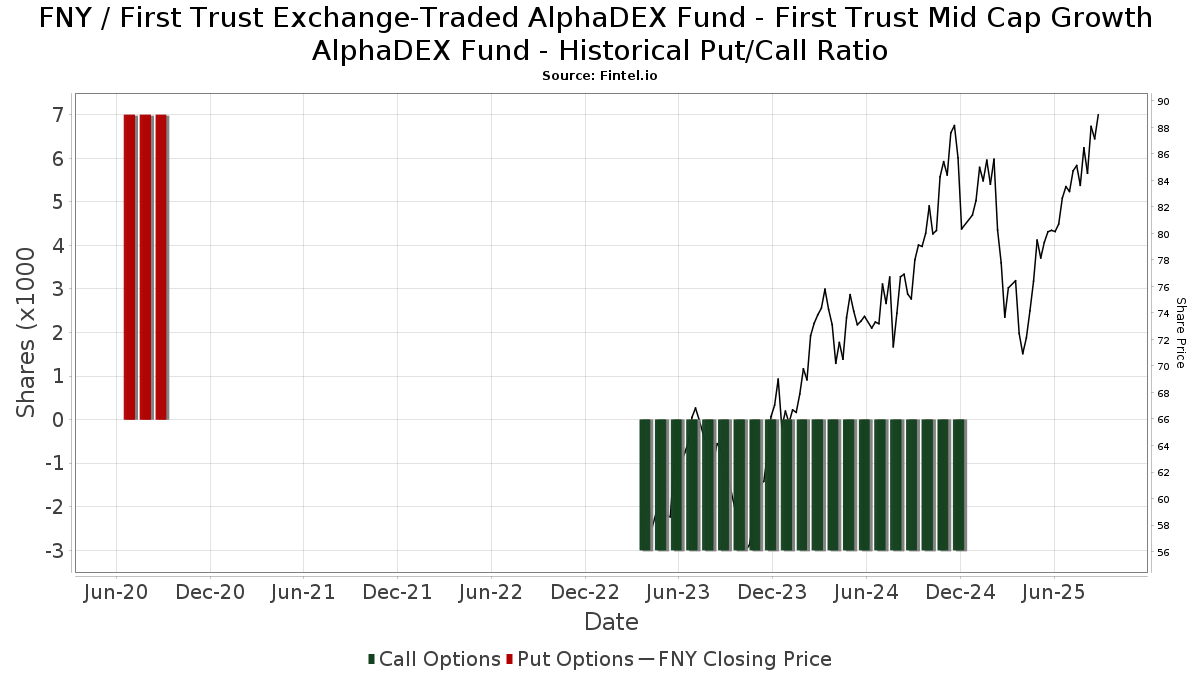
Förutom att rapportera vanliga eget kapital- och skuldemissioner måste institutioner med mer än 100MM tillgångar under förvaltning också avslöja sina innehav av sälj- och köpoptioner. Eftersom säljoptioner i allmänhet indikerar ett negativt sentiment och köpoptioner indikerar ett positivt sentiment, kan vi få en uppfattning om det övergripande institutionella sentimentet genom att plotta förhållandet mellan säljoptioner och köpoptioner. Diagrammet till höger visar det historiska förhållandet mellan sälj- och köpoptioner för detta instrument.
Genom att använda sälj/köp-kvoten som en indikator på aktieägarnas sentiment undviker man en av de största bristerna med att använda det totala institutionella ägandet, nämligen att en betydande del av de förvaltade tillgångarna investeras passivt för att följa index. Passivt förvaltade fonder köper vanligtvis inte optioner, så indikatorn för sälj/köp-kvoten ger en bättre bild av stämningen i aktivt förvaltade fonder.
13F- och NPORT-arkiveringar
Detaljer om 13F-arkiveringar är gratis. Detaljer om NP-arkiveringar kräver ett premiummedlemskap. Gröna rader indikerar nya positioner. Röda rader indikerar stängda positioner. Klicka på länk symbolen för att se hela transaktionshistoriken.
Uppgradera
för att låsa upp premiumdata och exportera till Excel ![]() .
.
| Fil Datum | Källa | Investerare | Typ | Genomsnittligt pris (beräknat) |
Aktier | Δ Aktier (%) |
Rapporterat värde (1000 USD) |
Δ Värde (%) |
Portföljallokering (%) |
|
|---|---|---|---|---|---|---|---|---|---|---|
| 2025-08-06 | 13F | Commonwealth Equity Services, Llc | 33 884 | −22,12 | 3 | −33,33 | ||||
| 2025-08-13 | 13F | Beacon Pointe Advisors, LLC | 5 500 | 0,00 | 453 | 10,22 | ||||
| 2025-08-14 | 13F | Goldman Sachs Group Inc | 50 000 | −5,29 | 4 122 | 4,28 | ||||
| 2025-08-14 | 13F | Raymond James Financial Inc | 95 706 | −29,90 | 7 890 | −22,81 | ||||
| 2025-07-08 | 13F | Nbc Securities, Inc. | 675 | 0,00 | 0 | |||||
| 2025-07-21 | 13F | Hilltop National Bank | 91 | −49,72 | 8 | −50,00 | ||||
| 2025-04-25 | 13F | G&S Capital LLC | 0 | −100,00 | 0 | |||||
| 2025-07-14 | 13F | GAMMA Investing LLC | 445 | 37 | ||||||
| 2025-08-12 | 13F | Integrated Advisors Network LLC | 2 707 | −32,93 | 223 | −26,16 | ||||
| 2025-08-12 | 13F | Cornerstone Wealth Management, LLC | 5 681 | 0,00 | 468 | 10,12 | ||||
| 2025-05-14 | 13F | Capital Analysts, Inc. | 0 | −100,00 | 0 | |||||
| 2025-07-11 | 13F | Wealth Management Partners, LLC | 36 062 | −0,80 | 2 991 | 9,85 | ||||
| 2025-08-14 | 13F | Wiley Bros.-aintree Capital, Llc | 154 033 | 3,22 | 12 694 | 14,70 | ||||
| 2025-08-26 | 13F/A | Thrivent Financial For Lutherans | 4 646 | 0,00 | 0 | |||||
| 2025-07-30 | 13F | D.a. Davidson & Co. | 4 568 | −2,14 | 377 | 7,74 | ||||
| 2025-08-08 | 13F | Kingsview Wealth Management, LLC | 70 752 | −1,64 | 5 833 | 8,28 | ||||
| 2025-07-31 | 13F | Cambridge Investment Research Advisors, Inc. | 18 995 | 1,96 | 2 | 0,00 | ||||
| 2025-08-14 | 13F | Sunbelt Securities, Inc. | 100 | 0,00 | 8 | 14,29 | ||||
| 2025-08-08 | 13F | Pnc Financial Services Group, Inc. | 482 | 0,00 | 40 | 8,33 | ||||
| 2025-08-14 | 13F | Synovus Financial Corp | 12 215 | 3,63 | 1 007 | 14,17 | ||||
| 2025-08-08 | 13F | Cetera Investment Advisers | 62 506 | 8,31 | 5 153 | 19,23 | ||||
| 2025-08-13 | 13F/A | StoneX Group Inc. | 4 303 | 12,53 | 230 | 10,05 | ||||
| 2025-09-04 | 13F/A | Advisor Group Holdings, Inc. | 43 384 | 3,60 | 3 578 | 14,03 | ||||
| 2025-07-09 | 13F | Keystone Wealth Services, LLC | 4 198 | 0,00 | 346 | 10,19 | ||||
| 2025-08-08 | 13F | Gts Securities Llc | 12 252 | 0,00 | 1 010 | 10,14 | ||||
| 2025-08-14 | 13F | Benjamin Edwards Inc | 63 916 | −28,81 | 5 269 | −21,63 | ||||
| 2025-08-12 | 13F | Global Retirement Partners, LLC | 21 581 | −2,41 | 1 779 | 0,57 | ||||
| 2025-07-25 | 13F | Atria Wealth Solutions, Inc. | 8 849 | −70,74 | 730 | −67,80 | ||||
| 2025-07-18 | 13F | New Wave Wealth Advisors Llc | 5 064 | −8,92 | 417 | 0,24 | ||||
| 2025-08-14 | 13F | Old Mission Capital Llc | 3 526 | 291 | ||||||
| 2025-08-14 | 13F | IHT Wealth Management, LLC | 2 926 | −12,03 | 241 | −3,21 | ||||
| 2025-07-18 | 13F | Truist Financial Corp | 2 811 | 1,77 | 232 | 12,14 | ||||
| 2025-07-17 | 13F | Janney Montgomery Scott LLC | 50 302 | −0,33 | 4 | 33,33 | ||||
| 2025-05-13 | 13F | Nations Financial Group Inc, /ia/ /adv | 0 | −100,00 | 0 | −100,00 | ||||
| 2025-07-24 | 13F | IFP Advisors, Inc | 7 399 | 48,31 | 610 | 63,27 | ||||
| 2025-08-14 | 13F | CoreCap Advisors, LLC | 1 090 | 0,00 | 90 | 9,88 | ||||
| 2025-07-29 | 13F | Koshinski Asset Management, Inc. | 2 520 | 208 | ||||||
| 2025-05-14 | 13F | Caitlin John, LLC | 0 | −100,00 | 0 | |||||
| 2025-08-04 | 13F | Pensionmark Financial Group, Llc | 7 830 | −1,26 | 646 | 8,77 | ||||
| 2025-05-09 | 13F | Belvedere Trading LLC | Call | 0 | −100,00 | 0 | −100,00 | |||
| 2025-08-11 | 13F | HighTower Advisors, LLC | 0 | −100,00 | 0 | |||||
| 2025-08-13 | 13F | Northwestern Mutual Wealth Management Co | 36 712 | 13,20 | 3 027 | 24,63 | ||||
| 2025-08-14 | 13F | UBS Group AG | 150 344 | −19,74 | 12 394 | −11,64 | ||||
| 2025-08-08 | 13F | 1776 Wealth LLC | 2 989 | 0,00 | 246 | 10,31 | ||||
| 2025-08-14 | 13F | Mariner, LLC | 5 860 | −0,24 | 483 | 10,02 | ||||
| 2025-07-17 | 13F | Venture Visionary Partners LLC | 2 800 | 0,00 | 231 | 10,05 | ||||
| 2025-07-16 | 13F | Sylvest Advisors, LLC | 17 462 | 3,01 | 1 440 | 13,40 | ||||
| 2025-08-13 | 13F | Jones Financial Companies Lllp | 16 720 | 112,89 | 1 378 | 136,60 | ||||
| 2025-07-29 | 13F | AssuredPartners Investment Advisors, LLC | 11 305 | −7,70 | 932 | 1,53 | ||||
| 2025-08-14 | 13F | Comerica Bank | 10 524 | −1,12 | 868 | 8,92 | ||||
| 2025-08-12 | 13F | Richmond Investment Services, LLC | 2 854 | 235 | ||||||
| 2025-08-12 | 13F | LPL Financial LLC | 668 752 | 7,82 | 55 132 | 18,71 | ||||
| 2025-07-29 | 13F | Private Trust Co Na | 2 499 | 0,00 | 206 | 10,16 | ||||
| 2025-08-14 | 13F | Wells Fargo & Company/mn | 459 597 | −29,54 | 37 889 | −22,43 | ||||
| 2025-07-28 | 13F | Harbour Investments, Inc. | 3 078 | −0,48 | 254 | 9,52 | ||||
| 2025-03-18 | 13F/A | Bank Of America Corp /de/ | 0 | −100,00 | 0 | |||||
| 2025-08-13 | 13F | Flow Traders U.s. Llc | 0 | −100,00 | 0 | |||||
| 2025-08-07 | 13F | PCG Wealth Advisors, LLC | 10 359 | −49,43 | 854 | −44,36 | ||||
| 2025-08-14 | 13F | Susquehanna International Group, Llp | 0 | −100,00 | 0 | |||||
| 2025-08-06 | 13F | Stonebridge Financial Planning Group, LLC | 7 352 | 0,00 | 606 | 10,18 | ||||
| 2025-08-08 | 13F | Creative Planning | 7 495 | −21,80 | 618 | −13,95 | ||||
| 2025-08-01 | 13F | Ashton Thomas Private Wealth, LLC | 2 687 | −6,34 | 222 | 3,27 | ||||
| 2025-08-14 | 13F | Jane Street Group, Llc | 0 | −100,00 | 0 | |||||
| 2025-08-11 | 13F | Private Advisor Group, LLC | 40 033 | −12,99 | 3 300 | −4,21 | ||||
| 2025-07-11 | 13F | Farther Finance Advisors, LLC | 17 | 0,00 | 1 | 0,00 | ||||
| 2025-08-26 | NP | FIRST TRUST VARIABLE INSURANCE TRUST - First Trust Dorsey Wright Tactical Core Portfolio Class I This fund is a listed as child fund of First Trust Advisors Lp and if that institution has disclosed ownership in this security, then these positions will not be double counted when calculating total shares and total value | 60 423 | −4,57 | 4 981 | 5,06 | ||||
| 2025-08-15 | 13F | Morgan Stanley | 393 375 | 12,18 | 32 430 | 23,50 | ||||
| 2025-08-15 | 13F | Tower Research Capital LLC (TRC) | 0 | −100,00 | 0 | |||||
| 2025-08-14 | 13F | Mpwm Advisory Solutions, Llc | 955 | 32,45 | 79 | 47,17 | ||||
| 2025-08-13 | 13F | First Trust Advisors Lp | 61 127 | −4,52 | 5 039 | 5,13 | ||||
| 2025-08-15 | 13F | Kestra Advisory Services, LLC | 29 086 | 11,40 | 2 398 | 22,61 | ||||
| 2025-08-06 | 13F | Kcm Investment Advisors Llc | 38 941 | 0,26 | 3 210 | 10,39 | ||||
| 2025-08-05 | 13F | Sigma Planning Corp | 9 279 | −4,03 | 765 | 5,52 | ||||
| 2025-07-31 | 13F | Oppenheimer & Co Inc | 2 602 | 215 | ||||||
| 2025-07-10 | 13F | ARS Wealth Advisors Group, LLC | 8 096 | 0,00 | 667 | 10,07 | ||||
| 2025-08-13 | 13F | Gateway Wealth Partners, LLC | 3 546 | −2,72 | 292 | 7,35 | ||||
| 2025-08-11 | 13F/A | Purus Wealth Management, LLC | 7 522 | 0,00 | 620 | 10,12 | ||||
| 2025-08-12 | 13F | Steward Partners Investment Advisory, Llc | 1 905 | −9,93 | 157 | −0,63 | ||||
| 2025-08-14 | 13F | Transamerica Financial Advisors, Inc. | 15 417 | 0,55 | 1 271 | 126 900,00 | ||||
| 2025-08-08 | 13F | MTM Investment Management, LLC | 18 000 | 0,00 | 1 484 | 9,45 | ||||
| 2025-08-13 | 13F | Baird Financial Group, Inc. | 7 778 | −5,93 | 641 | 3,55 | ||||
| 2025-08-13 | 13F | JT Stratford LLC | 16 532 | 0,00 | 1 363 | 10,11 | ||||
| 2025-07-15 | 13F | BostonPremier Wealth LLC | 4 676 | 0,02 | 386 | 10,00 | ||||
| 2025-08-14 | 13F | Fmr Llc | 147 | 0,00 | 12 | 20,00 | ||||
| 2025-08-14 | 13F | Arete Wealth Advisors, LLC | 2 650 | 0 | ||||||
| 2025-07-24 | 13F | Us Bancorp \de\ | 689 | 0,00 | 57 | 9,80 | ||||
| 2025-08-11 | 13F | HHM Wealth Advisors, LLC | 404 | 0,00 | 33 | 10,00 | ||||
| 2025-05-16 | 13F | Coppell Advisory Solutions LLC | 0 | −100,00 | 0 | |||||
| 2025-08-12 | 13F | Founders Financial Alliance, LLC | 0 | −100,00 | 0 | |||||
| 2025-07-28 | 13F | Mutual Advisors, LLC | 2 816 | −4,02 | 238 | 10,19 | ||||
| 2025-08-01 | 13F | Envestnet Asset Management Inc | 117 384 | 32,17 | 9 677 | 45,52 | ||||
| 2025-08-14 | 13F | Integrated Wealth Concepts LLC | 0 | −100,00 | 0 | |||||
| 2025-08-14 | 13F | GWM Advisors LLC | 196 991 | −4,80 | 16 240 | 4,82 | ||||
| 2025-07-14 | 13F | Farmers & Merchants Investments Inc | 137 | 11 | ||||||
| 2025-08-12 | 13F | Proequities, Inc. | 0 | 0 | ||||||
| 2025-05-14 | 13F | Monterey Private Wealth, Inc. | 2 903 | 0,00 | 217 | −6,47 | ||||
| 2025-04-21 | 13F | PSI Advisors, LLC | 0 | −100,00 | 0 | |||||
| 2025-07-18 | 13F | Brueske Advisory Services, LLC | 12 412 | −8,84 | 1 023 | 0,39 | ||||
| 2025-08-01 | 13F | Transcend Wealth Collective, Llc | 8 884 | 18,47 | 732 | 30,48 | ||||
| 2025-07-07 | 13F | Dominguez Wealth Management Solutions, Inc. | 7 992 | −0,94 | 659 | 8,94 | ||||
| 2025-07-23 | 13F | Element Wealth, LLC | 5 155 | 0,00 | 425 | 9,84 | ||||
| 2025-05-14 | 13F | Huntington National Bank | 4 | −25,00 | ||||||
| 2025-08-12 | 13F | Financial Advocates Investment Management | 3 354 | 0,96 | 276 | 11,29 | ||||
| 2025-07-10 | 13F | Wealth Enhancement Advisory Services, Llc | 27 133 | −1,28 | 2 265 | 10,06 | ||||
| 2025-08-15 | 13F | Equitable Holdings, Inc. | 20 905 | 11,47 | 1 723 | 22,72 | ||||
| 2025-08-07 | 13F | Allworth Financial LP | 560 | −10,40 | 46 | 2,22 | ||||
| 2025-07-24 | 13F | WMG Financial Advisors, LLC | 3 619 | −1,09 | 298 | 9,16 | ||||
| 2025-07-17 | 13F | Clear Point Advisors Inc. | 5 071 | −0,94 | 418 | 9,14 | ||||
| 2025-04-10 | 13F | Clarus Wealth Advisors | 0 | −100,00 | 0 | |||||
| 2025-05-06 | 13F | Avantax Advisory Services, Inc. | 0 | −100,00 | 0 | |||||
| 2025-04-14 | 13F | Black Point Wealth Management | 0 | −100,00 | 0 | −100,00 | ||||
| 2025-07-25 | 13F | Cwm, Llc | 2 144 | 0,00 | 0 | |||||
| 2025-08-04 | 13F | Keybank National Association/oh | 3 926 | 0,00 | 324 | 10,24 | ||||
| 2025-05-12 | 13F | Independent Advisor Alliance | 0 | −100,00 | 0 | |||||
| 2025-08-14 | 13F | Citadel Advisors Llc | 0 | −100,00 | 0 | |||||
| 2025-08-14 | 13F | Mml Investors Services, Llc | 8 709 | 0,08 | 1 | |||||
| 2025-04-22 | 13F | Synergy Financial Management, LLC | 0 | −100,00 | 0 | |||||
| 2025-07-29 | 13F | Stratos Wealth Partners, LTD. | 8 989 | 49,10 | 741 | 64,30 | ||||
| 2025-08-14 | 13F | Stifel Financial Corp | 15 889 | −40,74 | 1 310 | −34,78 | ||||
| 2025-08-12 | 13F | Jpmorgan Chase & Co | 4 131 | 102,60 | 341 | 123,68 | ||||
| 2025-08-14 | 13F | Great Valley Advisor Group, Inc. | 8 481 | 0,01 | 699 | 10,08 | ||||
| 2025-08-05 | 13F | GPS Wealth Strategies Group, LLC | 648 | 0,00 | 53 | 10,42 | ||||
| 2025-08-18 | 13F | Geneos Wealth Management Inc. | 4 378 | 94,49 | 361 | 114,29 | ||||
| 2025-08-14 | 13F | Royal Bank Of Canada | 25 658 | 23,93 | 2 115 | 36,45 |
Other Listings
| MX:FNY |