Grundläggande statistik
| Institutionella ägare | 119 total, 119 long only, 0 short only, 0 long/short - change of −3,23% MRQ |
| Genomsnittlig portföljallokering | 0.1128 % - change of 6,78% MRQ |
| Institutionella aktier (lång) | 5 332 634 (ex 13D/G) - change of 0,21MM shares 4,12% MRQ |
| Institutionellt värde (lång) | $ 339 801 USD ($1000) |
Institutionellt ägande och aktieägare
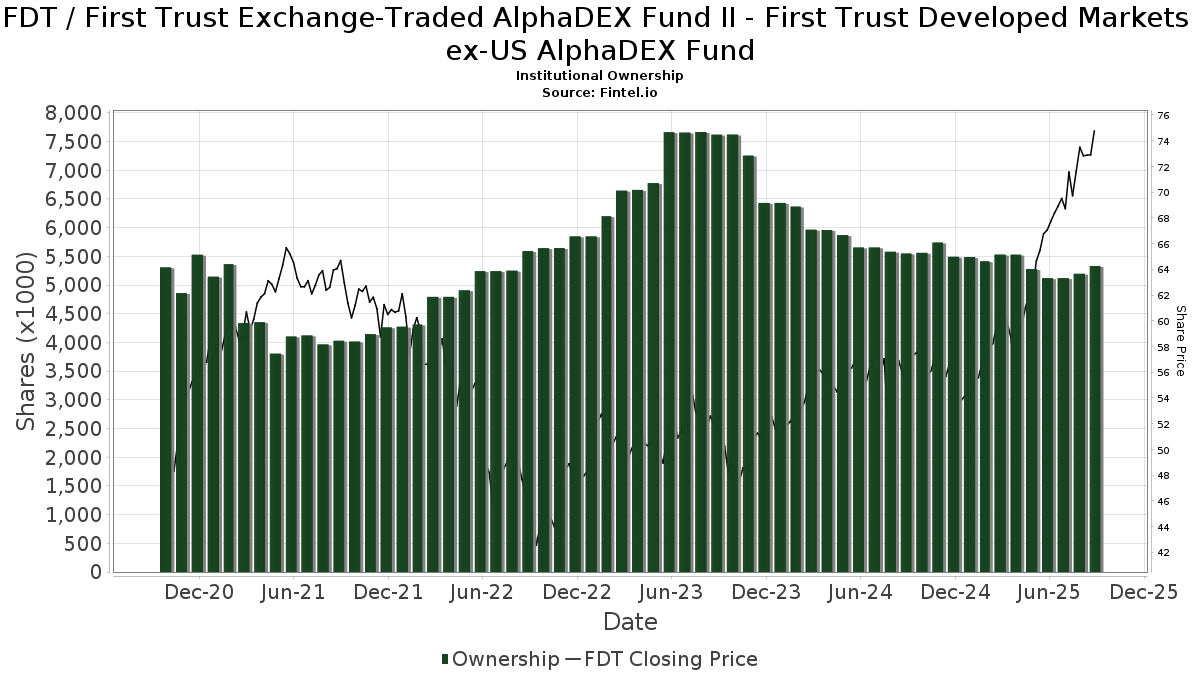
First Trust Exchange-Traded AlphaDEX Fund II - First Trust Developed Markets ex-US AlphaDEX Fund (US:FDT) har 119 Institutionella ägare och aktieägare som har lämnat in 13D/G- eller 13F-formulär till Securities Exchange Commission (SEC). Dessa institut innehar totalt 5,332,634 aktier. Största aktieägare inkluderar Morgan Stanley, LPL Financial LLC, Envestnet Asset Management Inc, Wells Fargo & Company/mn, UBS Group AG, Raymond James Financial Inc, Cambridge Investment Research Advisors, Inc., Royal Bank Of Canada, Cetera Investment Advisers, and Kingsview Wealth Management, LLC .
First Trust Exchange-Traded AlphaDEX Fund II - First Trust Developed Markets ex-US AlphaDEX Fund (NasdaqGM:FDT) Institutionell ägarstruktur visar institutioners och fonders nuvarande positioner i företaget, samt de senaste förändringarna i positionernas storlek. Större aktieägare kan vara enskilda investerare, fonder, hedgefonder eller institutioner. Bilaga 13D visar att investeraren äger (eller ägde) mer än 5% av företaget och avser (eller avsåg) att aktivt eftersträva en förändring av affärsstrategin. Schedule 13G indikerar en passiv investering på över 5%.
The share price as of September 9, 2025 is 74,38 / share. Previously, on September 10, 2024, the share price was 54,79 / share. This represents an increase of 35,76% over that period.
Fondsentimentets poäng
Fondsentimentet poängen(fka Ägarackumulation-poäng) visar vilka aktier som är mest köpta av fonder. Det är resultatet av en sofistikerad kvantitativ flerfaktormodell som identifierar företag med de högsta nivåerna av institutionell ackumulering. Poängsättningsmodellen använder en kombination av den totala ökningen av redovisade ägare, förändringarna i portföljallokeringarna för dessa ägare och andra mått. Siffran sträcker sig från 0 till 100, där högre siffror indikerar en högre nivå av ackumulering i förhållande till sina konkurrenter, och 50 är genomsnittet.
Uppdateringsfrekvens: Dagligen
Se Ownership Explorer, som innehåller en lista över de högst rankade företagen.
Institutionell sälj/köp-kvot
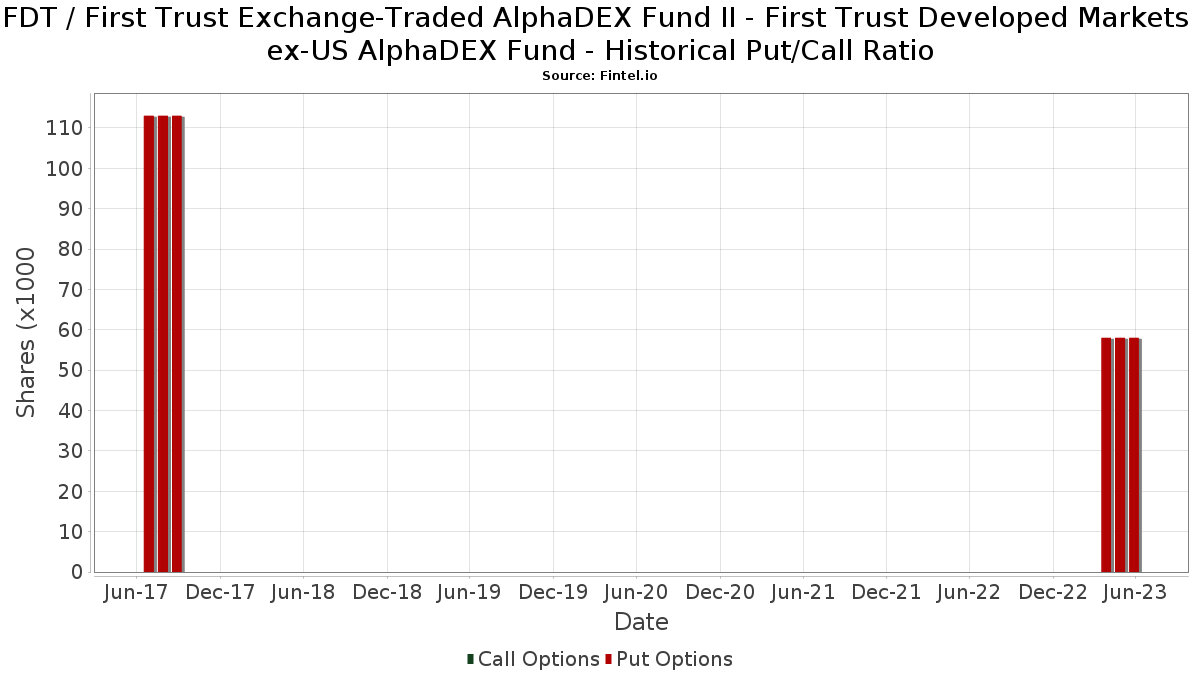
Förutom att rapportera vanliga eget kapital- och skuldemissioner måste institutioner med mer än 100MM tillgångar under förvaltning också avslöja sina innehav av sälj- och köpoptioner. Eftersom säljoptioner i allmänhet indikerar ett negativt sentiment och köpoptioner indikerar ett positivt sentiment, kan vi få en uppfattning om det övergripande institutionella sentimentet genom att plotta förhållandet mellan säljoptioner och köpoptioner. Diagrammet till höger visar det historiska förhållandet mellan sälj- och köpoptioner för detta instrument.
Genom att använda sälj/köp-kvoten som en indikator på aktieägarnas sentiment undviker man en av de största bristerna med att använda det totala institutionella ägandet, nämligen att en betydande del av de förvaltade tillgångarna investeras passivt för att följa index. Passivt förvaltade fonder köper vanligtvis inte optioner, så indikatorn för sälj/köp-kvoten ger en bättre bild av stämningen i aktivt förvaltade fonder.
13F- och NPORT-arkiveringar
Detaljer om 13F-arkiveringar är gratis. Detaljer om NP-arkiveringar kräver ett premiummedlemskap. Gröna rader indikerar nya positioner. Röda rader indikerar stängda positioner. Klicka på länk symbolen för att se hela transaktionshistoriken.
Uppgradera
för att låsa upp premiumdata och exportera till Excel ![]() .
.
| Fil Datum | Källa | Investerare | Typ | Genomsnittligt pris (beräknat) |
Aktier | Δ Aktier (%) |
Rapporterat värde (1000 USD) |
Δ Värde (%) |
Portföljallokering (%) |
|
|---|---|---|---|---|---|---|---|---|---|---|
| 2025-05-08 | 13F | Great Valley Advisor Group, Inc. | 0 | −100,00 | 0 | −100,00 | ||||
| 2025-07-21 | 13F | Hilltop National Bank | 1 450 | 0,00 | 100 | 26,92 | ||||
| 2025-05-01 | 13F | Quest 10 Wealth Builders, Inc. | 315 | −5,12 | 18 | 5,88 | ||||
| 2025-08-27 | 13F/A | Brinker Capital Investments, LLC | 25 878 | −10,34 | 1 779 | 5,83 | ||||
| 2025-07-08 | 13F | Nbc Securities, Inc. | 5 991 | −42,10 | 0 | |||||
| 2025-08-08 | 13F | Avantax Advisory Services, Inc. | 41 604 | −9,33 | 2 861 | 7,04 | ||||
| 2025-08-12 | 13F | PSI Advisors, LLC | 0 | −100,00 | 0 | |||||
| 2025-07-09 | 13F | Towerpoint Wealth, LLC | 29 051 | 3,55 | 1 998 | 22,22 | ||||
| 2025-08-05 | 13F | Plante Moran Financial Advisors, LLC | 752 | 0,00 | 52 | 18,60 | ||||
| 2025-04-10 | 13F | TrueWealth Advisors, LLC | 0 | −100,00 | 0 | |||||
| 2025-08-06 | 13F | Golden State Wealth Management, LLC | 2 623 | −24,26 | 180 | −10,45 | ||||
| 2025-08-11 | 13F | Tidemark, LLC | 0 | −100,00 | 0 | |||||
| 2025-08-08 | 13F | L & S Advisors Inc | 32 282 | 15,10 | 2 220 | 35,88 | ||||
| 2025-05-02 | 13F | Capital A Wealth Management, LLC | 0 | −100,00 | 0 | |||||
| 2025-08-14 | 13F | Bank Of America Corp /de/ | 84 | −99,85 | 6 | −99,85 | ||||
| 2025-04-11 | 13F | Davis Capital Management | 93 | 0,00 | 5 | 0,00 | ||||
| 2025-08-29 | 13F | Centaurus Financial, Inc. | 1 738 | 0,00 | 0 | |||||
| 2025-08-11 | 13F | Principal Securities, Inc. | 5 734 | 10,02 | 394 | 40,21 | ||||
| 2025-08-11 | 13F | Citigroup Inc | 246 | 0,00 | 17 | 14,29 | ||||
| 2025-07-29 | 13F | Private Trust Co Na | 0 | −100,00 | 0 | |||||
| 2025-08-14 | 13F | GWM Advisors LLC | 7 339 | 73,58 | 505 | 104,88 | ||||
| 2025-07-24 | 13F | Trust Co Of Toledo Na /oh/ | 210 | 14 | ||||||
| 2025-08-06 | 13F | Commonwealth Equity Services, Llc | 24 537 | 1,60 | 2 | 0,00 | ||||
| 2025-08-12 | 13F | LPL Financial LLC | 628 377 | 18,72 | 43 207 | 40,14 | ||||
| 2025-08-08 | 13F | Kingsview Wealth Management, LLC | 153 279 | −4,39 | 10 539 | 12,86 | ||||
| 2025-08-14 | 13F | Snowden Capital Advisors LLC | 32 135 | 0,02 | 2 210 | 18,07 | ||||
| 2025-08-08 | 13F | Pnc Financial Services Group, Inc. | 0 | −100,00 | 0 | |||||
| 2025-07-14 | 13F | ABLE Financial Group, LLC | 7 253 | −1,57 | 499 | 16,08 | ||||
| 2025-08-04 | 13F | Assetmark, Inc | 149 046 | 13,07 | 10 248 | 33,47 | ||||
| 2025-07-17 | 13F | Janney Montgomery Scott LLC | 31 694 | −3,41 | 2 | 100,00 | ||||
| 2025-08-14 | 13F | Raymond James Financial Inc | 215 203 | −21,19 | 14 797 | −6,97 | ||||
| 2025-05-15 | 13F | Baird Financial Group, Inc. | 0 | −100,00 | 0 | |||||
| 2025-07-24 | 13F | Ronald Blue Trust, Inc. | 17 | 0,00 | 1 | |||||
| 2025-08-15 | 13F | Fsb Premier Wealth Management, Inc. | 25 429 | −17,43 | 1 748 | −2,51 | ||||
| 2025-07-18 | 13F | Truist Financial Corp | 34 311 | −5,40 | 2 359 | 11,70 | ||||
| 2025-08-14 | 13F | Comerica Bank | 21 558 | 42,24 | 1 482 | 68,03 | ||||
| 2025-07-24 | 13F | IFP Advisors, Inc | 41 417 | −2,58 | 2 848 | 14,98 | ||||
| 2025-05-15 | 13F | Integrated Wealth Concepts LLC | 0 | −100,00 | 0 | |||||
| 2025-07-16 | 13F | Formidable Asset Management, LLC | 3 745 | 0,00 | 218 | 0,00 | ||||
| 2025-05-14 | 13F | Caitlin John, LLC | 0 | −100,00 | 0 | |||||
| 2025-07-14 | 13F | GAMMA Investing LLC | 1 731 | −2,92 | 119 | 15,53 | ||||
| 2025-07-21 | 13F | Ameritas Advisory Services, LLC | 261 | 18 | ||||||
| 2025-08-13 | 13F | StoneX Group Inc. | 4 439 | −10,59 | 305 | 5,54 | ||||
| 2025-07-11 | 13F | Pinnacle Bancorp, Inc. | 400 | 0,00 | 28 | 17,39 | ||||
| 2025-07-28 | 13F | BRYN MAWR TRUST Co | 600 | 0,00 | 41 | 20,59 | ||||
| 2025-07-30 | 13F | BlueChip Wealth Advisors LLC | 5 763 | 0,00 | 396 | 18,21 | ||||
| 2025-07-02 | 13F | HBW Advisory Services LLC | 6 658 | −2,45 | 458 | 15,11 | ||||
| 2025-07-11 | 13F | Farther Finance Advisors, LLC | 27 385 | 2 548,45 | 1 883 | 3 038,33 | ||||
| 2025-08-01 | 13F | Rossby Financial, LCC | 1 409 | −0,49 | 97 | 12,94 | ||||
| 2025-08-06 | 13F | Prospera Financial Services Inc | 46 084 | −1,37 | 3 169 | 16,43 | ||||
| 2025-08-01 | 13F | Envestnet Asset Management Inc | 424 243 | −2,08 | 29 171 | 15,58 | ||||
| 2025-08-08 | 13F | 1776 Wealth LLC | 3 148 | 216 | ||||||
| 2025-08-13 | 13F | Jones Financial Companies Lllp | 3 754 | 106,49 | 256 | 141,51 | ||||
| 2025-07-25 | 13F | Atria Wealth Solutions, Inc. | 6 139 | −77,08 | 422 | −72,93 | ||||
| 2025-08-05 | 13F | Bank of New York Mellon Corp | 45 410 | −6,87 | 3 122 | 9,93 | ||||
| 2025-08-04 | 13F | IFG Advisory, LLC | 5 161 | 2,08 | 355 | 20,41 | ||||
| 2025-08-13 | 13F | Transce3nd, LLC | 144 | −11,11 | 10 | 0,00 | ||||
| 2025-08-08 | 13F | Glassman Wealth Services | 0 | −100,00 | 0 | |||||
| 2025-08-19 | 13F | National Asset Management, Inc. | 0 | −100,00 | 0 | |||||
| 2025-05-15 | 13F/A | Orion Portfolio Solutions, LLC | 28 863 | −1,73 | 1 681 | 5,86 | ||||
| 2025-08-18 | 13F | Geneos Wealth Management Inc. | 99 | −6,60 | 7 | 0,00 | ||||
| 2025-08-11 | 13F | NewEdge Wealth, LLC | 23 027 | −7,68 | 1 661 | 14,39 | ||||
| 2025-08-13 | 13F | Colonial Trust Advisors | 200 | 0,00 | 14 | 18,18 | ||||
| 2025-07-28 | 13F | Harbour Investments, Inc. | 8 857 | 6,69 | 609 | 26,09 | ||||
| 2025-08-07 | 13F | Allworth Financial LP | 170 | 12 | ||||||
| 2025-09-04 | 13F/A | Advisor Group Holdings, Inc. | 66 835 | 23,52 | 4 533 | 43,81 | ||||
| 2025-07-15 | 13F | Fifth Third Bancorp | 0 | −100,00 | 0 | |||||
| 2025-08-14 | 13F | Two Sigma Securities, Llc | 0 | −100,00 | 0 | |||||
| 2025-08-14 | 13F | Fmr Llc | 281 | −5,07 | 19 | 11,76 | ||||
| 2025-08-13 | 13F | First Trust Advisors Lp | 12 345 | −3,26 | 849 | 14,13 | ||||
| 2025-08-08 | 13F | Larson Financial Group LLC | 2 256 | −7,84 | 155 | 9,15 | ||||
| 2025-08-11 | 13F | SFI Advisors, LLC | 16 560 | −0,46 | 1 139 | 17,44 | ||||
| 2025-08-08 | 13F | Gts Securities Llc | 0 | −100,00 | 0 | |||||
| 2025-07-15 | 13F | LVZ Advisors, Inc. | 33 250 | −0,95 | 2 286 | 16,93 | ||||
| 2025-07-29 | 13F | Stratos Wealth Partners, LTD. | 10 158 | −2,28 | 698 | 15,37 | ||||
| 2025-08-14 | 13F | Mpwm Advisory Solutions, Llc | 7 095 | 488 | ||||||
| 2025-08-12 | 13F | MAI Capital Management | 220 | 0,00 | 15 | 25,00 | ||||
| 2025-08-26 | NP | FIRST TRUST VARIABLE INSURANCE TRUST - First Trust Dorsey Wright Tactical Core Portfolio Class I This fund is a listed as child fund of First Trust Advisors Lp and if that institution has disclosed ownership in this security, then these positions will not be double counted when calculating total shares and total value | 11 171 | −2,05 | 768 | 15,66 | ||||
| 2025-08-12 | 13F | Global Retirement Partners, LLC | 7 099 | −3,59 | 488 | 22,61 | ||||
| 2025-08-04 | 13F | Atria Investments Llc | 50 108 | −4,67 | 3 445 | 12,54 | ||||
| 2025-08-12 | 13F | Jpmorgan Chase & Co | 588 | 352,31 | 40 | 471,43 | ||||
| 2025-08-13 | 13F | Flow Traders U.s. Llc | 0 | −100,00 | 0 | |||||
| 2025-08-14 | 13F | CoreCap Advisors, LLC | 388 | 0,00 | 27 | 18,18 | ||||
| 2025-07-14 | 13F | Park Avenue Securities Llc | 24 316 | 2 | ||||||
| 2025-07-01 | 13F | Private Client Services, Llc | 4 370 | −1,47 | 300 | 16,28 | ||||
| 2025-08-19 | 13F | Newbridge Financial Services Group, Inc. | 275 | 19 | ||||||
| 2025-08-14 | 13F | Pinnacle Family Advisors, LLC | 8 043 | −2,60 | 553 | 14,97 | ||||
| 2025-05-28 | NP | TFAFX - Tactical Growth Allocation Fund Class I | 483 | 28 | ||||||
| 2025-08-12 | 13F | Steward Partners Investment Advisory, Llc | 138 | 0,00 | 9 | 12,50 | ||||
| 2025-08-05 | 13F | Sigma Planning Corp | 6 096 | 6,82 | 419 | 26,20 | ||||
| 2025-08-13 | 13F | GeoWealth Management, LLC | 2 708 | −0,77 | 186 | 17,72 | ||||
| 2025-08-06 | 13F | AE Wealth Management LLC | 44 616 | −23,06 | 3 068 | −9,18 | ||||
| 2025-07-23 | 13F | Element Wealth, LLC | 4 142 | −0,12 | 285 | 17,84 | ||||
| 2025-08-14 | 13F | Benjamin Edwards Inc | 106 772 | 197,89 | 7 342 | 251,75 | ||||
| 2025-08-14 | 13F | UBS Group AG | 218 467 | −0,51 | 15 022 | 17,44 | ||||
| 2025-07-15 | 13F | Traction Financial Partners, LLC | 7 456 | 513 | ||||||
| 2025-08-11 | 13F | Private Advisor Group, LLC | 13 781 | −22,94 | 948 | −9,03 | ||||
| 2025-07-23 | 13F | REAP Financial Group, LLC | 730 | 1,25 | 50 | 21,95 | ||||
| 2025-08-14 | 13F | Wells Fargo & Company/mn | 283 258 | 38,09 | 19 477 | 63,01 | ||||
| 2025-08-04 | 13F | Spire Wealth Management | 19 | 0,00 | 1 | 0,00 | ||||
| 2025-08-01 | 13F | Brookwood Investment Group LLC | 0 | −100,00 | 0 | |||||
| 2025-08-12 | 13F | Proequities, Inc. | 0 | 0 | ||||||
| 2025-08-14 | 13F | Susquehanna International Group, Llp | 64 000 | 4 401 | ||||||
| 2025-07-16 | 13F | American National Bank | 78 | 0,00 | 5 | 25,00 | ||||
| 2025-07-15 | 13F | FLP Wealth Management, LLC | 0 | −100,00 | 0 | |||||
| 2025-07-24 | 13F | Cyndeo Wealth Partners, LLC | 10 153 | 0,00 | 698 | 18,10 | ||||
| 2025-08-15 | 13F | Morgan Stanley | 1 027 689 | −1,75 | 70 664 | 15,98 | ||||
| 2025-07-14 | 13F | Signature Securities Group Corporation | 11 122 | −3,20 | 765 | 14,20 | ||||
| 2025-07-24 | 13F | Us Bancorp \de\ | 6 928 | 476 | ||||||
| 2025-07-25 | 13F | Cwm, Llc | 40 521 | 111,47 | 3 | 100,00 | ||||
| 2025-08-13 | 13F | Northwestern Mutual Wealth Management Co | 938 | 64 | ||||||
| 2025-08-15 | 13F | Kestra Advisory Services, LLC | 13 788 | 1,64 | 948 | 20,00 | ||||
| 2025-08-05 | 13F | EPG Wealth Management LLC | 0 | −100,00 | 0 | |||||
| 2025-08-12 | 13F | CIBC Private Wealth Group, LLC | 51 | 4 | ||||||
| 2025-08-12 | 13F | OneAscent Financial Services LLC | 27 278 | −0,95 | 2 | 0,00 | ||||
| 2025-08-14 | 13F | Mml Investors Services, Llc | 16 617 | 1,19 | 1 | |||||
| 2025-07-25 | 13F | Envestnet Portfolio Solutions, Inc. | 11 140 | −65,75 | 766 | −59,61 | ||||
| 2025-07-30 | 13F | D.a. Davidson & Co. | 17 863 | −0,33 | 1 228 | 17,74 | ||||
| 2025-07-23 | 13F | TPG Financial Advisors, LLC | 58 659 | 0,66 | 4 033 | 18,83 | ||||
| 2025-07-31 | 13F | Cambridge Investment Research Advisors, Inc. | 204 862 | 81,66 | 14 | 133,33 | ||||
| 2025-07-11 | 13F | SILVER OAK SECURITIES, Inc | 15 661 | 1,27 | 1 077 | 18,63 | ||||
| 2025-05-16 | 13F/A | Kestra Investment Management, LLC | 0 | −100,00 | 0 | |||||
| 2025-08-04 | 13F | Arkadios Wealth Advisors | 8 486 | −12,29 | 584 | 3,55 | ||||
| 2025-07-25 | 13F | Apollon Wealth Management, LLC | 5 523 | −1,46 | 380 | 16,26 | ||||
| 2025-08-15 | 13F | Captrust Financial Advisors | 9 072 | −21,08 | 624 | −6,88 | ||||
| 2025-08-07 | 13F | PFG Advisors | 9 779 | −39,04 | 672 | −28,05 | ||||
| 2025-08-14 | 13F | Royal Bank Of Canada | 192 379 | −3,65 | 13 227 | 13,72 | ||||
| 2025-07-29 | 13F | Chicago Partners Investment Group LLC | 3 502 | −4,55 | 251 | 10,13 | ||||
| 2025-07-28 | 13F | RFG Advisory, LLC | 6 443 | −0,46 | 443 | 17,51 | ||||
| 2025-08-08 | 13F | Cetera Investment Advisers | 172 136 | −3,34 | 11 836 | 14,10 | ||||
| 2025-08-20 | 13F/A | Coppell Advisory Solutions LLC | 41 054 | −18,41 | 2 803 | −8,96 | ||||
| 2025-08-05 | 13F | Huntington National Bank | 40 | 18,18 | ||||||
| 2025-07-14 | 13F | Iams Wealth Management, Llc | 20 606 | −9,12 | 1 417 | 7,27 | ||||
| 2025-07-21 | 13F | Synergy Financial Management, LLC | 0 | −100,00 | 0 | |||||
| 2025-08-08 | 13F | Creative Planning | 2 969 | 204 | ||||||
| 2025-08-14 | 13F | Jane Street Group, Llc | 0 | −100,00 | 0 | |||||
| 2025-08-14 | 13F | LaSalle St. Investment Advisors, LLC | 7 376 | 2,03 | 1 | |||||
| 2025-08-08 | 13F | Petix & Botte Co | 3 972 | 0,00 | 273 | 18,18 | ||||
| 2025-05-15 | 13F | Mariner, LLC | 0 | −100,00 | 0 | |||||
| 2025-08-12 | 13F | SRS Capital Advisors, Inc. | 240 | 0,00 | 17 | 23,08 | ||||
| 2025-08-13 | 13F | Gateway Wealth Partners, LLC | 29 251 | −15,25 | 2 011 | 0,05 | ||||
| 2025-08-04 | 13F | Waterfront Wealth Inc. | 10 640 | −4,06 | 732 | 13,33 | ||||
| 2025-07-17 | 13F | Mainsail Financial Group, LLC | 80 716 | 0,73 | 5 524 | 18,36 | ||||
| 2025-08-11 | 13F | Synergy Investment Management, LLC | 0 | −100,00 | 0 | |||||
| 2025-08-14 | 13F | Stifel Financial Corp | 100 953 | 181,50 | 6 941 | 232,42 |
Other Listings
| MX:FDT |