Grundläggande statistik
| Institutionella ägare | 251 total, 251 long only, 0 short only, 0 long/short - change of −8,06% MRQ |
| Genomsnittlig portföljallokering | 0.0750 % - change of −13,82% MRQ |
| Institutionella aktier (lång) | 3 176 863 (ex 13D/G) - change of −0,25MM shares −7,25% MRQ |
| Institutionellt värde (lång) | $ 492 406 USD ($1000) |
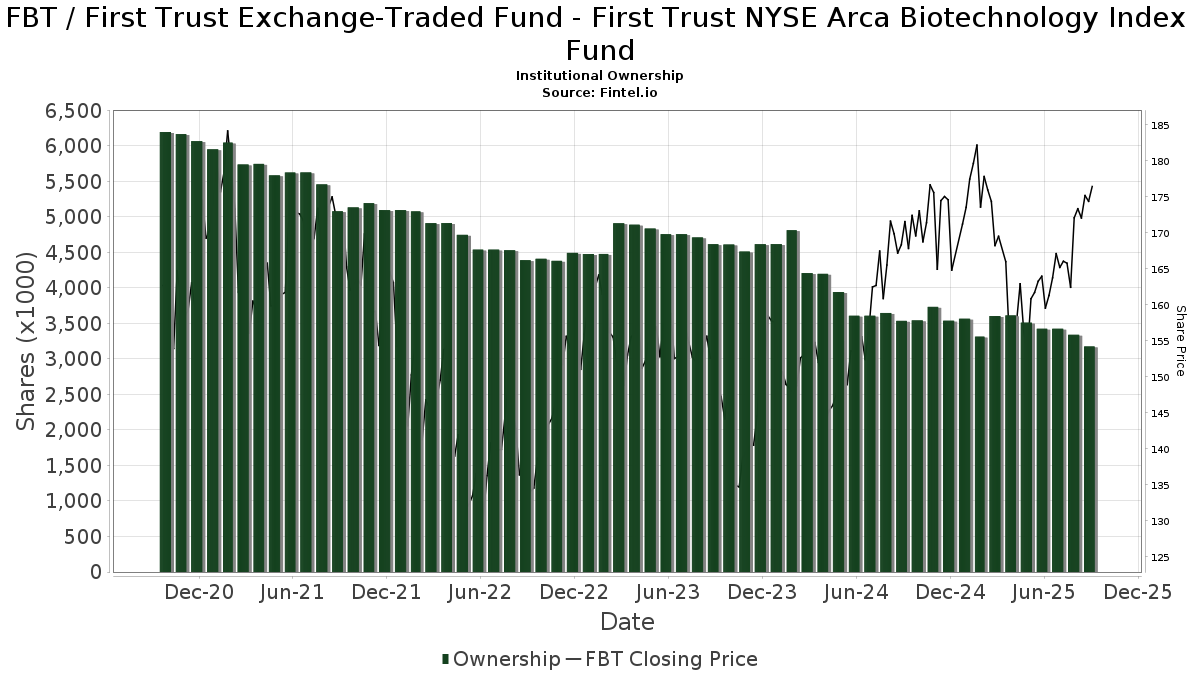
Institutionellt ägande och aktieägare
First Trust Exchange-Traded Fund - First Trust NYSE Arca Biotechnology Index Fund (US:FBT) har 251 Institutionella ägare och aktieägare som har lämnat in 13D/G- eller 13F-formulär till Securities Exchange Commission (SEC). Dessa institut innehar totalt 3,176,863 aktier. Största aktieägare inkluderar Morgan Stanley, LPL Financial LLC, Bank Of America Corp /de/, Wells Fargo & Company/mn, UBS Group AG, Royal Bank Of Canada, Raymond James Financial Inc, Envestnet Asset Management Inc, Berger Financial Group, Inc, and Goldman Sachs Group Inc .
First Trust Exchange-Traded Fund - First Trust NYSE Arca Biotechnology Index Fund (ARCA:FBT) Institutionell ägarstruktur visar institutioners och fonders nuvarande positioner i företaget, samt de senaste förändringarna i positionernas storlek. Större aktieägare kan vara enskilda investerare, fonder, hedgefonder eller institutioner. Bilaga 13D visar att investeraren äger (eller ägde) mer än 5% av företaget och avser (eller avsåg) att aktivt eftersträva en förändring av affärsstrategin. Schedule 13G indikerar en passiv investering på över 5%.
The share price as of September 12, 2025 is 174,77 / share. Previously, on September 16, 2024, the share price was 171,98 / share. This represents an increase of 1,62% over that period.
Fondsentimentets poäng
Fondsentimentet poängen(fka Ägarackumulation-poäng) visar vilka aktier som är mest köpta av fonder. Det är resultatet av en sofistikerad kvantitativ flerfaktormodell som identifierar företag med de högsta nivåerna av institutionell ackumulering. Poängsättningsmodellen använder en kombination av den totala ökningen av redovisade ägare, förändringarna i portföljallokeringarna för dessa ägare och andra mått. Siffran sträcker sig från 0 till 100, där högre siffror indikerar en högre nivå av ackumulering i förhållande till sina konkurrenter, och 50 är genomsnittet.
Uppdateringsfrekvens: Dagligen
Se Ownership Explorer, som innehåller en lista över de högst rankade företagen.
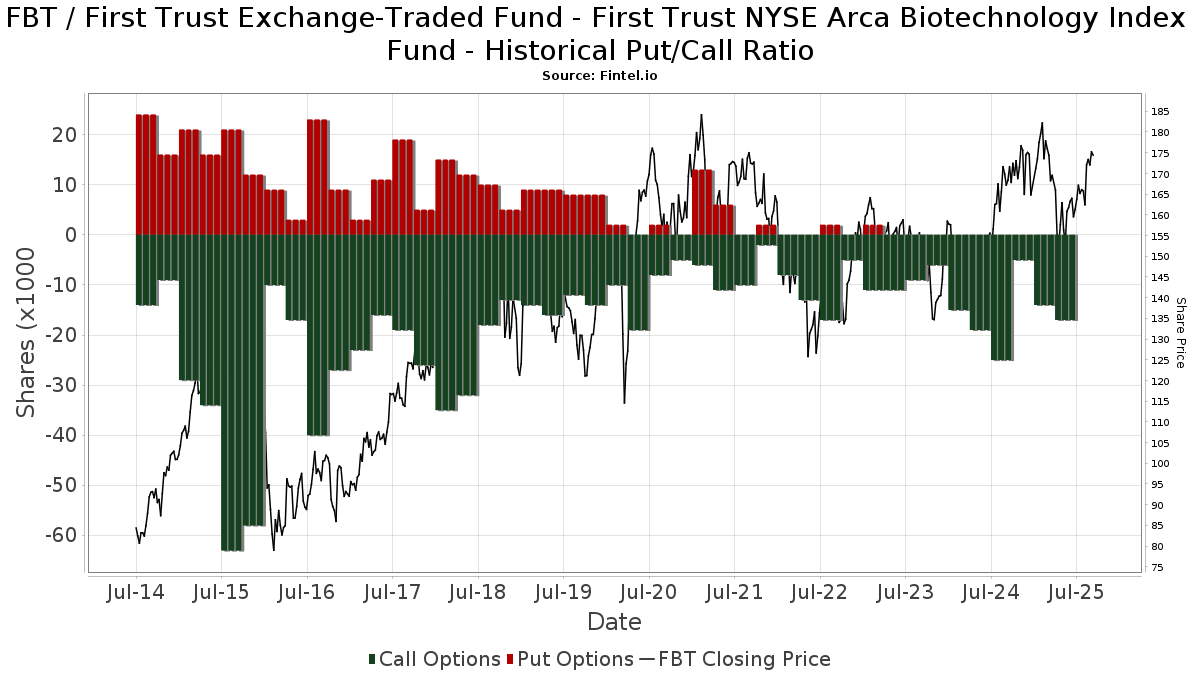
Institutionell sälj/köp-kvot
Förutom att rapportera vanliga eget kapital- och skuldemissioner måste institutioner med mer än 100MM tillgångar under förvaltning också avslöja sina innehav av sälj- och köpoptioner. Eftersom säljoptioner i allmänhet indikerar ett negativt sentiment och köpoptioner indikerar ett positivt sentiment, kan vi få en uppfattning om det övergripande institutionella sentimentet genom att plotta förhållandet mellan säljoptioner och köpoptioner. Diagrammet till höger visar det historiska förhållandet mellan sälj- och köpoptioner för detta instrument.
Genom att använda sälj/köp-kvoten som en indikator på aktieägarnas sentiment undviker man en av de största bristerna med att använda det totala institutionella ägandet, nämligen att en betydande del av de förvaltade tillgångarna investeras passivt för att följa index. Passivt förvaltade fonder köper vanligtvis inte optioner, så indikatorn för sälj/köp-kvoten ger en bättre bild av stämningen i aktivt förvaltade fonder.
13F- och NPORT-arkiveringar
Detaljer om 13F-arkiveringar är gratis. Detaljer om NP-arkiveringar kräver ett premiummedlemskap. Gröna rader indikerar nya positioner. Röda rader indikerar stängda positioner. Klicka på länk symbolen för att se hela transaktionshistoriken.
Uppgradera
för att låsa upp premiumdata och exportera till Excel ![]() .
.
| Fil Datum | Källa | Investerare | Typ | Genomsnittligt pris (beräknat) |
Aktier | Δ Aktier (%) |
Rapporterat värde (1000 USD) |
Δ Värde (%) |
Portföljallokering (%) |
|
|---|---|---|---|---|---|---|---|---|---|---|
| 2025-08-05 | 13F | Tsfg, Llc | 441 | 0,00 | 0 | |||||
| 2025-08-04 | 13F | Kovack Advisors, Inc. | 1 568 | −3,09 | 253 | −8,36 | ||||
| 2025-08-13 | 13F | Brown Advisory Inc | 10 489 | 0,00 | 1 692 | −5,16 | ||||
| 2025-05-15 | 13F/A | Orion Portfolio Solutions, LLC | 18 483 | 236,54 | 1 657 | 81,58 | ||||
| 2025-08-07 | 13F | Kestra Private Wealth Services, Llc | 8 984 | 2,98 | 1 449 | −2,36 | ||||
| 2025-04-11 | 13F | Davis Capital Management | 22 | 0,00 | 4 | 0,00 | ||||
| 2025-08-13 | 13F | Summit Financial, LLC | 3 704 | −51,64 | 598 | −54,15 | ||||
| 2025-08-12 | 13F | Park Square Financial Group, LLC | 244 | −61,76 | 39 | −63,89 | ||||
| 2025-08-14 | 13F | Comerica Bank | 1 339 | 4,20 | 216 | −1,38 | ||||
| 2025-08-12 | 13F | Resolute Wealth Strategies, LLC | 0 | −100,00 | 0 | |||||
| 2025-08-12 | 13F | Jacobi Capital Management LLC | 1 374 | −1,43 | 222 | −6,75 | ||||
| 2025-08-14 | 13F | Main Street Financial Solutions, LLC | 0 | −100,00 | 0 | |||||
| 2025-07-10 | 13F | Sovran Advisors, LLC | 1 599 | 3,23 | 263 | 11,49 | ||||
| 2025-08-14 | 13F | Goldman Sachs Group Inc | 55 052 | 37,10 | 8 882 | 30,03 | ||||
| 2025-08-07 | 13F | PFG Advisors | 1 741 | −35,37 | 281 | −38,86 | ||||
| 2025-07-08 | 13F | Webster Bank, N. A. | 238 | 0,00 | 38 | −5,00 | ||||
| 2025-08-14 | 13F | Avenir Tech Ltd | 1 | 0,00 | 0 | |||||
| 2025-07-17 | 13F | Janney Montgomery Scott LLC | 28 270 | 1,37 | 5 | 0,00 | ||||
| 2025-07-17 | 13F | Beacon Capital Management, LLC | 80 | 0,00 | 13 | −7,69 | ||||
| 2025-08-12 | 13F | SRS Capital Advisors, Inc. | 5 537 | 1,10 | 893 | −4,08 | ||||
| 2025-07-22 | 13F | Mascoma Wealth Management LLC | 98 | 0,00 | 16 | −6,25 | ||||
| 2025-07-07 | 13F | Thurston, Springer, Miller, Herd & Titak, Inc. | 1 257 | −0,63 | 203 | −5,58 | ||||
| 2025-07-28 | 13F | RFG Advisory, LLC | 1 407 | −28,25 | 227 | −31,83 | ||||
| 2025-04-10 | 13F | Richard P Slaughter Associates Inc | 0 | −100,00 | 0 | |||||
| 2025-08-11 | 13F | Covestor Ltd | 13 | 0,00 | 0 | |||||
| 2025-08-11 | 13F | Citigroup Inc | 12 161 | −3,59 | 1 962 | −8,58 | ||||
| 2025-08-04 | 13F | Pensionmark Financial Group, Llc | 8 134 | 4,14 | 1 312 | −1,20 | ||||
| 2025-07-14 | 13F | Sowell Financial Services LLC | 1 629 | −2,34 | 263 | −7,42 | ||||
| 2025-09-04 | 13F/A | Advisor Group Holdings, Inc. | 37 843 | −9,01 | 6 108 | −13,72 | ||||
| 2025-08-11 | 13F | Synergy Investment Management, LLC | 0 | −100,00 | 0 | |||||
| 2025-08-12 | 13F | NFP Retirement, Inc. | 6 725 | 0,00 | 1 085 | −5,24 | ||||
| 2025-08-12 | 13F | Steward Partners Investment Advisory, Llc | 1 664 | −39,80 | 269 | −42,98 | ||||
| 2025-08-12 | 13F | LPL Financial LLC | 193 773 | 5,42 | 31 261 | −0,03 | ||||
| 2025-04-24 | 13F | Kraft, Davis & Associates, LLC | 0 | −100,00 | 0 | |||||
| 2025-08-06 | 13F | Savant Capital, LLC | 0 | −100,00 | 0 | |||||
| 2025-08-15 | 13F | Puff Wealth Management, Llc | 1 308 | −24,31 | 211 | −28,23 | ||||
| 2025-07-29 | 13F | Koshinski Asset Management, Inc. | 3 086 | −2,31 | 498 | −7,45 | ||||
| 2025-08-11 | 13F | GKV Capital Management Co., Inc. | 0 | −100,00 | 0 | −100,00 | ||||
| 2025-07-14 | 13F | GAMMA Investing LLC | 566 | 0,00 | 91 | −5,21 | ||||
| 2025-08-04 | 13F | Daymark Wealth Partners, Llc | 5 751 | 9,52 | 928 | 3,81 | ||||
| 2025-08-08 | 13F | Capital Investment Advisory Services, LLC | 111 | −68,56 | 18 | −71,67 | ||||
| 2025-08-06 | 13F | Commonwealth Equity Services, Llc | 35 769 | −9,42 | 6 | −16,67 | ||||
| 2025-08-13 | 13F | Stablepoint Partners, LLC | 4 468 | 3,00 | 721 | −2,31 | ||||
| 2025-08-12 | 13F | Quantum Private Wealth, LLC | 5 060 | −26,49 | 816 | −30,26 | ||||
| 2025-07-21 | 13F | Ameritas Advisory Services, LLC | 36 463 | −5,11 | 5 883 | −9,99 | ||||
| 2025-08-11 | 13F | United Advisor Group, LLC | 0 | −100,00 | 0 | |||||
| 2025-07-14 | 13F | Clear Harbor Asset Management, LLC | 8 132 | −5,80 | 1 312 | −10,69 | ||||
| 2025-08-13 | 13F | Dynamic Wealth Strategies, LLC | 465 | 0,00 | 75 | −5,06 | ||||
| 2025-08-13 | 13F | Northwestern Mutual Wealth Management Co | 12 413 | −3,45 | 2 003 | −8,46 | ||||
| 2025-08-01 | 13F | Rossby Financial, LCC | 65 | 0,00 | 10 | 0,00 | ||||
| 2025-07-10 | 13F | Global Financial Private Client, LLC | 0 | −100,00 | 0 | |||||
| 2025-08-12 | 13F | Coldstream Capital Management Inc | 0 | −100,00 | 0 | |||||
| 2025-08-14 | 13F | Mariner, LLC | 2 725 | 116,61 | 440 | 105,14 | ||||
| 2025-07-17 | 13F | Global Trust Asset Management, LLC | 80 | 0,00 | 13 | −7,69 | ||||
| 2025-08-06 | 13F | RFG - Bristol Wealth Advisors, LLC | 0 | −100,00 | 0 | |||||
| 2025-08-08 | 13F | Creative Planning | 4 473 | 22,35 | 722 | 15,92 | ||||
| 2025-07-31 | 13F | Hartford Financial Management Inc. | 30 597 | −3,19 | 4 936 | −8,18 | ||||
| 2025-08-11 | 13F | Hexagon Capital Partners LLC | 0 | −100,00 | 0 | |||||
| 2025-08-15 | 13F | Morgan Stanley | 345 245 | −4,25 | 55 699 | −9,19 | ||||
| 2025-08-13 | 13F | Luminist Capital LLC | 1 | 0,00 | 0 | |||||
| 2025-08-14 | 13F | Wharton Business Group, LLC | 0 | −100,00 | 0 | |||||
| 2025-08-05 | 13F | GPS Wealth Strategies Group, LLC | 2 733 | 16,00 | 441 | 10,00 | ||||
| 2025-08-14 | 13F | Headlands Technologies LLC | 55 | 0,00 | 9 | −11,11 | ||||
| 2025-07-31 | 13F | Oppenheimer & Co Inc | 2 958 | −49,77 | 477 | −52,35 | ||||
| 2025-08-11 | 13F | SFI Advisors, LLC | 23 797 | −4,71 | 3 839 | −9,63 | ||||
| 2025-08-14 | 13F | C M Bidwell & Associates Ltd | 75 | 0,00 | 12 | 0,00 | ||||
| 2025-07-28 | 13F | Mutual Advisors, LLC | 5 206 | 2,00 | 865 | 6,27 | ||||
| 2025-08-14 | 13F | Great Valley Advisor Group, Inc. | 3 547 | −3,74 | 573 | −8,77 | ||||
| 2025-08-14 | 13F | Colony Group, LLC | 0 | −100,00 | 0 | |||||
| 2025-07-25 | 13F | Cwm, Llc | 5 387 | −4,86 | 1 | |||||
| 2025-08-06 | 13F | Adviser Investments LLC | 4 431 | −12,55 | 715 | −17,07 | ||||
| 2025-07-24 | 13F | Robertson Stephens Wealth Management, LLC | 3 677 | 18,57 | 593 | 12,52 | ||||
| 2025-08-14 | 13F | GWM Advisors LLC | 5 481 | 9,95 | 884 | 4,37 | ||||
| 2025-08-13 | 13F | Cerity Partners LLC | 0 | −100,00 | 0 | |||||
| 2025-07-08 | 13F | Atwood & Palmer Inc | 75 | 0,00 | 12 | 0,00 | ||||
| 2025-07-23 | 13F | Clear Creek Financial Management, LLC | 2 664 | −34,61 | 430 | −38,01 | ||||
| 2025-08-14 | 13F | Fmr Llc | 983 | −18,49 | 159 | −22,93 | ||||
| 2025-07-17 | 13F | Independence Bank of Kentucky | 200 | 0,00 | 32 | −5,88 | ||||
| 2025-08-01 | 13F | Envestnet Asset Management Inc | 120 485 | 4,28 | 19 438 | −1,11 | ||||
| 2025-08-12 | 13F | Founders Financial Alliance, LLC | 0 | −100,00 | 0 | |||||
| 2025-07-14 | 13F | Hoey Investments, Inc | 15 | 0,00 | 2 | 0,00 | ||||
| 2025-07-22 | 13F | Belpointe Asset Management LLC | 1 252 | 0,00 | 202 | −5,16 | ||||
| 2025-08-12 | 13F | Franklin Resources Inc | 89 | 14 | ||||||
| 2025-08-14 | 13F | Royal Bank Of Canada | 153 673 | −3,22 | 24 792 | −8,22 | ||||
| 2025-07-14 | 13F | Signature Securities Group Corporation | 3 906 | −0,41 | 630 | −5,55 | ||||
| 2025-08-11 | 13F | Novak & Powell Financial Services, Inc. | 1 512 | 0,00 | 244 | −5,45 | ||||
| 2025-07-16 | 13F | RWM Asset Management, LLC | 1 938 | 0,00 | 313 | −5,17 | ||||
| 2025-08-13 | 13F | Twin Peaks Wealth Advisors, LLC | 2 054 | −2,84 | 343 | 4,57 | ||||
| 2025-07-30 | 13F | Financial Perspectives, Inc | 148 | 0,00 | 24 | −8,00 | ||||
| 2025-04-10 | 13F | Clarus Wealth Advisors | 0 | −100,00 | 0 | |||||
| 2025-08-08 | 13F | Pnc Financial Services Group, Inc. | 894 | −16,45 | 144 | −20,88 | ||||
| 2025-05-09 | 13F | Altfest L J & Co Inc | 0 | −100,00 | 0 | |||||
| 2025-08-15 | 13F | Kestra Advisory Services, LLC | 16 286 | −2,02 | 2 627 | −7,07 | ||||
| 2025-08-12 | 13F | BlackRock, Inc. | 3 297 | −1,23 | 532 | −6,35 | ||||
| 2025-07-01 | 13F | Harbor Investment Advisory, Llc | 615 | 0,00 | 99 | −4,81 | ||||
| 2025-08-04 | 13F | Center for Financial Planning, Inc. | 175 | 0,00 | 28 | −3,45 | ||||
| 2025-05-06 | 13F | Venturi Wealth Management, LLC | 0 | −100,00 | 0 | |||||
| 2025-08-12 | 13F | RPG Investment Advisory, LLC | 24 771 | −52,45 | 3 996 | −54,91 | ||||
| 2025-07-29 | 13F | Stratos Wealth Partners, LTD. | 1 621 | 3,84 | 262 | −1,51 | ||||
| 2025-07-21 | 13F | Barrett & Company, Inc. | 905 | −5,73 | 146 | −10,43 | ||||
| 2025-07-24 | 13F | McKinley Carter Wealth Services, Inc. | 7 358 | 0,00 | 1 187 | −5,12 | ||||
| 2025-08-15 | 13F | Captrust Financial Advisors | 4 028 | −3,03 | 650 | −8,07 | ||||
| 2025-08-07 | 13F | Allworth Financial LP | 5 993 | 19,50 | 967 | 20,15 | ||||
| 2025-08-06 | 13F | Texas Yale Capital Corp. | 9 300 | 0,00 | 1 500 | −5,18 | ||||
| 2025-07-23 | 13F | REAP Financial Group, LLC | 980 | 0,00 | 158 | −4,82 | ||||
| 2025-08-14 | 13F | Snowden Capital Advisors LLC | 6 243 | −7,37 | 1 007 | −12,13 | ||||
| 2025-08-14 | 13F | Stifel Financial Corp | 45 577 | 7,91 | 7 353 | 2,34 | ||||
| 2025-08-04 | 13F | Creative Financial Designs Inc /adv | 356 | 8,21 | 57 | 1,79 | ||||
| 2025-07-25 | 13F | Sequoia Financial Advisors, LLC | 1 625 | −8,45 | 262 | −12,96 | ||||
| 2025-07-28 | 13F | Arlington Financial Advisors, LLC | 26 710 | 4 309 | ||||||
| 2025-07-08 | 13F | Nbc Securities, Inc. | 1 130 | −17,28 | 0 | |||||
| 2025-07-30 | 13F | Whittier Trust Co Of Nevada Inc | 85 | −19,05 | 14 | −23,53 | ||||
| 2025-07-22 | 13F | Berger Financial Group, Inc | 113 019 | 1,84 | 18 233 | −3,42 | ||||
| 2025-07-17 | 13F | Tritonpoint Wealth, Llc | 2 280 | 0,00 | 368 | −5,17 | ||||
| 2025-07-08 | 13F | Juncture Wealth Strategies, Llc | 11 073 | −3,73 | 1 786 | −8,69 | ||||
| 2025-08-12 | 13F | Global Retirement Partners, LLC | 2 108 | −9,64 | 340 | −12,14 | ||||
| 2025-08-12 | 13F | O'shaughnessy Asset Management, Llc | 25 | 0,00 | 4 | 0,00 | ||||
| 2025-07-21 | 13F | Cornell Pochily Investment Advisors, Inc. | 0 | −100,00 | 0 | |||||
| 2025-07-25 | 13F | Hazlett, Burt & Watson, Inc. | 100 | 0 | ||||||
| 2025-08-12 | 13F | Jpmorgan Chase & Co | 13 716 | −6,71 | 2 213 | −11,56 | ||||
| 2025-08-14 | 13F | Sherman Asset Management, Inc. | 0 | −100,00 | 0 | |||||
| 2025-08-06 | 13F | AE Wealth Management LLC | 11 063 | −9,98 | 1 785 | −14,64 | ||||
| 2025-08-08 | 13F | Meridian Wealth Management, LLC | 3 498 | 0,00 | 564 | −5,21 | ||||
| 2025-08-18 | 13F | Pacific Center for Financial Services | 52 | 0,00 | 8 | 0,00 | ||||
| 2025-07-16 | 13F | Diversified Enterprises, LLC | 2 417 | 0,00 | 390 | −5,35 | ||||
| 2025-07-31 | 13F | Cambridge Investment Research Advisors, Inc. | 35 338 | 13,77 | 6 | 0,00 | ||||
| 2025-08-14 | 13F | Sunbelt Securities, Inc. | 90 | 5,88 | 15 | 0,00 | ||||
| 2025-08-05 | 13F | Sigma Planning Corp | 1 282 | −10,10 | 207 | −14,88 | ||||
| 2025-07-15 | 13F | MCF Advisors LLC | 120 | 0,00 | 19 | −5,00 | ||||
| 2025-08-14 | 13F | UBS Group AG | 160 352 | −20,32 | 25 870 | −24,43 | ||||
| 2025-08-08 | 13F | TD Capital Management LLC | 1 148 | 0,00 | 185 | −5,13 | ||||
| 2025-08-15 | 13F | CI Private Wealth, LLC | 4 290 | 692 | ||||||
| 2025-08-11 | 13F | Western Wealth Management, LLC | 0 | −100,00 | 0 | |||||
| 2025-08-08 | 13F | Hartland & Co., LLC | 1 179 | 0,00 | 190 | −5,00 | ||||
| 2025-08-13 | 13F | Transce3nd, LLC | 13 | −27,78 | 2 | −33,33 | ||||
| 2025-08-14 | 13F | Citadel Advisors Llc | Put | 0 | −100,00 | 0 | ||||
| 2025-08-13 | 13F | Beacon Pointe Advisors, LLC | 7 076 | 8,06 | 1 142 | 2,52 | ||||
| 2025-07-10 | 13F | American Financial Advisors, LLC | 2 057 | 0,00 | 332 | −5,16 | ||||
| 2025-07-28 | 13F | Harbour Investments, Inc. | 5 767 | 1,21 | 930 | −4,02 | ||||
| 2025-08-08 | 13F | New England Capital Financial Advisors LLC | 97 | 0,00 | 16 | −6,25 | ||||
| 2025-08-14 | 13F | Ancora Advisors, LLC | 9 756 | −0,24 | 1 574 | −5,41 | ||||
| 2025-07-17 | 13F | Wagner Wealth Management, Llc | 177 | −2,75 | 29 | −6,67 | ||||
| 2025-08-14 | 13F | IHT Wealth Management, LLC | 1 348 | 0,00 | 217 | −5,24 | ||||
| 2025-05-01 | 13F | Quest 10 Wealth Builders, Inc. | 16 | 0,00 | 3 | 0,00 | ||||
| 2025-05-05 | 13F | OneAscent Financial Services LLC | 0 | −100,00 | 0 | |||||
| 2025-07-24 | 13F | Stonebridge Financial Group, LLC | 0 | −100,00 | 0 | |||||
| 2025-08-08 | 13F | Cetera Investment Advisers | 45 416 | 4,92 | 7 327 | −0,50 | ||||
| 2025-08-20 | 13F | Forefront Wealth Partners, LLC | 3 115 | 507 | ||||||
| 2025-07-25 | 13F | Apollon Wealth Management, LLC | 3 864 | −9,21 | 623 | −13,95 | ||||
| 2025-08-15 | 13F | Tower Research Capital LLC (TRC) | 9 | 350,00 | 1 | |||||
| 2025-07-24 | 13F | WMG Financial Advisors, LLC | 2 896 | −12,38 | 467 | −16,90 | ||||
| 2025-08-05 | 13F | Plante Moran Financial Advisors, LLC | 37 | 0,00 | 6 | −16,67 | ||||
| 2025-07-14 | 13F | Iams Wealth Management, Llc | 5 897 | 11,24 | 951 | 5,55 | ||||
| 2025-08-11 | 13F | Independent Advisor Alliance | 28 242 | 17,24 | 4 556 | 11,18 | ||||
| 2025-08-11 | 13F | Wbi Investments, Inc. | 1 500 | 242 | ||||||
| 2025-07-30 | 13F | Pacific Sun Financial Corp | 8 100 | −3,40 | 1 307 | −8,42 | ||||
| 2025-08-14 | 13F | Raymond James Financial Inc | 144 291 | −7,80 | 23 278 | −12,56 | ||||
| 2025-07-21 | 13F | Mechanics Financial Corp | 122 | 0,00 | 20 | −5,00 | ||||
| 2025-07-09 | 13F | WealthCare Investment Partners, LLC | 1 476 | −0,07 | 242 | 8,52 | ||||
| 2025-07-22 | 13F/A | Kingstone Capital Partners Texas, LLC | 1 552 | −7,51 | 250 | −12,28 | ||||
| 2025-07-18 | 13F | Truist Financial Corp | 45 234 | 12,81 | 7 298 | 6,98 | ||||
| 2025-08-14 | 13F | Wells Fargo & Company/mn | 189 117 | −3,30 | 30 510 | −8,29 | ||||
| 2025-07-23 | 13F | Morey & Quinn Wealth Partners, LLC | 3 238 | −0,52 | 522 | −5,61 | ||||
| 2025-07-25 | 13F | Envestnet Portfolio Solutions, Inc. | 1 511 | −70,41 | 244 | −72,00 | ||||
| 2025-07-24 | 13F | Blair William & Co/il | 325 | 0,00 | 52 | −5,45 | ||||
| 2025-05-02 | 13F | Cullen/frost Bankers, Inc. | 0 | −100,00 | 0 | |||||
| 2025-08-12 | 13F | CIBC Private Wealth Group, LLC | 18 | −88,00 | 3 | −90,48 | ||||
| 2025-08-14 | 13F | Synovus Financial Corp | 2 134 | 57,37 | 344 | 49,57 | ||||
| 2025-08-05 | 13F | Dunhill Financial, LLC | 9 | 0,00 | 1 | 0,00 | ||||
| 2025-07-22 | 13F | Cedar Mountain Advisors, LLC | 244 | 0,00 | 39 | −4,88 | ||||
| 2025-08-11 | 13F | TD Waterhouse Canada Inc. | 34 622 | −5,71 | 5 611 | −7,04 | ||||
| 2025-08-14 | 13F | Guardian Wealth Advisors, Llc / Nc | 2 | 0,00 | 0 | |||||
| 2025-07-30 | 13F | Strategic Blueprint, LLC | 0 | −100,00 | 0 | |||||
| 2025-07-30 | 13F | D.a. Davidson & Co. | 38 830 | −2,53 | 6 264 | −7,56 | ||||
| 2025-08-07 | 13F | 1st Source Bank | 3 757 | −13,31 | 606 | −17,77 | ||||
| 2025-08-14 | 13F | Wiley Bros.-aintree Capital, Llc | 6 767 | 138,53 | 1 092 | 133,62 | ||||
| 2025-07-24 | 13F | IFP Advisors, Inc | 10 288 | −1,44 | 1 660 | −6,54 | ||||
| 2025-07-28 | 13F | Private Wealth Asset Management, LLC | 30 | 5 | ||||||
| 2025-08-12 | 13F | Ameritas Investment Partners, Inc. | 125 | 0,00 | 20 | −4,76 | ||||
| 2025-07-15 | 13F | North Star Investment Management Corp. | 75 | 0,00 | 12 | 0,00 | ||||
| 2025-07-16 | 13F | EdgeRock Capital LLC | 1 244 | −28,79 | 201 | −32,66 | ||||
| 2025-08-13 | 13F | Summit Wealth Group Llc / Co | 2 165 | 349 | ||||||
| 2025-07-08 | 13F | Davis Investment Partners, LLC | 4 700 | 0,00 | 762 | 3,96 | ||||
| 2025-08-06 | 13F | Moors & Cabot, Inc. | 1 517 | −73,91 | 245 | −75,33 | ||||
| 2025-08-12 | 13F | J.w. Cole Advisors, Inc. | 0 | −100,00 | 0 | |||||
| 2025-08-06 | 13F | Eukles Asset Management | 212 | 0,00 | 34 | −5,56 | ||||
| 2025-08-13 | 13F | Jones Financial Companies Lllp | 8 275 | 5,44 | 1 335 | 3,17 | ||||
| 2025-08-14 | 13F | Moneta Group Investment Advisors Llc | 0 | −100,00 | 0 | |||||
| 2025-07-29 | 13F | Harbor Asset Planning, Inc. | 77 | 12 | ||||||
| 2025-08-13 | 13F | Capital Analysts, Inc. | 118 | −71,77 | 0 | |||||
| 2025-07-25 | 13F | Atria Wealth Solutions, Inc. | 2 802 | −55,66 | 452 | −57,91 | ||||
| 2025-08-12 | 13F | Archer Investment Corp | 10 | 0,00 | 2 | 0,00 | ||||
| 2025-08-08 | 13F | Avantax Advisory Services, Inc. | 6 762 | 12,55 | 1 091 | 6,65 | ||||
| 2025-08-14 | 13F | MGB Wealth Management, LLC | 1 479 | 0,00 | 239 | −5,18 | ||||
| 2025-07-10 | 13F | HF Advisory Group, LLC | 1 276 | 0,39 | 206 | −5,09 | ||||
| 2025-08-13 | 13F | Flow Traders U.s. Llc | 2 907 | 0 | ||||||
| 2025-08-05 | 13F | Bank of New York Mellon Corp | 7 300 | 9,22 | 1 178 | 3,61 | ||||
| 2025-08-19 | 13F | National Asset Management, Inc. | 9 526 | 1 537 | ||||||
| 2025-05-16 | 13F/A | Kestra Investment Management, LLC | 0 | −100,00 | 0 | |||||
| 2025-07-29 | 13F | Private Trust Co Na | 49 | −41,67 | 8 | −50,00 | ||||
| 2025-08-14 | 13F | Modern Wealth Management, LLC | 42 030 | 39,53 | 6 781 | 32,32 | ||||
| 2025-08-12 | 13F | PKS Advisory Services, LLC | 1 666 | 0,00 | 269 | −5,30 | ||||
| 2025-07-15 | 13F | Yarbrough Capital, LLC | 31 160 | 0,00 | 5 027 | −5,15 | ||||
| 2025-08-14 | 13F | Benjamin Edwards Inc | 28 808 | 40,50 | 4 648 | 33,23 | ||||
| 2025-08-04 | 13F | IFG Advisory, LLC | 2 663 | 14,78 | 430 | 8,88 | ||||
| 2025-08-11 | 13F | NewEdge Wealth, LLC | 8 571 | −6,44 | 1 405 | −9,88 | ||||
| 2025-08-04 | 13F | Spire Wealth Management | 31 | −61,73 | 5 | −61,54 | ||||
| 2025-08-15 | 13F | First Heartland Consultants, Inc. | 3 075 | −9,13 | 496 | −13,74 | ||||
| 2025-08-14 | 13F | Glen Eagle Advisors, LLC | 30 | 0,00 | 5 | −20,00 | ||||
| 2025-08-04 | 13F | Atria Investments Llc | 5 578 | 11,32 | 900 | 5,52 | ||||
| 2025-08-14 | 13F | CoreCap Advisors, LLC | 228 | 0,00 | 37 | −5,26 | ||||
| 2025-05-15 | 13F | Nova Wealth Management, Inc. | 0 | 0 | ||||||
| 2025-07-14 | 13F | Financial Enhancement Group LLC | 5 658 | 1,89 | 943 | 9,03 | ||||
| 2025-08-08 | 13F | Glassman Wealth Services | 0 | −100,00 | 0 | |||||
| 2025-08-11 | 13F | Brass Tax Wealth Management, Inc | 1 712 | 0,00 | 276 | −5,15 | ||||
| 2025-08-14 | 13F | Susquehanna International Group, Llp | Call | 14 900 | 28,45 | 2 404 | 21,79 | |||
| 2025-08-11 | 13F | Aptus Capital Advisors, LLC | 2 | 0,00 | 0 | |||||
| 2025-08-14 | 13F | Susquehanna International Group, Llp | 48 655 | 1 551,00 | 7 850 | 1 466,67 | ||||
| 2025-08-08 | 13F | Gts Securities Llc | 0 | −100,00 | 0 | |||||
| 2025-08-14 | 13F | Integrated Wealth Concepts LLC | 30 012 | −4,09 | 4 842 | −9,06 | ||||
| 2025-07-08 | 13F/A | Salem Investment Counselors Inc | 100 | 0,00 | 16 | −5,88 | ||||
| 2025-07-23 | 13F | Gentry Private Wealth, Llc | 4 663 | 0,00 | 752 | −5,17 | ||||
| 2025-07-11 | 13F | Quad-Cities Investment Group, LLC | 9 007 | −7,94 | 1 453 | −12,68 | ||||
| 2025-07-18 | 13F | McGuire Investment Group, LLC | 0 | −100,00 | 0 | |||||
| 2025-07-23 | 13F | RMG Wealth Management LLC | 486 | 80 | ||||||
| 2025-08-13 | 13F | Russell Investments Group, Ltd. | 2 | 0,00 | 0 | |||||
| 2025-08-14 | 13F | Two Sigma Investments, Lp | 11 700 | −75,52 | 1 888 | −76,79 | ||||
| 2025-07-16 | 13F/A | CX Institutional | 151 | 0,00 | 0 | |||||
| 2025-07-15 | 13F | FLP Wealth Management, LLC | 0 | −100,00 | 0 | |||||
| 2025-04-17 | 13F | Copia Wealth Management | 0 | −100,00 | 0 | |||||
| 2025-08-06 | 13F | North Capital, Inc. | 200 | 0,00 | 32 | −5,88 | ||||
| 2025-08-14 | 13F | Ameriprise Financial Inc | 42 218 | −0,96 | 6 811 | −6,09 | ||||
| 2025-07-24 | 13F | Us Bancorp \de\ | 70 | 250,00 | 11 | 266,67 | ||||
| 2025-08-13 | 13F | Shepherd Financial Partners LLC | 1 567 | 0,00 | 253 | −5,26 | ||||
| 2025-08-12 | 13F | Proequities, Inc. | 0 | 0 | ||||||
| 2025-08-14 | 13F | Two Sigma Securities, Llc | 2 001 | 56,45 | 323 | 48,39 | ||||
| 2025-08-04 | 13F | Assetmark, Inc | 38 091 | 29,47 | 6 145 | 22,80 | ||||
| 2025-05-12 | 13F | Sandy Spring Bank | 100 | −32,89 | 17 | −29,17 | ||||
| 2025-07-29 | 13F | Stratos Wealth Advisors, LLC | 0 | −100,00 | 0 | |||||
| 2025-08-01 | 13F | Bessemer Group Inc | 600 | −14,29 | 0 | |||||
| 2025-08-12 | 13F/A | Cozad Asset Management Inc | 1 340 | 0,00 | 216 | −4,85 | ||||
| 2025-08-05 | 13F | Holistic Financial Partners | 17 922 | 209,48 | 2 891 | 193,50 | ||||
| 2025-07-10 | 13F | Wealth Enhancement Advisory Services, Llc | 10 773 | 2,01 | 1 769 | −1,50 | ||||
| 2025-07-21 | 13F | DHJJ Financial Advisors, Ltd. | 289 | 0,00 | 47 | −6,12 | ||||
| 2025-08-11 | 13F | Bedell Frazier Investment Counseling, LLC | 3 143 | −45,82 | 507 | −48,58 | ||||
| 2025-08-06 | 13F | Csenge Advisory Group | 0 | −100,00 | 0 | |||||
| 2025-08-04 | 13F | Pinnacle Associates Ltd | 5 260 | −4,42 | 849 | −9,40 | ||||
| 2025-08-13 | 13F | Icapital Wealth Llc | 0 | −100,00 | 0 | |||||
| 2025-08-13 | 13F | Gateway Wealth Partners, LLC | 6 127 | 1,85 | 988 | −3,42 | ||||
| 2025-07-17 | 13F | Walker Asset Management, LLC | 0 | −100,00 | 0 | |||||
| 2025-08-13 | 13F | Baird Financial Group, Inc. | 8 039 | 12,86 | 1 297 | 7,02 | ||||
| 2025-07-16 | 13F | American National Bank | 14 | 0,00 | 2 | 0,00 | ||||
| 2025-08-13 | 13F | Maia Wealth LLC | 3 869 | −5,26 | 624 | −1,89 | ||||
| 2025-08-13 | 13F | Virtue Capital Management, LLC | 0 | −100,00 | 0 | |||||
| 2025-08-14 | 13F | Pinnacle Family Advisors, LLC | 3 831 | 1,73 | 618 | −3,44 | ||||
| 2025-07-29 | 13F | Stephens Inc /ar/ | 1 508 | −29,57 | 243 | −33,24 | ||||
| 2025-08-06 | 13F | Prospera Financial Services Inc | 8 677 | −13,73 | 1 401 | −18,27 | ||||
| 2025-07-07 | 13F | RDA Financial Network | 1 476 | −18,77 | 238 | −22,98 | ||||
| 2025-07-11 | 13F | Farther Finance Advisors, LLC | 5 956 | 0,81 | 961 | −1,13 | ||||
| 2025-08-15 | 13F | Equitable Holdings, Inc. | 2 168 | −1,94 | 350 | −7,18 | ||||
| 2025-08-13 | 13F | Level Four Advisory Services, Llc | 3 061 | −2,79 | 494 | −7,85 | ||||
| 2025-08-11 | 13F | Principal Securities, Inc. | 839 | 14,93 | 135 | 11,57 | ||||
| 2025-08-14 | 13F | Citadel Advisors Llc | 5 679 | −79,36 | 916 | −80,43 | ||||
| 2025-08-14 | 13F | Smartleaf Asset Management LLC | 80 | 0,00 | 13 | −7,69 | ||||
| 2025-08-20 | 13F/A | Coppell Advisory Solutions LLC | 3 042 | −37,14 | 491 | −36,86 | ||||
| 2025-05-12 | 13F | Empirical Asset Management, LLC | 0 | −100,00 | 0 | |||||
| 2025-08-14 | 13F | Jane Street Group, Llc | 15 721 | −15,59 | 2 536 | −19,95 | ||||
| 2025-08-07 | 13F | Resources Investment Advisors, LLC. | 0 | −100,00 | 0 | |||||
| 2025-08-14 | 13F | Citadel Advisors Llc | Call | 2 600 | 8,33 | 419 | 2,70 | |||
| 2025-07-15 | 13F | Wealth Effects Llc | 2 285 | −16,76 | 369 | −21,03 | ||||
| 2025-08-18 | 13F | Geneos Wealth Management Inc. | 546 | 67,48 | 88 | 60,00 | ||||
| 2025-07-08 | 13F | Parallel Advisors, LLC | 13 | 0,00 | 2 | 0,00 | ||||
| 2025-08-11 | 13F | Tidemark, LLC | 85 | −19,05 | 14 | −23,53 | ||||
| 2025-08-01 | 13F | GoalVest Advisory LLC | 4 663 | 0,00 | 752 | −5,17 | ||||
| 2025-05-02 | 13F | Capital A Wealth Management, LLC | 0 | −100,00 | 0 | |||||
| 2025-08-13 | 13F | Congress Wealth Management LLC / DE / | 43 402 | −0,22 | 7 002 | −5,38 | ||||
| 2025-08-11 | 13F | Oder Investment Management, LLC | 3 209 | −0,03 | 518 | −5,14 | ||||
| 2025-08-04 | 13F | Barnes Dennig Private Wealth Management LLC | 50 | 0,00 | 8 | 0,00 | ||||
| 2025-08-14 | 13F | Bank Of America Corp /de/ | 192 556 | −0,23 | 31 065 | −5,38 | ||||
| 2025-05-09 | 13F | GeoWealth Management, LLC | 0 | −100,00 | 0 | |||||
| 2025-07-14 | 13F | Park Avenue Securities Llc | 4 071 | −0,73 | 1 | |||||
| 2025-07-17 | 13F | Sound Income Strategies, LLC | 1 | 0,00 | 0 | |||||
| 2025-08-06 | 13F | Atlantic Union Bankshares Corp | 100 | 16 | ||||||
| 2025-07-29 | 13F | Dale Q Rice Investment Management Ltd | 3 940 | −51,96 | 651 | −53,41 | ||||
| 2025-08-11 | 13F | Lake Street Financial Llc | 3 556 | −11,89 | 574 | −16,47 | ||||
| 2025-07-25 | 13F | Concurrent Investment Advisors, LLC | 1 746 | 5,12 | 282 | −0,35 | ||||
| 2025-08-05 | 13F | Bank Of Montreal /can/ | 1 366 | 0,29 | 220 | −4,76 | ||||
| 2025-08-11 | 13F | HighTower Advisors, LLC | 18 275 | 24,91 | 2 948 | 18,49 | ||||
| 2025-08-13 | 13F | Continuum Advisory, LLC | 0 | −100,00 | 0 | |||||
| 2025-07-21 | 13F | Ameriflex Group, Inc. | 164 | −40,15 | 27 | −43,48 | ||||
| 2025-08-07 | 13F | Addison Advisors LLC | 41 | 0,00 | 7 | 0,00 | ||||
| 2025-08-14 | 13F | Qube Research & Technologies Ltd | 707 | −76,50 | 114 | −77,69 | ||||
| 2025-07-16 | 13F | Signaturefd, Llc | 180 | 0,00 | 29 | −3,33 | ||||
| 2025-08-08 | 13F | Emerald Investment Partners, Llc | 4 781 | 2,20 | 771 | −3,02 | ||||
| 2025-08-12 | 13F | MAI Capital Management | 8 051 | 8,04 | 1 299 | 2,45 | ||||
| 2025-08-27 | 13F/A | Brinker Capital Investments, LLC | 5 382 | −70,88 | 868 | −47,58 | ||||
| 2025-08-13 | 13F | First Trust Advisors Lp | 8 393 | 0,79 | 1 355 | −4,45 | ||||
| 2025-08-13 | 13F/A | StoneX Group Inc. | 2 509 | −46,91 | 387 | −38,04 | ||||
| 2025-08-11 | 13F | Private Advisor Group, LLC | 6 889 | −11,98 | 1 111 | −16,53 | ||||
| 2025-08-14 | 13F | Mml Investors Services, Llc | 2 596 | −23,58 | 0 |
Other Listings
| MX:FBT |