Grundläggande statistik
| Institutionella ägare | 118 total, 118 long only, 0 short only, 0 long/short - change of 16,83% MRQ |
| Genomsnittlig portföljallokering | 0.5870 % - change of −3,25% MRQ |
| Institutionella aktier (lång) | 32 100 830 (ex 13D/G) - change of 7,53MM shares 30,63% MRQ |
| Institutionellt värde (lång) | $ 1 577 838 USD ($1000) |
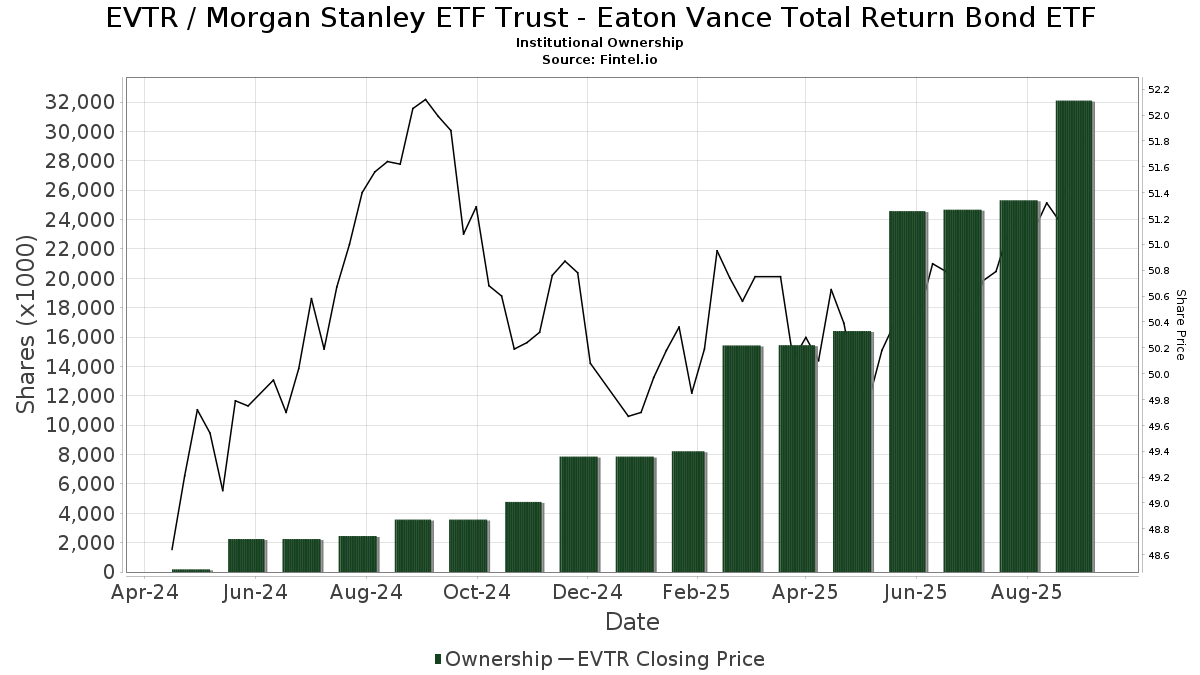
Institutionellt ägande och aktieägare
Morgan Stanley ETF Trust - Eaton Vance Total Return Bond ETF (US:EVTR) har 118 Institutionella ägare och aktieägare som har lämnat in 13D/G- eller 13F-formulär till Securities Exchange Commission (SEC). Dessa institut innehar totalt 32,100,830 aktier. Största aktieägare inkluderar Morgan Stanley, Wells Fargo & Company/mn, LPL Financial LLC, Advisor Group Holdings, Inc., Raymond James Financial Inc, Janney Montgomery Scott LLC, Bank Of America Corp /de/, HighTower Advisors, LLC, Envestnet Asset Management Inc, and Strategic Planning Group, Llc .
Morgan Stanley ETF Trust - Eaton Vance Total Return Bond ETF (NYSE:EVTR) Institutionell ägarstruktur visar institutioners och fonders nuvarande positioner i företaget, samt de senaste förändringarna i positionernas storlek. Större aktieägare kan vara enskilda investerare, fonder, hedgefonder eller institutioner. Bilaga 13D visar att investeraren äger (eller ägde) mer än 5% av företaget och avser (eller avsåg) att aktivt eftersträva en förändring av affärsstrategin. Schedule 13G indikerar en passiv investering på över 5%.
The share price as of September 22, 2025 is 51,67 / share. Previously, on September 23, 2024, the share price was 52,07 / share. This represents a decline of 0,77% over that period.
Fondsentimentets poäng
Fondsentimentet poängen(fka Ägarackumulation-poäng) visar vilka aktier som är mest köpta av fonder. Det är resultatet av en sofistikerad kvantitativ flerfaktormodell som identifierar företag med de högsta nivåerna av institutionell ackumulering. Poängsättningsmodellen använder en kombination av den totala ökningen av redovisade ägare, förändringarna i portföljallokeringarna för dessa ägare och andra mått. Siffran sträcker sig från 0 till 100, där högre siffror indikerar en högre nivå av ackumulering i förhållande till sina konkurrenter, och 50 är genomsnittet.
Uppdateringsfrekvens: Dagligen
Se Ownership Explorer, som innehåller en lista över de högst rankade företagen.
AI+ Ask Fintel’s AI assistant about Morgan Stanley ETF Trust - Eaton Vance Total Return Bond ETF.
Thinking of good questions…
Institutionell sälj/köp-kvot
Förutom att rapportera vanliga eget kapital- och skuldemissioner måste institutioner med mer än 100MM tillgångar under förvaltning också avslöja sina innehav av sälj- och köpoptioner. Eftersom säljoptioner i allmänhet indikerar ett negativt sentiment och köpoptioner indikerar ett positivt sentiment, kan vi få en uppfattning om det övergripande institutionella sentimentet genom att plotta förhållandet mellan säljoptioner och köpoptioner. Diagrammet till höger visar det historiska förhållandet mellan sälj- och köpoptioner för detta instrument.
Genom att använda sälj/köp-kvoten som en indikator på aktieägarnas sentiment undviker man en av de största bristerna med att använda det totala institutionella ägandet, nämligen att en betydande del av de förvaltade tillgångarna investeras passivt för att följa index. Passivt förvaltade fonder köper vanligtvis inte optioner, så indikatorn för sälj/köp-kvoten ger en bättre bild av stämningen i aktivt förvaltade fonder.
13F- och NPORT-arkiveringar
Detaljer om 13F-arkiveringar är gratis. Detaljer om NP-arkiveringar kräver ett premiummedlemskap. Gröna rader indikerar nya positioner. Röda rader indikerar stängda positioner. Klicka på länk symbolen för att se hela transaktionshistoriken.
Uppgradera
för att låsa upp premiumdata och exportera till Excel ![]() .
.
| Fil Datum | Källa | Investerare | Typ | Genomsnittligt pris (beräknat) |
Aktier | Δ Aktier (%) |
Rapporterat värde (1000 USD) |
Δ Värde (%) |
Portföljallokering (%) |
|
|---|---|---|---|---|---|---|---|---|---|---|
| 2025-07-11 | 13F | Seacrest Wealth Management, Llc | 17 068 | 15,97 | 868 | 16,51 | ||||
| 2025-09-04 | 13F/A | Advisor Group Holdings, Inc. | 1 593 836 | 18,23 | 81 065 | 18,77 | ||||
| 2025-04-23 | 13F | Crewe Advisors LLC | 0 | −100,00 | 0 | |||||
| 2025-08-12 | 13F/A | Cozad Asset Management Inc | 4 130 | 0,00 | 210 | 0,48 | ||||
| 2025-08-15 | 13F | Equitable Holdings, Inc. | 31 455 | 25,73 | 1 600 | 26,30 | ||||
| 2025-08-13 | 13F | Gateway Wealth Partners, LLC | 68 855 | −2,73 | 3 502 | −2,26 | ||||
| 2025-08-14 | 13F | Valley Financial Group, Inc. | 131 321 | 9,21 | 6 680 | 9,71 | ||||
| 2025-08-06 | 13F | Founders Financial Securities Llc | 36 884 | 1 876 | ||||||
| 2025-08-06 | 13F | Centerpoint Advisory Group | 5 610 | 33,25 | 285 | 33,80 | ||||
| 2025-07-17 | 13F | Fifth Third Securities, Inc. | 58 087 | 3,44 | 2 955 | 3,90 | ||||
| 2025-08-12 | 13F | Miller Financial Services LLC | 5 359 | 0,94 | 273 | 1,49 | ||||
| 2025-07-14 | 13F | IronOak Wealth LLC. | 0 | −100,00 | 0 | |||||
| 2025-08-26 | NP | EVMLX - The E-Valuator Moderate (50%-70%) RMS Fund Service Class Shares | 47 519 | 11,93 | 2 417 | 12,47 | ||||
| 2025-05-07 | 13F | Inspire Advisors, LLC | 0 | −100,00 | 0 | |||||
| 2025-08-14 | 13F | Ancora Advisors, LLC | 800 | 0,00 | 41 | 0,00 | ||||
| 2025-08-14 | 13F | Royal Bank Of Canada | 243 271 | −31,85 | 12 374 | −31,54 | ||||
| 2025-08-14 | 13F | Stifel Financial Corp | 26 865 | 1 366 | ||||||
| 2025-08-14 | 13F | Comerica Bank | 21 601 | 0,07 | 1 099 | 0,55 | ||||
| 2025-07-11 | 13F | Bouvel Investment Partners, LLC | 251 147 | 4,25 | 12 775 | 2,37 | ||||
| 2025-08-13 | 13F | Jones Financial Companies Lllp | 0 | −100,00 | 0 | |||||
| 2025-05-12 | 13F | Independent Advisor Alliance | 0 | −100,00 | 0 | |||||
| 2025-08-14 | 13F | Fmr Llc | 257 | 13 | ||||||
| 2025-07-17 | 13F | Investment Research & Advisory Group, Inc. | 1 | 0 | ||||||
| 2025-08-14 | 13F | Citadel Advisors Llc | 93 128 | 29,59 | 4 737 | 30,18 | ||||
| 2025-08-06 | 13F | Commonwealth Equity Services, Llc | 130 661 | 43,26 | 7 | 50,00 | ||||
| 2025-08-05 | 13F | Strategic Financial Concepts, LLC | 10 791 | −0,22 | 549 | 0,18 | ||||
| 2025-07-10 | 13F | Focus Financial Network, Inc. | 3 939 | 201 | ||||||
| 2025-08-12 | 13F | Cornerstone Wealth Management, LLC | 28 282 | −0,73 | 1 439 | −0,28 | ||||
| 2025-08-14 | 13F | Snowden Capital Advisors LLC | 17 700 | 37,74 | 904 | 38,28 | ||||
| 2025-08-05 | 13F | MidAtlantic Capital Management, Inc. | 26 642 | 5,56 | 1 355 | 6,11 | ||||
| 2025-08-12 | 13F | MAI Capital Management | 602 | 0,00 | 31 | 0,00 | ||||
| 2025-08-12 | 13F | Gladstone Institutional Advisory LLC | 43 969 | 7,76 | 2 236 | 8,28 | ||||
| 2025-08-12 | 13F | Eldridge Investment Advisors, Inc. | 132 118 | −9,59 | 6 720 | −9,16 | ||||
| 2025-07-30 | 13F | Cullen/frost Bankers, Inc. | 1 860 | 95 | ||||||
| 2025-05-06 | 13F | Atria Investments Llc | 0 | −100,00 | 0 | |||||
| 2025-08-12 | 13F | LPL Financial LLC | 1 791 885 | 18,68 | 91 144 | 19,24 | ||||
| 2025-08-14 | 13F | Raymond James Financial Inc | 1 017 876 | 2,93 | 51 774 | 3,41 | ||||
| 2025-08-14 | 13F | Stage Harbor Financial, Llc | 39 153 | 25,85 | 1 992 | 26,41 | ||||
| 2025-08-08 | 13F | Advisory Resource Group | 68 004 | 3,77 | 3 459 | 4,28 | ||||
| 2025-08-13 | 13F | Trustmark National Bank Trust Department | 11 600 | 0,00 | 590 | 0,51 | ||||
| 2025-07-30 | 13F/A | KPP Advisory Services LLC | 11 724 | 23,85 | 596 | 24,43 | ||||
| 2025-07-24 | 13F | Eastern Bank | 650 | 0,00 | 33 | 3,13 | ||||
| 2025-08-11 | 13F | Principal Securities, Inc. | 18 022 | 500,73 | 917 | 514,77 | ||||
| 2025-07-25 | 13F | Atria Wealth Solutions, Inc. | 13 714 | 700 | ||||||
| 2025-08-14 | 13F | Goldman Sachs Group Inc | 4 283 | 218 | ||||||
| 2025-04-24 | 13F | Decker Retirement Planning Inc. | 0 | −100,00 | 0 | |||||
| 2025-05-14 | 13F | CI Private Wealth, LLC | 0 | −100,00 | 0 | −100,00 | ||||
| 2025-04-11 | 13F | Horizon Wealth Management, LLC | 0 | −100,00 | 0 | |||||
| 2025-08-11 | 13F | Parr Mcknight Wealth Management Group, Llc | 4 188 | −1,16 | 213 | −0,47 | ||||
| 2025-07-31 | 13F | Trademark Financial Management, LLC | 63 709 | 6,56 | 3 241 | 7,04 | ||||
| 2025-07-22 | 13F | Beacon Financial Advisory LLC | 8 007 | 62,91 | 407 | 64,11 | ||||
| 2025-07-09 | 13F | Breakwater Capital Group | 7 876 | 23,12 | 401 | 23,84 | ||||
| 2025-07-21 | 13F | Ameritas Advisory Services, LLC | 30 799 | 1 567 | ||||||
| 2025-07-28 | 13F | RFG Advisory, LLC | 11 178 | 569 | ||||||
| 2025-08-05 | 13F | GPS Wealth Strategies Group, LLC | 7 661 | 0,42 | 390 | 0,78 | ||||
| 2025-04-25 | 13F | Wall Street Financial Group, Inc. | 43 280 | 8,16 | 2 191 | 9,82 | ||||
| 2025-07-30 | 13F | Brookstone Capital Management | 4 895 | −2,57 | 249 | −2,36 | ||||
| 2025-07-23 | 13F | REAP Financial Group, LLC | 970 | 1,15 | 49 | 2,08 | ||||
| 2025-08-07 | 13F | Kestra Private Wealth Services, Llc | 9 826 | 24,65 | 500 | 25,06 | ||||
| 2025-08-05 | 13F | Bank of New York Mellon Corp | 6 972 | 355 | ||||||
| 2025-07-23 | 13F | Penney Financial, LLC | 113 122 | 5 754 | ||||||
| 2025-08-14 | 13F | Bank Of America Corp /de/ | 753 374 | 33 729,10 | 38 320 | 34 114,29 | ||||
| 2025-08-15 | 13F | Asset Allocation Strategies LLC | 4 698 | 239 | ||||||
| 2025-08-12 | 13F | Soundwatch Capital LLC | 3 536 | 634 | ||||||
| 2025-05-16 | 13F | Coppell Advisory Solutions LLC | 0 | −100,00 | 0 | |||||
| 2025-08-07 | 13F | Montag A & Associates Inc | 1 137 | 58 | ||||||
| 2025-07-28 | 13F | Harbour Investments, Inc. | 833 | −9,36 | 42 | −8,70 | ||||
| 2025-08-14 | 13F | Jane Street Group, Llc | 0 | −100,00 | 0 | |||||
| 2025-07-24 | 13F | IFP Advisors, Inc | 251 | 0,00 | 13 | 0,00 | ||||
| 2025-08-11 | 13F | HighTower Advisors, LLC | 452 038 | 1,71 | 22 993 | 2,18 | ||||
| 2025-08-14 | 13F | GWM Advisors LLC | 37 925 | −27,74 | 1 929 | −27,40 | ||||
| 2025-08-14 | 13F | Wiley Bros.-aintree Capital, Llc | 17 229 | 288,74 | 876 | 300,00 | ||||
| 2025-07-24 | 13F | KC Investment Advisors, LLC | 49 380 | −28,21 | 2 512 | −27,89 | ||||
| 2025-08-12 | 13F | CIBC Private Wealth Group, LLC | 5 025 | 256 | ||||||
| 2025-08-14 | 13F | UBS Group AG | 172 | 9 | ||||||
| 2025-08-14 | 13F | Balanced Rock Investment Advisor | 121 997 | 6 205 | ||||||
| 2025-08-04 | 13F | Spire Wealth Management | 149 155 | −11,58 | 7 541 | −11,71 | ||||
| 2025-08-12 | 13F | Quadcap Wealth Management, LLC | 351 608 | 9,69 | 17 885 | 10,20 | ||||
| 2025-04-22 | 13F | Synergy Financial Management, LLC | 0 | −100,00 | 0 | |||||
| 2025-05-14 | 13F | Brown Brothers Harriman & Co | 0 | −100,00 | 0 | |||||
| 2025-08-26 | NP | EVTTX - The E-Valuator Conservative/Moderate (30%-50%) RMS Fund Service Class Shares | 15 814 | −20,87 | 804 | −20,47 | ||||
| 2025-08-01 | 13F | Envestnet Asset Management Inc | 378 952 | 26,56 | 19 275 | 27,14 | ||||
| 2025-08-14 | 13F | Sunbelt Securities, Inc. | 162 | 376,47 | 8 | 700,00 | ||||
| 2025-08-04 | 13F | Barnes Dennig Private Wealth Management LLC | 927 | 47 | ||||||
| 2025-07-16 | 13F | ORG Partners LLC | 52 683 | 23,61 | 2 678 | 45,65 | ||||
| 2025-08-12 | 13F | OneAscent Financial Services LLC | 9 408 | 10,19 | 0 | |||||
| 2025-08-06 | 13F | AE Wealth Management LLC | 4 586 | 233 | ||||||
| 2025-08-08 | 13F | Avantax Advisory Services, Inc. | 12 816 | 18,55 | 652 | 19,01 | ||||
| 2025-07-31 | 13F | Oppenheimer & Co Inc | 11 738 | 29,46 | 597 | 30,07 | ||||
| 2025-07-22 | 13F | Merit Financial Group, LLC | 45 139 | −24,76 | 2 296 | −24,43 | ||||
| 2025-08-11 | 13F | Western Wealth Management, LLC | 198 790 | 1,41 | 10 111 | 1,87 | ||||
| 2025-08-26 | NP | EVVLX - The E-Valuator Very Conservative (0%-15%) RMS Fund Service Class Shares | 21 358 | 8,16 | 1 086 | 8,71 | ||||
| 2025-07-14 | 13F | Strategic Planning Group, Llc | 363 782 | 7,75 | 18 504 | 8,25 | ||||
| 2025-08-13 | 13F | Cerity Partners LLC | 5 622 | 0,00 | 286 | 0,35 | ||||
| 2025-08-13 | 13F | Per Stirling Capital Management, LLC. | 149 247 | −2,26 | 7 591 | −1,80 | ||||
| 2025-06-23 | NP | Short Duration Inflation-Protected Income Portfolio - Short Duration Inflation-Protected Income Portfolio | 96 500 | 4 888 | ||||||
| 2025-07-25 | 13F | Envestnet Portfolio Solutions, Inc. | 19 291 | 51,87 | 981 | 52,57 | ||||
| 2025-08-12 | 13F | Blueprint Financial Advisors LLC | 16 371 | 833 | ||||||
| 2025-08-11 | 13F | Private Advisor Group, LLC | 85 197 | 268,69 | 4 334 | 270,66 | ||||
| 2025-08-12 | 13F | Proequities, Inc. | 0 | 0 | ||||||
| 2025-07-22 | 13F | Belpointe Asset Management LLC | 3 986 | −2,04 | 203 | −1,94 | ||||
| 2025-07-29 | 13F | Stratos Wealth Partners, LTD. | 6 640 | 27,45 | 338 | 28,14 | ||||
| 2025-07-31 | 13F | Cambridge Investment Research Advisors, Inc. | 19 070 | −15,43 | 1 | −100,00 | ||||
| 2025-07-10 | 13F | Tompkins Financial Corp | 510 | 0,00 | 26 | 0,00 | ||||
| 2025-08-12 | 13F | Steward Partners Investment Advisory, Llc | 3 235 | 49,56 | 165 | 50,46 | ||||
| 2025-07-24 | 13F | Leo Wealth, LLC | 14 183 | 721 | ||||||
| 2025-08-14 | 13F | Acorn Wealth Advisors, LLC | 0 | −100,00 | 0 | |||||
| 2025-08-04 | 13F | Creative Financial Designs Inc /adv | 11 977 | 1,39 | 609 | 1,84 | ||||
| 2025-07-07 | 13F | Park Edge Advisors, LLC | 0 | −100,00 | 0 | |||||
| 2025-08-14 | 13F | Ameriprise Financial Inc | 30 286 | −2,72 | 1 540 | −2,28 | ||||
| 2025-08-13 | 13F | Flow Traders U.s. Llc | 0 | −100,00 | 0 | |||||
| 2025-07-30 | 13F | Studio Investment Management Llc | 4 278 | 218 | ||||||
| 2025-08-08 | 13F | Pnc Financial Services Group, Inc. | 273 603 | 35,47 | 13 917 | 36,10 | ||||
| 2025-08-15 | 13F | Morgan Stanley | 16 552 507 | 45,03 | 841 943 | 45,70 | ||||
| 2025-08-13 | 13F | Mount Yale Investment Advisors, LLC | 258 036 | −2,78 | 13 125 | −2,33 | ||||
| 2025-08-14 | 13F | Integrated Wealth Concepts LLC | 10 185 | −53,08 | 518 | −52,82 | ||||
| 2025-08-13 | 13F | Northwestern Mutual Wealth Management Co | 316 109 | 77,88 | 16 079 | 78,70 | ||||
| 2025-08-12 | 13F | Coldstream Capital Management Inc | 0 | −100,00 | 0 | |||||
| 2025-07-30 | 13F | D.a. Davidson & Co. | 9 667 | 492 | ||||||
| 2025-08-12 | 13F | Jpmorgan Chase & Co | 2 287 | 96,48 | 116 | 100,00 | ||||
| 2025-08-14 | 13F | Wells Fargo & Company/mn | 2 452 006 | −1,93 | 124 721 | −1,47 | ||||
| 2025-07-16 | 13F | RWM Asset Management, LLC | 258 089 | 13 128 | ||||||
| 2025-08-13 | 13F | Victory Financial Group, Llc | 333 714 | −0,47 | 16 974 | 0,00 | ||||
| 2025-08-14 | 13F | Mml Investors Services, Llc | 76 392 | 9,62 | 4 | 0,00 | ||||
| 2025-08-04 | 13F | Coign Capital Advisors LLC | 209 207 | 8,83 | 10 642 | 9,34 | ||||
| 2025-07-18 | 13F | Truist Financial Corp | 60 493 | −15,66 | 3 077 | −15,29 | ||||
| 2025-07-22 | 13F | Apexium Financial, Lp | 82 784 | 134,05 | 4 227 | 135,23 | ||||
| 2025-08-26 | NP | EVGLX - The E-Valuator Growth (70%-85%) RMS Fund Service Class Shares | 25 085 | −26,92 | 1 276 | −26,60 | ||||
| 2025-08-05 | 13F | Flynn Zito Capital Management, Llc | 79 664 | 1,60 | 4 052 | 2,09 | ||||
| 2025-08-08 | 13F | Kingsview Wealth Management, LLC | 7 895 | −3,66 | 402 | −3,14 | ||||
| 2025-07-17 | 13F | Janney Montgomery Scott LLC | 853 084 | 9,17 | 43 | 10,26 | ||||
| 2025-08-13 | 13F | My Purposeful Wealth Corp. | 39 968 | 2 042 | ||||||
| 2025-07-29 | 13F | Systelligence, LLC | 158 529 | −0,84 | 8 064 | −0,38 | ||||
| 2025-08-08 | 13F | Cetera Investment Advisers | 127 873 | 5,18 | 6 504 | 5,67 | ||||
| 2025-08-15 | 13F | Kestra Advisory Services, LLC | 10 842 | 165,93 | 551 | 167,48 | ||||
| 2025-08-26 | NP | EVCLX - The E-Valuator Conservative (15%-30%) RMS Fund Service Class Shares | 48 753 | 12,42 | 2 480 | 12,94 |