Grundläggande statistik
| Institutionella ägare | 208 total, 204 long only, 1 short only, 3 long/short - change of 22,94% MRQ |
| Genomsnittlig portföljallokering | 0.2063 % - change of 32,82% MRQ |
| Institutionella aktier (lång) | 71 948 761 (ex 13D/G) - change of 5,85MM shares 8,84% MRQ |
| Institutionellt värde (lång) | $ 2 250 889 USD ($1000) |
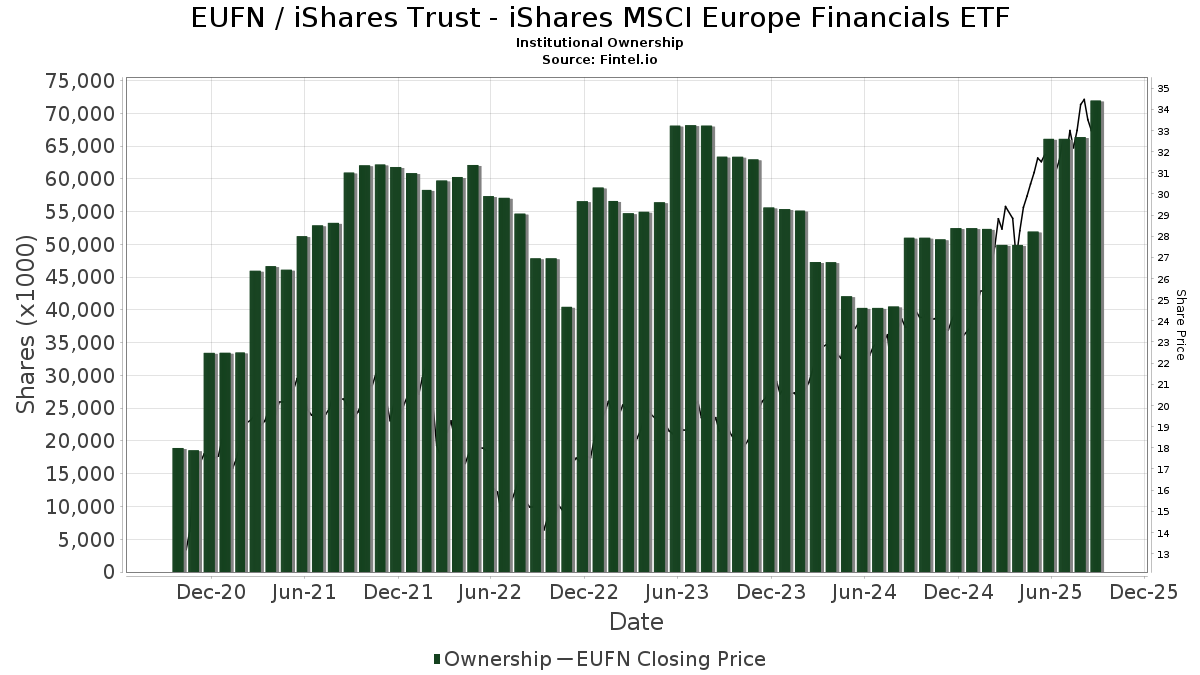
Institutionellt ägande och aktieägare
iShares Trust - iShares MSCI Europe Financials ETF (US:EUFN) har 208 Institutionella ägare och aktieägare som har lämnat in 13D/G- eller 13F-formulär till Securities Exchange Commission (SEC). Dessa institut innehar totalt 71,948,761 aktier. Största aktieägare inkluderar Fisher Asset Management, LLC, Jpmorgan Chase & Co, Morgan Stanley, Envestnet Asset Management Inc, Assetmark, Inc, RiverFront Investment Group, LLC, Schroder Investment Management Group, Jane Street Group, Llc, Td Asset Management Inc, and Congress Wealth Management LLC / DE / .
iShares Trust - iShares MSCI Europe Financials ETF (NasdaqGM:EUFN) Institutionell ägarstruktur visar institutioners och fonders nuvarande positioner i företaget, samt de senaste förändringarna i positionernas storlek. Större aktieägare kan vara enskilda investerare, fonder, hedgefonder eller institutioner. Bilaga 13D visar att investeraren äger (eller ägde) mer än 5% av företaget och avser (eller avsåg) att aktivt eftersträva en förändring av affärsstrategin. Schedule 13G indikerar en passiv investering på över 5%.
The share price as of September 5, 2025 is 33,31 / share. Previously, on September 9, 2024, the share price was 23,77 / share. This represents an increase of 40,13% over that period.
Fondsentimentets poäng
Fondsentimentet poängen(fka Ägarackumulation-poäng) visar vilka aktier som är mest köpta av fonder. Det är resultatet av en sofistikerad kvantitativ flerfaktormodell som identifierar företag med de högsta nivåerna av institutionell ackumulering. Poängsättningsmodellen använder en kombination av den totala ökningen av redovisade ägare, förändringarna i portföljallokeringarna för dessa ägare och andra mått. Siffran sträcker sig från 0 till 100, där högre siffror indikerar en högre nivå av ackumulering i förhållande till sina konkurrenter, och 50 är genomsnittet.
Uppdateringsfrekvens: Dagligen
Se Ownership Explorer, som innehåller en lista över de högst rankade företagen.
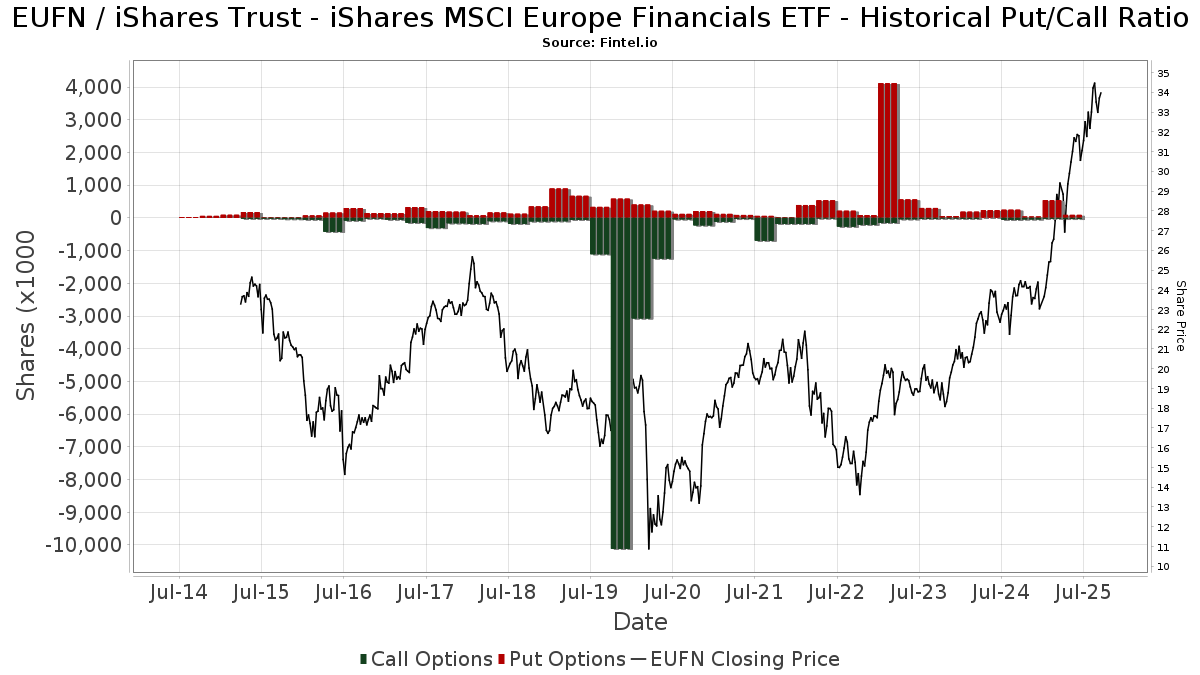
Institutionell sälj/köp-kvot
Förutom att rapportera vanliga eget kapital- och skuldemissioner måste institutioner med mer än 100MM tillgångar under förvaltning också avslöja sina innehav av sälj- och köpoptioner. Eftersom säljoptioner i allmänhet indikerar ett negativt sentiment och köpoptioner indikerar ett positivt sentiment, kan vi få en uppfattning om det övergripande institutionella sentimentet genom att plotta förhållandet mellan säljoptioner och köpoptioner. Diagrammet till höger visar det historiska förhållandet mellan sälj- och köpoptioner för detta instrument.
Genom att använda sälj/köp-kvoten som en indikator på aktieägarnas sentiment undviker man en av de största bristerna med att använda det totala institutionella ägandet, nämligen att en betydande del av de förvaltade tillgångarna investeras passivt för att följa index. Passivt förvaltade fonder köper vanligtvis inte optioner, så indikatorn för sälj/köp-kvoten ger en bättre bild av stämningen i aktivt förvaltade fonder.
13F- och NPORT-arkiveringar
Detaljer om 13F-arkiveringar är gratis. Detaljer om NP-arkiveringar kräver ett premiummedlemskap. Gröna rader indikerar nya positioner. Röda rader indikerar stängda positioner. Klicka på länk symbolen för att se hela transaktionshistoriken.
Uppgradera
för att låsa upp premiumdata och exportera till Excel ![]() .
.
| Fil Datum | Källa | Investerare | Typ | Genomsnittligt pris (beräknat) |
Aktier | Δ Aktier (%) |
Rapporterat värde (1000 USD) |
Δ Värde (%) |
Portföljallokering (%) |
|
|---|---|---|---|---|---|---|---|---|---|---|
| 2025-08-13 | 13F | Custom Index Systems, Llc | 16 420 | 519 | ||||||
| 2025-07-30 | NP | ENDW - Cambria Endowment Style ETF | 894 | 28 | ||||||
| 2025-07-15 | 13F | North Star Investment Management Corp. | 197 217 | 34,48 | 6 238 | 49,28 | ||||
| 2025-07-14 | 13F | Sowell Financial Services LLC | 8 303 | 263 | ||||||
| 2025-07-09 | 13F | VisionPoint Advisory Group, LLC | 48 564 | 1 536 | ||||||
| 2025-07-15 | 13F | Td Private Client Wealth Llc | 1 635 | 30,80 | 52 | 45,71 | ||||
| 2025-08-14 | 13F | Aspen Grove Capital, LLC | 165 358 | 2,64 | 5 230 | 13,97 | ||||
| 2025-07-07 | 13F | Hedges Asset Management LLC | 21 000 | −40,00 | 664 | −33,40 | ||||
| 2025-08-14 | 13F | D. E. Shaw & Co., Inc. | 409 112 | 12 940 | ||||||
| 2025-07-22 | 13F | DAVENPORT & Co LLC | 9 878 | 15,99 | 312 | 28,93 | ||||
| 2025-08-06 | 13F | North Capital, Inc. | 200 | 0,00 | 6 | 20,00 | ||||
| 2025-08-14 | 13F | Headlands Technologies LLC | 2 215 | 70 | ||||||
| 2025-05-12 | 13F | Simplex Trading, Llc | 0 | −100,00 | 0 | |||||
| 2025-08-04 | 13F | Spire Wealth Management | 1 745 | 2,83 | 55 | 14,58 | ||||
| 2025-03-12 | 13F | Centaurus Financial, Inc. | 0 | −100,00 | 0 | |||||
| 2025-08-13 | 13F/A | StoneX Group Inc. | 0 | −100,00 | 0 | |||||
| 2025-08-14 | 13F | Atomi Financial Group, Inc. | 12 137 | −15,10 | 384 | −5,90 | ||||
| 2025-08-14 | 13F | UBS Group AG | 213 642 | −18,47 | 6 757 | −9,48 | ||||
| 2025-08-01 | 13F | Liberty Wealth Management Llc | 7 733 | −94,61 | 245 | 1 642,86 | ||||
| 2025-07-09 | 13F | Massmutual Trust Co Fsb/adv | 209 | 7 | ||||||
| 2025-08-12 | 13F | Steward Partners Investment Advisory, Llc | 12 272 | 0,00 | 388 | 11,17 | ||||
| 2025-08-13 | 13F | Per Stirling Capital Management, LLC. | 22 945 | 726 | ||||||
| 2025-08-14 | 13F/A | Bank Julius Baer & Co. Ltd, Zurich | 3 550 | 13,02 | 112 | 10,89 | ||||
| 2025-08-13 | 13F | Continuum Advisory, LLC | 0 | −100,00 | 0 | |||||
| 2025-05-12 | 13F | Townsquare Capital Llc | 0 | −100,00 | 0 | |||||
| 2025-08-01 | 13F | Envestnet Asset Management Inc | 2 644 498 | 27,57 | 83 640 | 41,62 | ||||
| 2025-08-13 | 13F | Provida Pension Fund Administrator | 0 | −100,00 | 0 | −100,00 | ||||
| 2025-08-08 | 13F | Kingsview Wealth Management, LLC | 216 115 | 6 836 | ||||||
| 2025-08-07 | 13F | Addison Advisors LLC | 445 | 0,00 | 14 | 16,67 | ||||
| 2025-08-29 | 13F | Evolution Wealth Management Inc. | 87 | 3 | ||||||
| 2025-08-12 | 13F | Guerra Pan Advisors, Llc | 7 352 | 233 | ||||||
| 2025-07-31 | 13F | Strait & Sound Wealth Management LLC | 16 227 | 6,01 | 513 | 17,66 | ||||
| 2025-08-13 | 13F | Congress Wealth Management LLC / DE / | 849 120 | 0,66 | 26 858 | 11,76 | ||||
| 2025-08-14 | 13F | Stifel Financial Corp | 54 619 | 49,90 | 1 728 | 66,38 | ||||
| 2025-07-16 | 13F | Evergreen Private Wealth LLC | 90 942 | 2 876 | ||||||
| 2025-07-21 | 13F | Ascent Group, LLC | 18 417 | 583 | ||||||
| 2025-08-14 | 13F | Fmr Llc | 59 330 | 7,10 | 1 877 | 18,88 | ||||
| 2025-07-25 | 13F | Envestnet Portfolio Solutions, Inc. | 26 691 | −44,56 | 844 | −38,44 | ||||
| 2025-07-29 | 13F | Mattson Financial Services, LLC | 0 | −100,00 | 0 | |||||
| 2025-08-07 | 13F | Allworth Financial LP | 546 | 53,37 | 17 | 70,00 | ||||
| 2025-08-06 | 13F | Commonwealth Equity Services, Llc | 17 108 | −1,17 | 1 | |||||
| 2025-08-12 | 13F | Boreal Capital Management LLC | 3 775 | 119 | ||||||
| 2025-08-14 | 13F | Jane Street Group, Llc | 1 322 381 | 83,84 | 41 827 | 104,10 | ||||
| 2025-08-14 | 13F | Riggs Asset Managment Co. Inc. | 265 242 | 145,93 | 8 390 | 173,08 | ||||
| 2025-04-22 | 13F | Synergy Financial Management, LLC | 0 | −100,00 | 0 | |||||
| 2025-08-05 | 13F | Bank Of Montreal /can/ | 41 066 | −1,44 | 1 299 | 9,35 | ||||
| 2025-08-13 | 13F | Schroder Investment Management Group | 1 909 881 | 60 333 | ||||||
| 2025-08-14 | 13F | GWM Advisors LLC | 10 809 | 891,65 | 342 | 1 000,00 | ||||
| 2025-08-15 | 13F | Semmax Financial Advisors Inc. | 253 | 0,00 | 9 | 14,29 | ||||
| 2025-04-22 | 13F | Tower View Investment Management & Research LLC | 0 | −100,00 | 0 | |||||
| 2025-08-15 | 13F | Kestra Advisory Services, LLC | 15 821 | 41,89 | 500 | 57,73 | ||||
| 2025-07-31 | 13F | Hanlon Investment Management, Inc. | 15 942 | 504 | ||||||
| 2025-07-14 | 13F | Park Avenue Securities Llc | 64 063 | 3,18 | 2 | 100,00 | ||||
| 2025-07-22 | 13F | Valeo Financial Advisors, LLC | 6 685 | 211 | ||||||
| 2025-07-16 | 13F | Essex Financial Services, Inc. | 0 | −100,00 | 0 | |||||
| 2025-08-06 | 13F | AE Wealth Management LLC | 8 655 | 24,55 | 274 | 38,58 | ||||
| 2025-07-14 | 13F | Opal Wealth Advisors, LLC | 1 424 | 45 | ||||||
| 2025-08-13 | 13F | Raab & Moskowitz Asset Management LLC | 10 856 | 343 | ||||||
| 2025-03-27 | NP | RLGAX - RiverFront Asset Allocation Growth & Income Investor Shares | 32 251 | −4,11 | 815 | 0,87 | ||||
| 2025-08-14 | 13F | Wells Fargo & Company/mn | 77 214 | −44,81 | 2 442 | −38,74 | ||||
| 2025-08-06 | 13F | Golden State Wealth Management, LLC | 168 | 2,44 | 5 | 25,00 | ||||
| 2025-08-11 | 13F | Annis Gardner Whiting Capital Advisors, LLC | 1 439 | 46 | ||||||
| 2025-05-13 | 13F | Clear Street Markets Llc | 0 | −100,00 | 0 | |||||
| 2025-08-13 | 13F | Russell Investments Group, Ltd. | 1 907 | 17,21 | 60 | 30,43 | ||||
| 2025-08-14 | 13F | Goldman Sachs Group Inc | 440 251 | −6,56 | 13 925 | 3,74 | ||||
| 2025-08-19 | 13F | Delos Wealth Advisors, LLC | 96 | 3 | ||||||
| 2025-08-01 | 13F | Ashton Thomas Private Wealth, LLC | 23 686 | −5,20 | 749 | 5,34 | ||||
| 2025-07-31 | 13F | Cambridge Investment Research Advisors, Inc. | 60 844 | 77,96 | 2 | |||||
| 2025-08-12 | 13F | RiverFront Investment Group, LLC | 2 360 087 | 29,10 | 74 650 | 43,34 | ||||
| 2025-07-21 | 13F | Mirae Asset Global Investments Co., Ltd. | 0 | −100,00 | 0 | |||||
| 2025-08-06 | 13F | Pekin Hardy Strauss, Inc. | 6 635 | 210 | ||||||
| 2025-08-14 | 13F | Jane Street Group, Llc | Put | 20 300 | 642 | |||||
| 2025-07-23 | 13F | Godsey & Gibb Associates | 0 | −100,00 | 0 | |||||
| 2025-08-12 | 13F | MAI Capital Management | 826 | 0,00 | 26 | 13,04 | ||||
| 2025-08-14 | 13F | Uniplan Investment Counsel, Inc. | 568 | 24,56 | 18 | 30,77 | ||||
| 2025-08-12 | 13F | Running Point Capital Advisors, LLC | 839 | 27 | ||||||
| 2025-08-06 | 13F | Prospera Financial Services Inc | 122 684 | −11,23 | 3 880 | −1,45 | ||||
| 2025-08-14 | 13F | Jane Street Group, Llc | Call | 10 100 | 18,82 | 319 | 31,82 | |||
| 2025-08-15 | 13F | Provenance Wealth Advisors, LLC | 2 542 | 0,00 | 80 | 11,11 | ||||
| 2025-07-18 | 13F | Founders Capital Management | 84 | 0,00 | 3 | 0,00 | ||||
| 2025-08-08 | 13F | Creative Planning | 52 105 | 19,91 | 1 648 | 33,23 | ||||
| 2025-07-10 | 13F | Anderson Hoagland & Co | 75 428 | 93,67 | 2 386 | 147,41 | ||||
| 2025-08-14 | 13F | Wiley Bros.-aintree Capital, Llc | 7 128 | 225 | ||||||
| 2025-05-14 | 13F | Group One Trading, L.p. | 0 | −100,00 | 0 | −100,00 | ||||
| 2025-08-12 | 13F | O'shaughnessy Asset Management, Llc | 6 523 | 277,71 | 206 | 320,41 | ||||
| 2025-07-17 | 13F | HB Wealth Management, LLC | 13 292 | 0,00 | 420 | 11,11 | ||||
| 2025-08-08 | 13F | City Of London Investment Management Co Ltd | 7 280 | 230 | ||||||
| 2025-08-12 | 13F | Proequities, Inc. | 0 | 0 | ||||||
| 2025-08-14 | 13F/A | Rockefeller Capital Management L.P. | 19 308 | 4,32 | 611 | 15,75 | ||||
| 2025-07-24 | 13F | Us Bancorp \de\ | 1 169 | 4,94 | 37 | 16,13 | ||||
| 2025-08-14 | 13F/A | Barclays Plc | 79 | 0 | ||||||
| 2025-04-17 | 13F | Warther Private Wealth, LLC | 0 | −100,00 | 0 | −100,00 | ||||
| 2025-07-10 | 13F | Wealth Enhancement Advisory Services, Llc | 16 272 | 517 | ||||||
| 2025-07-08 | 13F | Webster Bank, N. A. | 1 071 | 0,00 | 34 | 10,00 | ||||
| 2025-08-14 | 13F | BTG Pactual Asset Management US LLC | Put | 0 | −100,00 | 0 | ||||
| 2025-08-14 | 13F | BTG Pactual Asset Management US LLC | 0 | −100,00 | 0 | |||||
| 2025-08-14 | 13F | Federation des caisses Desjardins du Quebec | 1 210 | −45,25 | 38 | −38,71 | ||||
| 2025-08-14 | 13F | Royal Bank Of Canada | 801 884 | 91,54 | 25 364 | 112,64 | ||||
| 2025-04-15 | 13F | Greenwood Capital Associates Llc | 0 | −100,00 | 0 | |||||
| 2025-07-28 | 13F | Td Asset Management Inc | 1 243 902 | 0,00 | 39 345 | 11,02 | ||||
| 2025-08-18 | 13F | Geneos Wealth Management Inc. | 21 467 | 0,00 | 679 | 11,13 | ||||
| 2025-08-14 | 13F | Harris Associates L P | 600 | 0,00 | 19 | 5,88 | ||||
| 2025-07-17 | 13F | Halbert Hargrove Global Advisors, Llc | 205 | 0,00 | 6 | 20,00 | ||||
| 2025-07-17 | 13F | Janney Montgomery Scott LLC | 333 737 | 90,25 | 11 | 150,00 | ||||
| 2025-08-05 | 13F | Huntington National Bank | 120 | 13,21 | ||||||
| 2025-07-21 | 13F | Ameritas Advisory Services, LLC | 140 | 4 | ||||||
| 2025-08-11 | 13F | Rothschild Investment Llc | 181 | 0,00 | 6 | 0,00 | ||||
| 2025-04-22 | 13F/A | NorthRock Partners, LLC | 0 | −100,00 | 0 | |||||
| 2025-07-29 | 13F | APCM Wealth Management for Individuals | 291 229 | 0,68 | 9 212 | 11,78 | ||||
| 2025-08-12 | 13F | Global Retirement Partners, LLC | 2 510 | 861,69 | 79 | 1 216,67 | ||||
| 2025-08-12 | 13F | Aviso Financial Inc. | 273 | 9 | ||||||
| 2025-08-13 | 13F | Northwestern Mutual Wealth Management Co | 3 050 | −41,03 | 96 | −34,69 | ||||
| 2025-07-03 | 13F | Garde Capital, Inc. | 1 680 | 0,00 | 53 | 12,77 | ||||
| 2025-08-13 | 13F | Northern Trust Corp | 9 511 | 301 | ||||||
| 2025-08-14 | 13F | Hrt Financial Lp | 0 | −100,00 | 0 | |||||
| 2025-08-14 | 13F | Tudor Investment Corp Et Al | 88 672 | 2 805 | ||||||
| 2025-08-05 | 13F | Carolinas Wealth Consulting Llc | 0 | −100,00 | 0 | −100,00 | ||||
| 2025-08-15 | 13F | Captrust Financial Advisors | 14 980 | −2,30 | 474 | 8,49 | ||||
| 2025-08-05 | 13F | Key FInancial Inc | 0 | −100,00 | 0 | |||||
| 2025-08-12 | 13F | Fairscale Capital, LLC | 348 | 11 | ||||||
| 2025-08-06 | 13F | Bensler, LLC | 672 430 | 21 269 | ||||||
| 2025-07-25 | 13F | Atria Wealth Solutions, Inc. | 9 270 | −61,82 | 293 | −57,60 | ||||
| 2025-07-28 | 13F | Harbour Investments, Inc. | 32 473 | 5 858,35 | 1 027 | 6 746,67 | ||||
| 2025-08-14 | 13F | Mariner, LLC | 19 350 | −13,01 | 612 | −3,32 | ||||
| 2025-08-18 | 13F/A | Kestra Investment Management, LLC | 6 400 | 202 | ||||||
| 2025-07-29 | 13F | Alaska Permanent Capital Management | 11 551 | −98,10 | 366 | −97,88 | ||||
| 2025-09-04 | 13F/A | Advisor Group Holdings, Inc. | 51 139 | 529,25 | 1 511 | 553,68 | ||||
| 2025-07-16 | 13F | ORG Wealth Partners, LLC | 88 | 0,00 | 3 | 0,00 | ||||
| 2025-08-11 | 13F | Aptus Capital Advisors, LLC | 1 613 | 44,02 | 51 | 64,52 | ||||
| 2025-08-14 | 13F | Citadel Advisors Llc | 562 616 | 17 796 | ||||||
| 2025-07-09 | 13F | Byrne Asset Management LLC | 347 | 0,00 | 11 | 11,11 | ||||
| 2025-08-14 | 13F | Citadel Advisors Llc | Put | 25 900 | 22,75 | 819 | 36,27 | |||
| 2025-08-14 | 13F | Mml Investors Services, Llc | 187 379 | 52,39 | 6 | 66,67 | ||||
| 2025-08-11 | 13F | Beaumont Capital Management, LLC | 36 878 | 1 166 | ||||||
| 2025-08-12 | 13F | Integrated Advisors Network LLC | 6 850 | 217 | ||||||
| 2025-07-24 | 13F | Blair William & Co/il | 8 288 | 2,83 | 262 | 14,41 | ||||
| 2025-08-15 | 13F | Morgan Stanley | 4 708 478 | 11,38 | 148 929 | 23,65 | ||||
| 2025-07-01 | 13F | Harbor Investment Advisory, Llc | 331 | 0,00 | 10 | 11,11 | ||||
| 2025-08-14 | 13F | Ameriprise Financial Inc | 71 164 | 199,27 | 2 251 | 213,81 | ||||
| 2025-07-21 | 13F | Fortis Capital Advisors, LLC | 10 516 | 5,16 | 333 | 16,90 | ||||
| 2025-08-14 | 13F | Citadel Advisors Llc | Call | 13 500 | 23,85 | 427 | 37,74 | |||
| 2025-08-14 | 13F | Arete Wealth Advisors, LLC | 22 841 | 1 | ||||||
| 2025-08-12 | 13F | LPL Financial LLC | 617 534 | 48,31 | 19 533 | 64,66 | ||||
| 2025-08-08 | 13F | Cetera Investment Advisers | 188 245 | 3,47 | 5 954 | 14,88 | ||||
| 2025-07-14 | 13F | GAMMA Investing LLC | 1 748 | 0,00 | 55 | 12,24 | ||||
| 2025-07-24 | 13F | IFP Advisors, Inc | 1 435 | 45 | ||||||
| 2025-08-15 | 13F | Equitable Holdings, Inc. | 37 965 | −6,23 | 1 201 | 4,08 | ||||
| 2025-08-14 | 13F | Circle Wealth Management, LLC | 0 | −100,00 | 0 | |||||
| 2025-08-13 | 13F | Fisher Asset Management, LLC | 35 345 109 | −7,76 | 1 117 966 | 2,40 | ||||
| 2025-08-08 | 13F | Tortoise Investment Management, LLC | 36 | 0,00 | 1 | 0,00 | ||||
| 2025-08-13 | 13F | Kayne Anderson Rudnick Investment Management Llc | 7 683 | 0,00 | 243 | 11,47 | ||||
| 2025-07-17 | 13F | Fifth Third Securities, Inc. | 53 094 | 1 679 | ||||||
| 2025-08-13 | 13F | Hsbc Holdings Plc | 50 894 | −23,41 | 1 610 | −15,00 | ||||
| 2025-07-08 | 13F | Nbc Securities, Inc. | 130 | 0 | ||||||
| 2025-07-29 | 13F | Koshinski Asset Management, Inc. | 9 442 | 26,42 | 299 | 40,57 | ||||
| 2025-08-13 | 13F | Banco de Sabadell, S.A | 61 897 | 42,03 | 2 | 0,00 | ||||
| 2025-08-06 | 13F | Adviser Investments LLC | 14 000 | 443 | ||||||
| 2025-08-06 | 13F | Csenge Advisory Group | 9 338 | 297 | ||||||
| 2025-08-08 | 13F/A | Ignite Planners, LLC | 9 068 | 288 | ||||||
| 2025-08-11 | 13F | HighTower Advisors, LLC | 77 984 | −28,48 | 2 467 | −20,61 | ||||
| 2025-08-12 | 13F | Calton & Associates, Inc. | 16 255 | −1,18 | 514 | 9,83 | ||||
| 2025-08-14 | 13F | Bank Of America Corp /de/ | 391 457 | 53,33 | 12 382 | 70,23 | ||||
| 2025-07-29 | 13F | JTC Employer Solutions Trusteee Ltd | 10 600 | 0,00 | 0 | |||||
| 2025-08-14 | 13F | Transamerica Financial Advisors, Inc. | 35 325 | 1,08 | 1 117 | |||||
| 2025-07-11 | 13F | Farther Finance Advisors, LLC | 7 107 | −54,94 | 225 | −50,33 | ||||
| 2025-08-06 | 13F | Wedbush Securities Inc | 9 549 | 0 | ||||||
| 2025-07-25 | 13F | Cwm, Llc | 1 441 | −30,08 | 0 | |||||
| 2025-08-13 | 13F | Jones Financial Companies Lllp | 33 234 | 143,49 | 1 050 | 166,92 | ||||
| 2025-07-28 | 13F | BRYN MAWR TRUST Co | 1 952 | 39,43 | 62 | 56,41 | ||||
| 2025-08-14 | 13F | Alaska Permanent Fund Corp | 0 | −100,00 | 0 | |||||
| 2025-08-29 | NP | GDMA - Gadsden Dynamic Multi-Asset ETF | 96 533 | 78,36 | 3 053 | 98,12 | ||||
| 2025-08-14 | 13F | Harmony Asset Management Llc | 26 009 | −5,22 | 823 | 5,25 | ||||
| 2025-08-11 | 13F | Empowered Funds, LLC | 97 689 | 80,49 | 3 090 | 100,45 | ||||
| 2025-08-13 | 13F | Baird Financial Group, Inc. | 44 359 | 2,20 | 1 403 | 13,51 | ||||
| 2025-07-23 | 13F | Friedenthal Financial | 3 963 | −3,03 | 125 | 7,76 | ||||
| 2025-08-04 | 13F | Pensionmark Financial Group, Llc | 24 300 | 20,34 | 769 | 33,57 | ||||
| 2025-07-29 | 13F | Wealthstream Advisors, Inc. | 7 616 | 241 | ||||||
| 2025-08-12 | 13F | Edmond De Rothschild Holding S.a. | 2 450 | 0,00 | 77 | 11,59 | ||||
| 2025-08-13 | 13F | Johnson Financial Group, Inc. | 698 | 22 | ||||||
| 2025-08-14 | 13F | Raymond James Financial Inc | 766 490 | 40,01 | 24 244 | 55,45 | ||||
| 2025-08-14 | 13F | Unisphere Establishment | 222 500 | −33,08 | 7 038 | −25,71 | ||||
| 2025-08-06 | 13F | SOUTH STATE Corp | 0 | −100,00 | 0 | |||||
| 2025-08-14 | 13F | 1607 Capital Partners, LLC | 485 884 | 15 369 | ||||||
| 2025-08-14 | 13F | Clark Capital Management Group, Inc. | 111 455 | −9,70 | 3 525 | 0,26 | ||||
| 2025-07-24 | 13F | Ronald Blue Trust, Inc. | 340 | 0,00 | 11 | 11,11 | ||||
| 2025-05-12 | 13F | C2P Capital Advisory Group, LLC d.b.a. Prosperity Capital Advisors | 0 | −100,00 | 0 | −100,00 | ||||
| 2025-07-22 | 13F | Belpointe Asset Management LLC | 10 516 | 5,16 | 333 | 16,90 | ||||
| 2025-08-11 | 13F | TD Waterhouse Canada Inc. | 8 198 | 278,84 | 258 | 322,95 | ||||
| 2025-08-06 | 13F | Savant Capital, LLC | 15 295 | 35,90 | 484 | 50,94 | ||||
| 2025-08-14 | 13F | Smartleaf Asset Management LLC | 18 | 0,00 | 1 | |||||
| 2025-08-08 | 13F | Pnc Financial Services Group, Inc. | 3 033 | 56,99 | 96 | 72,73 | ||||
| 2025-08-11 | 13F | Citigroup Inc | 1 397 | 0,00 | 44 | 12,82 | ||||
| 2025-08-01 | 13F | Bessemer Group Inc | 0 | −100,00 | 0 | |||||
| 2025-08-14 | 13F | Two Sigma Securities, Llc | 0 | −100,00 | 0 | |||||
| 2025-08-12 | 13F | CIBC Private Wealth Group, LLC | 751 | 5,63 | 24 | 35,29 | ||||
| 2025-08-11 | 13F | Principal Securities, Inc. | 1 076 | 321,96 | 34 | 580,00 | ||||
| 2025-04-28 | 13F | First Horizon Advisors, Inc. | 0 | −100,00 | 0 | |||||
| 2025-07-29 | NP | MVFG - Monarch Volume Factor Global Unconstrained Index ETF | 168 168 | 5 344 | ||||||
| 2025-03-12 | 13F/A | Private Capital Management Llc | 1 513 | 0,00 | 34 | −2,94 | ||||
| 2025-08-01 | 13F | MorganRosel Wealth Management, LLC | 305 | 0,00 | 10 | 12,50 | ||||
| 2025-08-14 | 13F | Comerica Bank | 39 377 | −13,95 | 1 245 | −4,45 | ||||
| 2025-08-14 | 13F | Murphy & Mullick Capital Management Corp | 302 | 0,00 | 10 | 12,50 | ||||
| 2025-08-12 | 13F | 17 Capital Partners, Llc | 12 310 | 35,27 | 389 | 50,19 | ||||
| 2025-07-02 | 13F/A | Bank Of Nova Scotia | 0 | −100,00 | 0 | |||||
| 2025-08-13 | 13F | Twin Peaks Wealth Advisors, LLC | 270 | 9 | ||||||
| 2025-07-30 | 13F | Brookstone Capital Management | 6 590 | 208 | ||||||
| 2025-08-13 | 13F | GeoWealth Management, LLC | 14 545 | 37,61 | 460 | 52,82 | ||||
| 2025-08-14 | 13F | Philadelphia Financial Management of San Francisco, LLC | Put | 0 | −100,00 | 0 | ||||
| 2025-07-21 | 13F | Crews Bank & Trust | 140 | 4 | ||||||
| 2025-08-14 | 13F | Mercer Global Advisors Inc /adv | 10 987 | 3,48 | 348 | 14,90 | ||||
| 2025-08-19 | 13F | Newbridge Financial Services Group, Inc. | 160 | 0,00 | 5 | 25,00 | ||||
| 2025-08-04 | 13F | Atria Investments Llc | 7 416 | 235 | ||||||
| 2025-08-08 | 13F | Capital Investment Advisory Services, LLC | 1 591 | 16,30 | 50 | 31,58 | ||||
| 2025-05-15 | 13F | Glenmede Trust Co Na | 16 524 | 0,00 | 471 | 22,08 | ||||
| 2025-07-18 | 13F | Truist Financial Corp | 98 877 | 50,17 | 3 127 | 66,77 | ||||
| 2025-08-13 | 13F | Renaissance Technologies Llc | 110 000 | 52,97 | 3 479 | 69,87 | ||||
| 2025-08-13 | 13F | PineBridge Investments, L.P. | 9 548 | −91,40 | 302 | −90,45 | ||||
| 2025-08-14 | 13F | CIBC World Markets Inc. | 14 313 | −14,19 | 453 | −4,84 | ||||
| 2025-08-13 | 13F | bLong Financial, LLC | 485 074 | 72,28 | 15 343 | 91,27 | ||||
| 2025-08-04 | 13F | Integrity Alliance, Llc. | 6 975 | 221 | ||||||
| 2025-08-14 | 13F | Old Mission Capital Llc | 33 466 | 1 059 | ||||||
| 2025-08-14 | 13F | Qube Research & Technologies Ltd | 237 367 | 23 355,24 | 7 508 | 26 710,71 | ||||
| 2025-08-12 | 13F | SRS Capital Advisors, Inc. | 622 | 0,00 | 20 | 11,76 | ||||
| 2025-07-15 | 13F | Fifth Third Bancorp | 0 | −100,00 | 0 | |||||
| 2025-08-12 | 13F | Cumberland Partners Ltd | 127 435 | 3,66 | 4 031 | 15,08 | ||||
| 2025-08-14 | 13F | Susquehanna International Group, Llp | Call | 10 500 | 332 | |||||
| 2025-08-14 | 13F | Susquehanna International Group, Llp | Put | 32 800 | −2,67 | 1 037 | 8,02 | |||
| 2025-08-12 | 13F | Jpmorgan Chase & Co | 6 598 096 | −20,16 | 208 698 | −11,36 | ||||
| 2025-08-04 | 13F | Assetmark, Inc | 2 595 130 | 82 084 | ||||||
| 2025-08-18 | 13F | Wolverine Trading, Llc | Put | 13 900 | 49,46 | 439 | 63,81 | |||
| 2025-07-14 | 13F | Farmers & Merchants Investments Inc | 1 708 | 0,00 | 54 | 12,50 | ||||
| 2025-08-14 | 13F | Bnp Paribas Arbitrage, Sa | 0 | −100,00 | 0 | |||||
| 2025-07-18 | 13F | TruNorth Capital Management, LLC | 135 | 0,00 | 4 | 33,33 | ||||
| 2025-08-14 | 13F | Barometer Capital Management Inc. | 15 950 | −34,23 | 504 | −26,96 | ||||
| 2025-08-04 | 13F | Waterfront Wealth Inc. | 244 320 | 0,83 | 7 728 | 11,94 | ||||
| 2025-08-11 | 13F | Brown Brothers Harriman & Co | 16 | 0,00 | 1 | |||||
| 2025-07-23 | 13F | Viewpoint Capital Management LLC | 124 541 | −0,18 | 3 939 | 10,83 | ||||
| 2025-07-30 | 13F | Parcion Private Wealth LLC | 12 650 | 0,00 | 400 | 11,11 | ||||
| 2025-08-04 | 13F | Creative Financial Designs Inc /adv | 1 785 | 0,73 | 56 | 12,00 | ||||
| 2025-07-15 | 13F | FLP Wealth Management, LLC | 0 | −100,00 | 0 | |||||
| 2025-08-01 | 13F | Solstein Capital, LLC | 220 | 0,00 | 7 | 0,00 | ||||
| 2025-08-11 | 13F | Private Advisor Group, LLC | 12 336 | 17,63 | 390 | 30,87 | ||||
| 2025-08-13 | 13F | Azimuth Capital Investment Management LLC | 586 420 | 7,67 | 18 548 | 19,54 | ||||
| 2025-07-16 | 13F | Signaturefd, Llc | 102 | 70,00 | 3 | 200,00 | ||||
| 2025-08-12 | 13F | AlphaCore Capital LLC | 82 | −85,06 | 3 | −86,67 | ||||
| 2025-07-24 | 13F | Rice Partnership, LLC | 2 553 | 0,00 | 81 | 11,11 | ||||
| 2025-08-12 | 13F | Coldstream Capital Management Inc | 0 | −100,00 | 0 | |||||
| 2025-08-08 | 13F | Empower Advisory Group, LLC | 7 875 | 249 | ||||||
| 2025-07-31 | 13F | LJI Wealth Management, LLC | 9 005 | 0,00 | 285 | 10,94 | ||||
| 2025-08-13 | 13F | AMJ Financial Wealth Management | 8 134 | 257 |