Grundläggande statistik
| Institutionella ägare | 191 total, 191 long only, 0 short only, 0 long/short - change of −0,52% MRQ |
| Genomsnittlig portföljallokering | 0.1545 % - change of 8,11% MRQ |
| Institutionella aktier (lång) | 36 418 267 (ex 13D/G) - change of 0,01MM shares 0,02% MRQ |
| Institutionellt värde (lång) | $ 540 001 USD ($1000) |
Institutionellt ägande och aktieägare
Eaton Vance Tax-Managed Diversified Equity Income Fund (US:ETY) har 191 Institutionella ägare och aktieägare som har lämnat in 13D/G- eller 13F-formulär till Securities Exchange Commission (SEC). Dessa institut innehar totalt 36,418,267 aktier. Största aktieägare inkluderar Morgan Stanley, Raymond James Financial Inc, Wells Fargo & Company/mn, Invesco Ltd., PCEF - Invesco CEF Income Composite ETF, LPL Financial LLC, Principal Securities, Inc., Guggenheim Capital Llc, RFG Advisory, LLC, and Bank Of America Corp /de/ .
Eaton Vance Tax-Managed Diversified Equity Income Fund (NYSE:ETY) Institutionell ägarstruktur visar institutioners och fonders nuvarande positioner i företaget, samt de senaste förändringarna i positionernas storlek. Större aktieägare kan vara enskilda investerare, fonder, hedgefonder eller institutioner. Bilaga 13D visar att investeraren äger (eller ägde) mer än 5% av företaget och avser (eller avsåg) att aktivt eftersträva en förändring av affärsstrategin. Schedule 13G indikerar en passiv investering på över 5%.
The share price as of September 12, 2025 is 15,94 / share. Previously, on September 16, 2024, the share price was 14,39 / share. This represents an increase of 10,77% over that period.

Fondsentimentets poäng
Fondsentimentet poängen(fka Ägarackumulation-poäng) visar vilka aktier som är mest köpta av fonder. Det är resultatet av en sofistikerad kvantitativ flerfaktormodell som identifierar företag med de högsta nivåerna av institutionell ackumulering. Poängsättningsmodellen använder en kombination av den totala ökningen av redovisade ägare, förändringarna i portföljallokeringarna för dessa ägare och andra mått. Siffran sträcker sig från 0 till 100, där högre siffror indikerar en högre nivå av ackumulering i förhållande till sina konkurrenter, och 50 är genomsnittet.
Uppdateringsfrekvens: Dagligen
Se Ownership Explorer, som innehåller en lista över de högst rankade företagen.
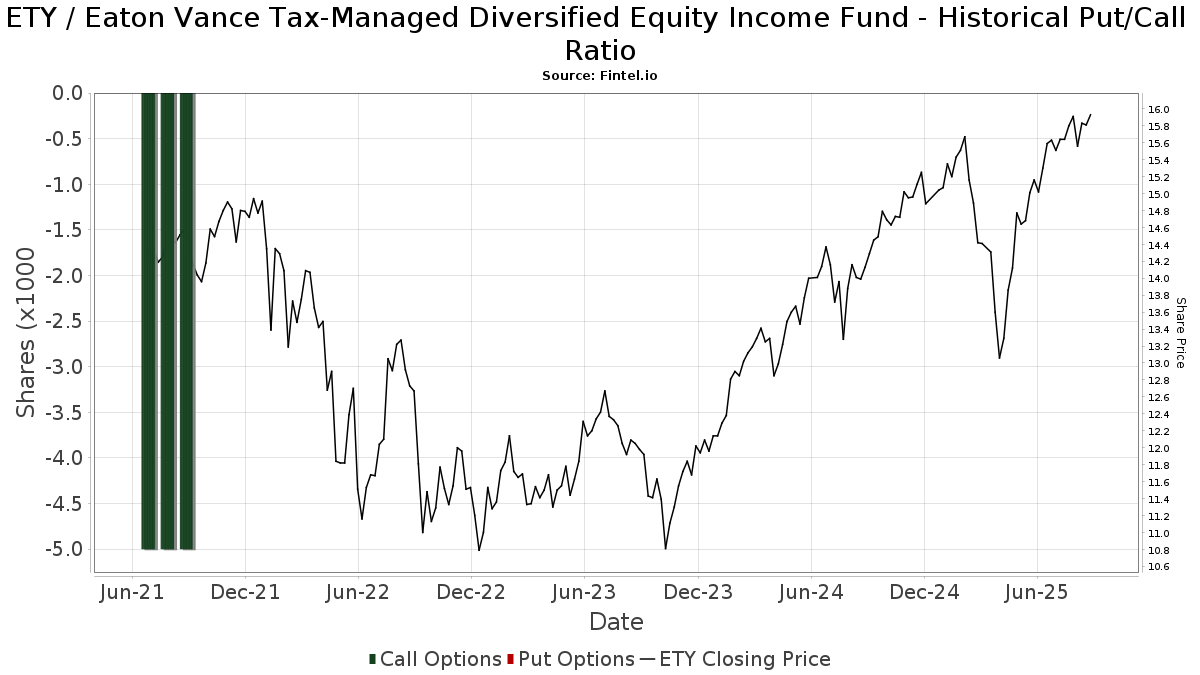
Institutionell sälj/köp-kvot
Förutom att rapportera vanliga eget kapital- och skuldemissioner måste institutioner med mer än 100MM tillgångar under förvaltning också avslöja sina innehav av sälj- och köpoptioner. Eftersom säljoptioner i allmänhet indikerar ett negativt sentiment och köpoptioner indikerar ett positivt sentiment, kan vi få en uppfattning om det övergripande institutionella sentimentet genom att plotta förhållandet mellan säljoptioner och köpoptioner. Diagrammet till höger visar det historiska förhållandet mellan sälj- och köpoptioner för detta instrument.
Genom att använda sälj/köp-kvoten som en indikator på aktieägarnas sentiment undviker man en av de största bristerna med att använda det totala institutionella ägandet, nämligen att en betydande del av de förvaltade tillgångarna investeras passivt för att följa index. Passivt förvaltade fonder köper vanligtvis inte optioner, så indikatorn för sälj/köp-kvoten ger en bättre bild av stämningen i aktivt förvaltade fonder.
13F- och NPORT-arkiveringar
Detaljer om 13F-arkiveringar är gratis. Detaljer om NP-arkiveringar kräver ett premiummedlemskap. Gröna rader indikerar nya positioner. Röda rader indikerar stängda positioner. Klicka på länk symbolen för att se hela transaktionshistoriken.
Uppgradera
för att låsa upp premiumdata och exportera till Excel ![]() .
.
| Fil Datum | Källa | Investerare | Typ | Genomsnittligt pris (beräknat) |
Aktier | Δ Aktier (%) |
Rapporterat värde (1000 USD) |
Δ Värde (%) |
Portföljallokering (%) |
|
|---|---|---|---|---|---|---|---|---|---|---|
| 2025-08-08 | 13F | Creative Planning | 46 113 | 41,29 | 713 | 53,33 | ||||
| 2025-08-12 | 13F | Jefferies Financial Group Inc. | 18 836 | 31,53 | 291 | 42,65 | ||||
| 2025-06-12 | 13F/A | Deutsche Bank Ag\ | 0 | −100,00 | 0 | |||||
| 2025-08-13 | 13F | Cerity Partners LLC | 28 792 | 38,10 | 445 | 49,83 | ||||
| 2025-07-22 | 13F | Confluence Wealth Services, Inc. | 19 312 | 1,71 | 299 | 18,25 | ||||
| 2025-08-12 | 13F | WealthTrak Capital Management LLC | 494 | 0,00 | 8 | 0,00 | ||||
| 2025-08-13 | 13F | Baird Financial Group, Inc. | 518 461 | 5,71 | 8 021 | 14,69 | ||||
| 2025-08-07 | 13F | Cvfg Llc | 12 944 | 15,10 | 200 | 25,00 | ||||
| 2025-07-29 | 13F | Salomon & Ludwin, LLC | 992 | 0,00 | 15 | 7,14 | ||||
| 2025-08-18 | 13F | Geneos Wealth Management Inc. | 13 910 | 125,45 | 215 | 147,13 | ||||
| 2025-04-18 | 13F | Insigneo Advisory Services, Llc | 0 | −100,00 | 0 | −100,00 | ||||
| 2025-07-17 | 13F | City Holding Co | 0 | −100,00 | 0 | |||||
| 2025-08-14 | 13F | Kovitz Investment Group Partners, LLC | 16 282 | 56,39 | 252 | 69,59 | ||||
| 2025-08-14 | 13F | Monograph Wealth Advisors, Llc | 18 288 | 0,02 | 283 | 8,46 | ||||
| 2025-08-08 | 13F | Capital Investment Advisory Services, LLC | 19 674 | 74,40 | 304 | 90,00 | ||||
| 2025-08-13 | 13F | Mount Yale Investment Advisors, LLC | 2 333 | 36 | ||||||
| 2025-07-17 | 13F | Uncommon Cents Investing LLC | 10 384 | 0,00 | 161 | 8,11 | ||||
| 2025-07-24 | 13F | IFP Advisors, Inc | 1 041 | −34,94 | 16 | −27,27 | ||||
| 2025-07-31 | 13F | Curio Wealth, Llc | 0 | −100,00 | 0 | |||||
| 2025-07-31 | 13F | Cambridge Investment Research Advisors, Inc. | 390 591 | −11,36 | 6 | 0,00 | ||||
| 2025-08-08 | 13F | Cetera Investment Advisers | 241 286 | 15,14 | 3 733 | 24,90 | ||||
| 2025-07-30 | 13F | Princeton Global Asset Management LLC | 4 983 | 0,00 | 77 | 8,45 | ||||
| 2025-08-06 | 13F | Moors & Cabot, Inc. | 0 | −100,00 | 0 | |||||
| 2025-07-29 | 13F | Stratos Wealth Advisors, LLC | 34 269 | 0,00 | 530 | 8,61 | ||||
| 2025-07-10 | 13F | Oliver Lagore Vanvalin Investment Group | 12 755 | −3,37 | 182 | −8,12 | ||||
| 2025-05-02 | 13F | Dakota Wealth Management | 0 | −100,00 | 0 | |||||
| 2025-08-13 | 13F | Guggenheim Capital Llc | 1 036 165 | 7,76 | 16 029 | 16,91 | ||||
| 2025-08-29 | 13F | Centaurus Financial, Inc. | 42 136 | −11,77 | 1 | |||||
| 2025-08-12 | 13F | Proequities, Inc. | 0 | 0 | ||||||
| 2025-08-08 | 13F | Kane Investment Management, Inc. | 0 | −100,00 | 0 | |||||
| 2025-07-15 | 13F | Beacon Investment Advisory Services, Inc. | 10 000 | 0,00 | 155 | 8,45 | ||||
| 2025-07-29 | 13F | Stratos Wealth Partners, LTD. | 13 728 | 7,17 | 212 | 16,48 | ||||
| 2025-07-29 | 13F | Burford Brothers, Inc. | 21 400 | 0,00 | 331 | 8,52 | ||||
| 2025-08-05 | 13F | GPS Wealth Strategies Group, LLC | 233 555 | −0,55 | 3 613 | 7,92 | ||||
| 2025-08-14 | 13F | CoreFirst Bank & Trust | 625 | 10 | ||||||
| 2025-08-12 | 13F | CIBC Private Wealth Group, LLC | 2 412 | 0,00 | 37 | 27,59 | ||||
| 2025-08-13 | 13F | Nicolet Advisory Services, Llc | 23 634 | 0,00 | 366 | 17,68 | ||||
| 2025-08-01 | 13F | Transcend Wealth Collective, Llc | 10 428 | 161 | ||||||
| 2025-08-15 | 13F | Captrust Financial Advisors | 14 213 | −16,46 | 220 | −9,50 | ||||
| 2025-08-14 | 13F | Stifel Financial Corp | 423 473 | 8,05 | 6 551 | 17,23 | ||||
| 2025-08-12 | 13F | South Plains Financial, Inc. | 0 | −100,00 | 0 | |||||
| 2025-09-09 | 13F | NWF Advisory Services Inc. | 46 801 | −0,42 | 724 | 8,06 | ||||
| 2025-08-05 | 13F | Bank of New York Mellon Corp | 17 001 | −0,01 | 263 | 8,68 | ||||
| 2025-08-14 | 13F | Hrt Financial Lp | 0 | −100,00 | 0 | |||||
| 2025-07-14 | 13F | Golden State Equity Partners | 11 003 | 0,00 | 170 | 8,97 | ||||
| 2025-07-31 | 13F | Oppenheimer & Co Inc | 19 877 | 0,13 | 307 | 8,48 | ||||
| 2025-04-29 | 13F | Raleigh Capital Management Inc. | 0 | −100,00 | 0 | |||||
| 2025-08-12 | 13F | Quantum Private Wealth, LLC | 15 000 | −25,00 | 232 | −18,60 | ||||
| 2025-07-25 | 13F | Stephens Consulting, LLC | 0 | −100,00 | 0 | |||||
| 2025-07-28 | 13F | Mutual Advisors, LLC | 11 122 | 1,86 | 175 | 16,78 | ||||
| 2025-05-08 | 13F | Essential Planning, LLC. | 0 | −100,00 | 0 | |||||
| 2025-05-12 | 13F | Independent Advisor Alliance | 0 | −100,00 | 0 | |||||
| 2025-07-15 | 13F | Focused Wealth Management, Inc | 11 454 | −13,55 | 177 | −5,85 | ||||
| 2025-08-08 | 13F | Avantax Advisory Services, Inc. | 16 791 | 0,16 | 260 | 8,37 | ||||
| 2025-08-11 | 13F | Elequin Capital Lp | 1 155 | −85,10 | 18 | −84,55 | ||||
| 2025-08-13 | 13F | Smith, Moore & Co. | 67 626 | 15,84 | 1 046 | 25,72 | ||||
| 2025-05-05 | 13F | Transce3nd, LLC | 0 | −100,00 | 0 | |||||
| 2025-07-29 | 13F | Chicago Partners Investment Group LLC | 13 486 | 0,00 | 211 | 10,53 | ||||
| 2025-04-25 | 13F | Smallwood Wealth Investment Management, LLC | 2 437 | 35 | ||||||
| 2025-07-24 | 13F | Ronald Blue Trust, Inc. | 800 | 12 | ||||||
| 2025-08-14 | 13F | Goldman Sachs Group Inc | 100 000 | −14,20 | 1 547 | −6,86 | ||||
| 2025-08-14 | 13F | Wiley Bros.-aintree Capital, Llc | 40 250 | 177,17 | 623 | 201,94 | ||||
| 2025-07-11 | 13F | Farther Finance Advisors, LLC | 5 096 | 1,03 | 79 | 9,86 | ||||
| 2025-08-08 | 13F | Hartland & Co., LLC | 15 525 | 23,30 | 240 | 34,08 | ||||
| 2025-04-28 | 13F | Pinnacle Financial Partners Inc | 9 122 | −26,64 | 136 | −25,27 | ||||
| 2025-08-08 | 13F/A | Ignite Planners, LLC | 44 598 | −5,54 | 693 | 4,85 | ||||
| 2025-08-05 | 13F | Key FInancial Inc | 1 599 | 0,00 | 25 | 9,09 | ||||
| 2025-08-14 | 13F | Mml Investors Services, Llc | 28 508 | 10,13 | 0 | |||||
| 2025-08-07 | 13F | Vista Investment Partners Ii, Llc | 12 414 | 12,14 | 192 | 22,29 | ||||
| 2025-07-18 | 13F | Truist Financial Corp | 43 201 | 5,89 | 668 | 14,97 | ||||
| 2025-08-04 | 13F | ELCO Management Co., LLC | 46 400 | −2,11 | 718 | 6,22 | ||||
| 2025-08-19 | 13F | National Asset Management, Inc. | 10 337 | −61,37 | 160 | −60,15 | ||||
| 2025-07-24 | 13F | Us Bancorp \de\ | 8 863 | −0,78 | 137 | 7,87 | ||||
| 2025-07-28 | 13F | Harbour Investments, Inc. | 21 633 | 13,44 | 335 | 23,25 | ||||
| 2025-08-14 | 13F | Smartleaf Asset Management LLC | 234 | 0,00 | 4 | 0,00 | ||||
| 2025-08-14 | 13F | IHT Wealth Management, LLC | 357 335 | 4,17 | 5 528 | 13,00 | ||||
| 2025-08-05 | 13F | Summit Investment Advisory Services, LLC | 0 | −100,00 | 0 | |||||
| 2025-07-30 | 13F | D.a. Davidson & Co. | 18 011 | 2,86 | 279 | 11,65 | ||||
| 2025-08-07 | 13F | Cypress Capital Management LLC (WY) | 280 492 | 141,32 | 4 339 | 161,86 | ||||
| 2025-07-15 | 13F | MCF Advisors LLC | 1 744 | 0,00 | 27 | 8,33 | ||||
| 2025-08-12 | 13F | LPL Financial LLC | 1 174 809 | 3,77 | 18 174 | 12,57 | ||||
| 2025-08-12 | 13F | Putnam Fl Investment Management Co | 42 458 | −0,57 | 657 | 7,89 | ||||
| 2025-08-12 | 13F | Global Retirement Partners, LLC | 9 282 | −50,37 | 144 | −48,75 | ||||
| 2025-08-19 | 13F | Newbridge Financial Services Group, Inc. | 39 668 | 614 | ||||||
| 2025-08-07 | 13F | Commerce Bank | 30 743 | 0,00 | 476 | 8,45 | ||||
| 2025-08-15 | 13F | Morgan Stanley | 12 285 081 | −0,79 | 190 050 | 7,63 | ||||
| 2025-07-17 | 13F | Sonora Investment Management Group, LLC | 10 312 | 0,00 | 160 | 8,16 | ||||
| 2025-08-14 | 13F | Cohen & Steers, Inc. | 295 617 | 0,00 | 5 | 0,00 | ||||
| 2025-07-17 | 13F | Greenleaf Trust | 39 274 | −4,99 | 608 | 3,06 | ||||
| 2025-08-04 | 13F | L.m. Kohn & Company | 18 964 | 33,14 | 293 | 44,33 | ||||
| 2025-07-30 | 13F | Dudley Capital Management, Llc | 11 986 | 0,76 | 185 | 9,47 | ||||
| 2025-07-25 | 13F | Atria Wealth Solutions, Inc. | 54 625 | 88,78 | 845 | 105,10 | ||||
| 2025-08-14 | 13F | EP Wealth Advisors, Inc. | 29 485 | 456 | ||||||
| 2025-07-28 | NP | PCEF - Invesco CEF Income Composite ETF This fund is a listed as child fund of Invesco Ltd. and if that institution has disclosed ownership in this security, then these positions will not be double counted when calculating total shares and total value | 1 325 862 | −13,66 | 19 848 | −14,52 | ||||
| 2025-08-11 | 13F | HighTower Advisors, LLC | 298 312 | 2,98 | 4 615 | 11,72 | ||||
| 2025-05-15 | 13F | Lido Advisors, LLC | 0 | −100,00 | 0 | |||||
| 2025-08-08 | 13F | Wealth Alliance | 19 224 | 4,69 | 297 | 13,79 | ||||
| 2025-07-22 | 13F | Merit Financial Group, LLC | 130 897 | 3,69 | 2 025 | 12,44 | ||||
| 2025-08-14 | 13F | UBS Group AG | 467 163 | −0,50 | 7 227 | 7,95 | ||||
| 2025-08-11 | 13F | Aptus Capital Advisors, LLC | 166 110 | 0,00 | 2 570 | 8,49 | ||||
| 2025-07-29 | 13F | International Assets Investment Management, Llc | 41 415 | 4,54 | 641 | 13,48 | ||||
| 2025-08-15 | 13F | CI Private Wealth, LLC | 30 474 | −7,02 | 471 | 0,86 | ||||
| 2025-07-29 | 13F | Activest Wealth Management | 3 325 | −41,09 | 51 | −36,25 | ||||
| 2025-08-08 | 13F | Kingsview Wealth Management, LLC | 77 215 | 30,88 | 1 195 | 41,97 | ||||
| 2025-07-30 | 13F | Bogart Wealth, LLC | 3 231 | 0,00 | 50 | 6,52 | ||||
| 2025-08-12 | 13F | MAI Capital Management | 6 991 | 1,27 | 108 | 10,20 | ||||
| 2025-08-01 | 13F | Chilton Capital Management Llc | 3 700 | 0,00 | 57 | 9,62 | ||||
| 2025-05-14 | 13F | Synovus Financial Corp | 0 | −100,00 | 0 | |||||
| 2025-07-30 | 13F | Retirement Planning Group | 10 139 | 0,00 | 157 | 8,33 | ||||
| 2025-07-24 | 13F | Eastern Bank | 2 344 | 0,00 | 36 | 9,09 | ||||
| 2025-04-28 | 13F | Redmont Wealth Advisors Llc | 5 138 | 73 | ||||||
| 2025-05-09 | 13F | Shaker Financial Services, LLC | 0 | −100,00 | 0 | |||||
| 2025-08-04 | 13F | Assetmark, Inc | 3 325 | 68,27 | 51 | 82,14 | ||||
| 2025-07-29 | 13F | Private Trust Co Na | 4 035 | 0,00 | 62 | 8,77 | ||||
| 2025-07-09 | 13F | Byrne Asset Management LLC | 400 | 0,00 | 6 | 20,00 | ||||
| 2025-07-23 | 13F | Morey & Quinn Wealth Partners, LLC | 49 046 | 15,54 | 759 | 25,29 | ||||
| 2025-07-22 | 13F | Cedar Mountain Advisors, LLC | 768 | 0,00 | 12 | 10,00 | ||||
| 2025-08-14 | 13F | Mariner, LLC | 44 250 | 20,64 | 685 | 30,78 | ||||
| 2025-08-15 | 13F | Kestra Advisory Services, LLC | 95 777 | 27,22 | 1 482 | 38,02 | ||||
| 2025-04-21 | 13F | Nelson, Van Denburg & Campbell Wealth Management Group, LLC | 0 | −100,00 | 0 | |||||
| 2025-07-21 | 13F | Barrett & Company, Inc. | 3 250 | 0,00 | 50 | 8,70 | ||||
| 2025-08-12 | 13F | Ameritas Investment Partners, Inc. | 35 085 | 8,33 | 543 | 17,57 | ||||
| 2025-08-14 | 13F | Atomi Financial Group, Inc. | 77 507 | 3,55 | 1 199 | 12,37 | ||||
| 2025-08-12 | 13F | J.w. Cole Advisors, Inc. | 24 653 | −6,08 | 381 | 1,87 | ||||
| 2025-08-01 | 13F | Twin Lakes Capital Management, LLC | 3 181 | 2,02 | 49 | 11,36 | ||||
| 2025-08-12 | 13F | Gladstone Institutional Advisory LLC | 56 500 | 0,16 | 874 | 8,71 | ||||
| 2025-08-14 | 13F | Mendel Capital Management LLC | 20 188 | −16,41 | 312 | −9,30 | ||||
| 2025-07-17 | 13F | C2C Wealth Management, LLC | 238 094 | −2,18 | 3 683 | 6,14 | ||||
| 2025-08-14 | 13F | Guardian Wealth Advisors, Llc / Nc | 164 610 | 0,00 | 2 547 | 8,48 | ||||
| 2025-07-14 | 13F/A | Seek First Inc. | 20 998 | 26,88 | 325 | 37,87 | ||||
| 2025-08-14 | 13F | Comerica Bank | 95 647 | −3,51 | 1 480 | 4,67 | ||||
| 2025-08-15 | 13F | Equitable Holdings, Inc. | 13 050 | 4,03 | 202 | 12,92 | ||||
| 2025-07-11 | 13F | Kapstone Financial Advisors LLC | 11 266 | 2,74 | 174 | 11,54 | ||||
| 2025-08-12 | 13F | Change Path, LLC | 14 169 | −84,25 | 219 | −82,92 | ||||
| 2025-08-14 | 13F | Mercer Global Advisors Inc /adv | 24 861 | −0,36 | 385 | 8,17 | ||||
| 2025-07-08 | 13F | Parallel Advisors, LLC | 5 000 | −60,74 | 77 | −57,46 | ||||
| 2025-07-10 | 13F | Exchange Traded Concepts, Llc | 3 809 | 59 | ||||||
| 2025-08-15 | 13F | Blue Chip Partners, Inc. | 15 447 | 0,00 | 239 | 8,18 | ||||
| 2025-08-08 | 13F | Flaharty Asset Management, LLC | 34 107 | 4,15 | 528 | 13,09 | ||||
| 2025-08-12 | 13F | Jpmorgan Chase & Co | 2 987 | −28,09 | 46 | −22,03 | ||||
| 2025-08-06 | 13F | Commonwealth Equity Services, Llc | 239 474 | 10,61 | 4 | 0,00 | ||||
| 2025-08-11 | 13F | Private Advisor Group, LLC | 225 324 | 0,54 | 3 486 | 9,08 | ||||
| 2025-08-14 | 13F | Garden State Investment Advisory Services LLC | 14 407 | 0,41 | 223 | 8,82 | ||||
| 2025-07-18 | 13F | Parsons Capital Management Inc/ri | 150 136 | −5,70 | 2 323 | 2,29 | ||||
| 2025-08-08 | 13F | TD Capital Management LLC | 1 302 | 0,00 | 20 | 11,11 | ||||
| 2025-08-07 | 13F | Hughes Financial Services, LLC | 2 121 | 0,00 | 34 | 10,00 | ||||
| 2025-07-14 | 13F | AdvisorNet Financial, Inc | 618 | 10 | ||||||
| 2025-08-01 | 13F | Envestnet Asset Management Inc | 19 572 | 4,52 | 303 | 13,11 | ||||
| 2025-05-13 | 13F | Northern Trust Corp | 0 | −100,00 | 0 | |||||
| 2025-07-16 | 13F | Formidable Asset Management, LLC | 35 852 | 0,00 | 511 | 0,00 | ||||
| 2025-08-05 | 13F | Mission Wealth Management, Lp | 14 499 | −12,12 | 224 | −4,68 | ||||
| 2025-08-14 | 13F/A | Rockefeller Capital Management L.P. | 301 117 | 2,49 | 4 658 | 11,20 | ||||
| 2025-08-14 | 13F | Wells Fargo & Company/mn | 1 954 890 | 4,04 | 30 242 | 12,87 | ||||
| 2025-07-30 | 13F | Capital Wealth Alliance, LLC | 16 470 | 0,00 | 255 | 8,55 | ||||
| 2025-07-21 | 13F | Compass Planning Associates Inc | 17 450 | 0,00 | 270 | 8,47 | ||||
| 2025-08-05 | 13F | Dunhill Financial, LLC | 533 | 8 | ||||||
| 2025-08-13 | 13F | Beacon Pointe Advisors, LLC | 21 918 | 0,00 | 339 | 8,65 | ||||
| 2025-07-10 | 13F | Wealth Enhancement Advisory Services, Llc | 42 163 | 4,51 | 660 | 14,78 | ||||
| 2025-07-29 | 13F | Stephens Inc /ar/ | 10 734 | 0,37 | 166 | 9,21 | ||||
| 2025-08-13 | 13F | Millstone Evans Group, LLC | 6 322 | 0,00 | 98 | 7,78 | ||||
| 2025-07-11 | 13F | Kingstone Capital Partners Texas, LLC | 23 948 | 0 | ||||||
| 2025-08-13 | 13F | Invesco Ltd. | 1 513 968 | −0,62 | 23 421 | 7,82 | ||||
| 2025-08-13 | 13F/A | StoneX Group Inc. | 0 | −100,00 | 0 | −100,00 | ||||
| 2025-08-14 | 13F | Ameriprise Financial Inc | 410 548 | −52,51 | 6 327 | −48,68 | ||||
| 2025-07-14 | 13F | U.S. Capital Wealth Advisors, LLC | 19 105 | −57,14 | 296 | −53,54 | ||||
| 2025-08-12 | 13F | Heron Bay Capital Management | 406 483 | 28,38 | 6 288 | 39,27 | ||||
| 2025-04-17 | 13F | Fortitude Advisory Group L.L.C. | 0 | −100,00 | 0 | −100,00 | ||||
| 2025-08-14 | 13F | Matrix Private Capital Group Llc | 629 694 | −2,67 | 9 741 | 5,59 | ||||
| 2025-08-11 | 13F | HHM Wealth Advisors, LLC | 3 587 | 2,05 | 55 | 10,00 | ||||
| 2025-08-15 | 13F | Tower Research Capital LLC (TRC) | 4 | −50,00 | 0 | |||||
| 2025-08-12 | 13F | BlackRock, Inc. | 7 377 | 0,00 | 114 | 8,57 | ||||
| 2025-08-14 | 13F | Royal Bank Of Canada | 713 247 | 1,87 | 11 033 | 10,51 | ||||
| 2025-08-11 | 13F | Hexagon Capital Partners LLC | 0 | −100,00 | 0 | |||||
| 2025-08-13 | 13F | Northwestern Mutual Wealth Management Co | 22 374 | −0,63 | 346 | 7,79 | ||||
| 2025-08-11 | 13F | Principal Securities, Inc. | 1 134 479 | 7,16 | 17 550 | 10,89 | ||||
| 2025-08-12 | 13F | Advisors Asset Management, Inc. | 292 815 | 14,59 | 4 530 | 24,32 | ||||
| 2025-08-28 | NP | Cohen & Steers Closed-end Opportunity Fund, Inc. | 295 617 | 0,00 | 4 573 | 8,49 | ||||
| 2025-08-04 | 13F | Syverson Strege & Co | 17 665 | 0,00 | 273 | 8,76 | ||||
| 2025-08-14 | 13F | Arete Wealth Advisors, LLC | 27 122 | −0,35 | 0 | |||||
| 2025-05-08 | 13F | Plante Moran Financial Advisors, LLC | 0 | −100,00 | 0 | |||||
| 2025-05-13 | 13F | M Holdings Securities, Inc. | 0 | −100,00 | 0 | |||||
| 2025-05-20 | 13F/A | Colony Group, LLC | 0 | −100,00 | 0 | −100,00 | ||||
| 2025-08-12 | 13F | Steward Partners Investment Advisory, Llc | 196 325 | 6,35 | 3 037 | 15,39 | ||||
| 2025-07-15 | 13F | SJS Investment Consulting Inc. | 65 | 1 | ||||||
| 2025-07-25 | 13F | Concurrent Investment Advisors, LLC | 21 771 | 337 | ||||||
| 2025-07-17 | 13F | Sound Income Strategies, LLC | 2 667 | 0,00 | 41 | 7,89 | ||||
| 2025-08-07 | 13F | Allworth Financial LP | 7 967 | 0,00 | 123 | 14,95 | ||||
| 2025-08-14 | 13F | CoreCap Advisors, LLC | 336 018 | 3,46 | 5 198 | 12,24 | ||||
| 2025-08-08 | 13F | Pnc Financial Services Group, Inc. | 43 446 | 0,00 | 672 | 8,56 | ||||
| 2025-07-01 | 13F | Harbor Investment Advisory, Llc | 0 | −100,00 | 0 | |||||
| 2025-07-22 | 13F | Mascoma Wealth Management LLC | 3 190 | 0,00 | 49 | 8,89 | ||||
| 2025-08-25 | 13F/A | Neuberger Berman Group LLC | 11 312 | 0,00 | 175 | 8,07 | ||||
| 2025-09-04 | 13F/A | Advisor Group Holdings, Inc. | 551 166 | −9,90 | 8 527 | −2,26 | ||||
| 2025-08-13 | 13F | Brown Advisory Inc | 13 063 | −6,29 | 202 | 2,02 | ||||
| 2025-07-25 | 13F | Cwm, Llc | 1 084 | −84,43 | 0 | |||||
| 2025-08-05 | 13F | Strategic Financial Concepts, LLC | 15 415 | −0,39 | 238 | 8,18 | ||||
| 2025-07-17 | 13F | Janney Montgomery Scott LLC | 314 945 | 1,61 | 5 | 0,00 | ||||
| 2025-05-14 | 13F | Karpus Management, Inc. | 0 | −100,00 | 0 | |||||
| 2025-08-04 | 13F | Spire Wealth Management | 1 000 | 0,00 | 15 | 7,14 | ||||
| 2025-08-14 | 13F | Gen-Wealth Partners Inc | 850 | 0,00 | 13 | 8,33 | ||||
| 2025-07-28 | 13F | Frazier Financial Advisors, LLC | 95 | 0,00 | 1 | 0,00 | ||||
| 2025-07-21 | 13F | Ameritas Advisory Services, LLC | 37 265 | −27,73 | 576 | −25,19 | ||||
| 2025-08-13 | 13F | Rsm Us Wealth Management Llc | 27 393 | 0,00 | 424 | 8,46 | ||||
| 2025-08-14 | 13F | LaSalle St. Investment Advisors, LLC | 0 | −100,00 | 0 | |||||
| 2025-04-25 | 13F | Intelligence Driven Advisers, LLC | 0 | −100,00 | 0 | |||||
| 2025-07-15 | 13F | Wealth Effects Llc | 43 812 | −11,63 | 678 | −4,11 | ||||
| 2025-08-14 | 13F | Raymond James Financial Inc | 2 643 146 | 1,91 | 40 889 | 10,56 | ||||
| 2025-07-09 | 13F | David J Yvars Group | 40 622 | 1,20 | 628 | 9,98 | ||||
| 2025-07-09 | 13F | Fiduciary Alliance LLC | 22 450 | 347 | ||||||
| 2025-08-06 | 13F | Wedbush Securities Inc | 139 198 | −0,07 | 2 | 100,00 | ||||
| 2025-07-08 | 13F | Webster Bank, N. A. | 4 825 | 0,00 | 75 | 8,82 | ||||
| 2025-08-12 | 13F | Inscription Capital, LLC | 10 132 | −13,40 | 157 | 0,00 | ||||
| 2025-07-15 | 13F | Financial Management Professionals, Inc. | 1 000 | 0,00 | 15 | 7,14 | ||||
| 2025-07-31 | 13F | Strait & Sound Wealth Management LLC | 38 250 | 0,28 | 592 | 8,84 | ||||
| 2025-08-14 | 13F | Bank Of America Corp /de/ | 808 900 | 4,36 | 12 514 | 13,21 | ||||
| 2025-08-21 | 13F | Pathway Financial Advisers, LLC | 385 599 | 3,55 | 5 965 | 12,34 | ||||
| 2025-07-15 | 13F | LVZ Advisors, Inc. | 0 | −100,00 | 0 | |||||
| 2025-07-30 | 13F | Onyx Bridge Wealth Group LLC | 19 449 | 2,04 | 301 | 10,70 | ||||
| 2025-08-12 | 13F | Bokf, Na | 0 | −100,00 | 0 | |||||
| 2025-07-31 | 13F | CNB Bank | 4 590 | 0,00 | 71 | 9,23 | ||||
| 2025-08-14 | 13F | GWM Advisors LLC | 67 795 | 17,23 | 1 049 | 27,18 | ||||
| 2025-07-28 | 13F | RFG Advisory, LLC | 928 828 | −5,25 | 14 369 | 2,79 | ||||
| 2025-08-05 | 13F | Pointe Capital Management LLC | 137 204 | 0,32 | 2 123 | 8,82 | ||||
| 2025-08-13 | 13F | Summit Financial, LLC | 51 079 | 790 |