Grundläggande statistik
| Institutionella ägare | 175 total, 175 long only, 0 short only, 0 long/short - change of 3,55% MRQ |
| Genomsnittlig portföljallokering | 0.0964 % - change of −9,57% MRQ |
| Institutionella aktier (lång) | 25 915 166 (ex 13D/G) - change of −0,29MM shares −1,10% MRQ |
| Institutionellt värde (lång) | $ 211 822 USD ($1000) |
Institutionellt ägande och aktieägare
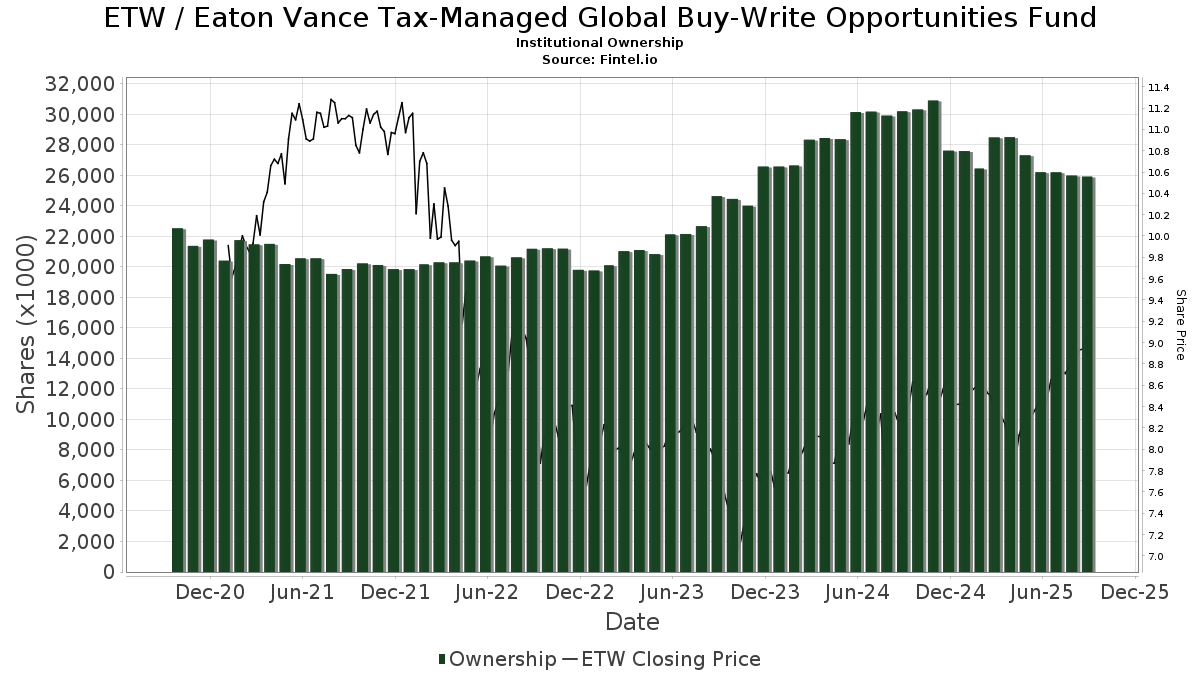
Eaton Vance Tax-Managed Global Buy-Write Opportunities Fund (US:ETW) har 175 Institutionella ägare och aktieägare som har lämnat in 13D/G- eller 13F-formulär till Securities Exchange Commission (SEC). Dessa institut innehar totalt 25,915,166 aktier. Största aktieägare inkluderar Bank Of America Corp /de/, Guggenheim Capital Llc, Morgan Stanley, Karpus Management, Inc., Invesco Ltd., Raymond James Financial Inc, PCEF - Invesco CEF Income Composite ETF, Pathstone Holdings, LLC, Royal Bank Of Canada, and Advisors Asset Management, Inc. .
Eaton Vance Tax-Managed Global Buy-Write Opportunities Fund (NYSE:ETW) Institutionell ägarstruktur visar institutioners och fonders nuvarande positioner i företaget, samt de senaste förändringarna i positionernas storlek. Större aktieägare kan vara enskilda investerare, fonder, hedgefonder eller institutioner. Bilaga 13D visar att investeraren äger (eller ägde) mer än 5% av företaget och avser (eller avsåg) att aktivt eftersträva en förändring av affärsstrategin. Schedule 13G indikerar en passiv investering på över 5%.
The share price as of September 17, 2025 is 9,02 / share. Previously, on September 18, 2024, the share price was 8,46 / share. This represents an increase of 6,62% over that period.
Fondsentimentets poäng
Fondsentimentet poängen(fka Ägarackumulation-poäng) visar vilka aktier som är mest köpta av fonder. Det är resultatet av en sofistikerad kvantitativ flerfaktormodell som identifierar företag med de högsta nivåerna av institutionell ackumulering. Poängsättningsmodellen använder en kombination av den totala ökningen av redovisade ägare, förändringarna i portföljallokeringarna för dessa ägare och andra mått. Siffran sträcker sig från 0 till 100, där högre siffror indikerar en högre nivå av ackumulering i förhållande till sina konkurrenter, och 50 är genomsnittet.
Uppdateringsfrekvens: Dagligen
Se Ownership Explorer, som innehåller en lista över de högst rankade företagen.
Institutionell sälj/köp-kvot
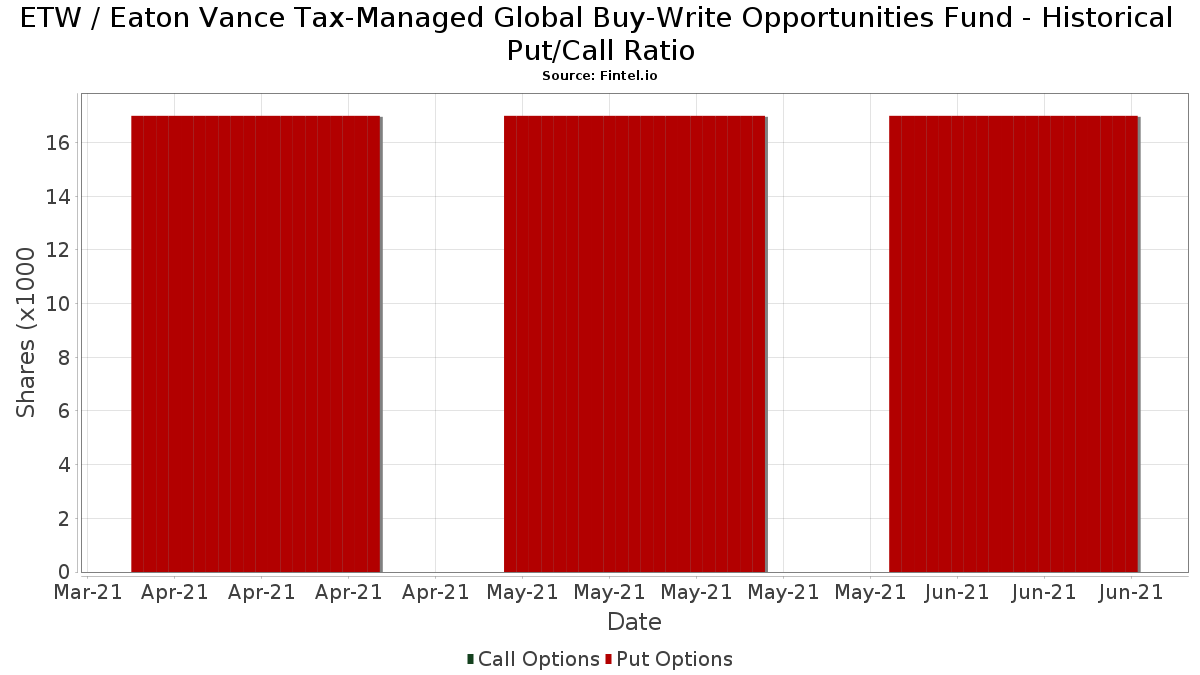
Förutom att rapportera vanliga eget kapital- och skuldemissioner måste institutioner med mer än 100MM tillgångar under förvaltning också avslöja sina innehav av sälj- och köpoptioner. Eftersom säljoptioner i allmänhet indikerar ett negativt sentiment och köpoptioner indikerar ett positivt sentiment, kan vi få en uppfattning om det övergripande institutionella sentimentet genom att plotta förhållandet mellan säljoptioner och köpoptioner. Diagrammet till höger visar det historiska förhållandet mellan sälj- och köpoptioner för detta instrument.
Genom att använda sälj/köp-kvoten som en indikator på aktieägarnas sentiment undviker man en av de största bristerna med att använda det totala institutionella ägandet, nämligen att en betydande del av de förvaltade tillgångarna investeras passivt för att följa index. Passivt förvaltade fonder köper vanligtvis inte optioner, så indikatorn för sälj/köp-kvoten ger en bättre bild av stämningen i aktivt förvaltade fonder.
13F- och NPORT-arkiveringar
Detaljer om 13F-arkiveringar är gratis. Detaljer om NP-arkiveringar kräver ett premiummedlemskap. Gröna rader indikerar nya positioner. Röda rader indikerar stängda positioner. Klicka på länk symbolen för att se hela transaktionshistoriken.
Uppgradera
för att låsa upp premiumdata och exportera till Excel ![]() .
.
| Fil Datum | Källa | Investerare | Typ | Genomsnittligt pris (beräknat) |
Aktier | Δ Aktier (%) |
Rapporterat värde (1000 USD) |
Δ Värde (%) |
Portföljallokering (%) |
|
|---|---|---|---|---|---|---|---|---|---|---|
| 2025-08-13 | 13F | Cerity Partners LLC | 19 450 | 168 | ||||||
| 2025-07-14 | 13F | Sowell Financial Services LLC | 16 742 | −5,08 | 145 | −0,69 | ||||
| 2025-07-16 | 13F | Strategic Investment Solutions, Inc. /IL | 0 | −100,00 | 0 | |||||
| 2025-08-04 | 13F | Arkadios Wealth Advisors | 98 704 | 0,04 | 854 | 4,92 | ||||
| 2025-08-19 | 13F | Cape Investment Advisory, Inc. | 400 | 0,00 | 3 | 0,00 | ||||
| 2025-07-31 | 13F | Cambridge Investment Research Advisors, Inc. | 293 571 | −12,78 | 3 | 0,00 | ||||
| 2025-08-20 | NP | ADANX - AQR Diversified Arbitrage Fund Class N | 67 758 | −47,69 | 586 | −45,13 | ||||
| 2025-08-14 | 13F | Hrt Financial Lp | 13 926 | 0 | ||||||
| 2025-08-13 | 13F/A | StoneX Group Inc. | 0 | −100,00 | 0 | −100,00 | ||||
| 2025-07-16 | 13F | Dakota Wealth Management | 51 030 | 0,00 | 441 | 5,00 | ||||
| 2025-08-13 | 13F | Colonial Trust Advisors | 6 725 | 58 | ||||||
| 2025-08-12 | 13F | Jacobi Capital Management LLC | 32 004 | 1,59 | 277 | 6,56 | ||||
| 2025-08-05 | 13F | Tsfg, Llc | 1 104 | 0 | ||||||
| 2025-08-04 | 13F | Wolverine Asset Management Llc | 73 476 | −35,03 | 636 | −31,87 | ||||
| 2025-05-13 | 13F | Hartland & Co., LLC | 0 | −100,00 | 0 | |||||
| 2025-07-23 | 13F | RiverTree Advisors, LLC | 420 140 | 122,62 | 3 634 | 133,55 | ||||
| 2025-08-12 | 13F | one8zero8, LLC | 60 400 | −22,41 | 522 | −18,69 | ||||
| 2025-08-04 | 13F | Kovack Advisors, Inc. | 53 185 | 460 | ||||||
| 2025-08-12 | 13F | Franklin Resources Inc | 261 782 | −0,06 | 2 264 | 4,77 | ||||
| 2025-07-14 | 13F | Capital CS Group, LLC | 24 282 | −3,53 | 210 | 1,45 | ||||
| 2025-08-08 | 13F | Cetera Investment Advisers | 91 281 | −12,08 | 790 | −7,83 | ||||
| 2025-05-06 | 13F | Assetmark, Inc | 0 | −100,00 | 0 | |||||
| 2025-07-29 | 13F | SAM Advisors, LLC | 0 | −100,00 | 0 | |||||
| 2025-07-25 | 13F | Sharp Financial Services, LLC | 12 250 | −58,66 | 106 | −56,97 | ||||
| 2025-08-12 | 13F | Coldstream Capital Management Inc | 0 | −100,00 | 0 | |||||
| 2025-07-29 | 13F | Stratos Wealth Advisors, LLC | 23 000 | 0,00 | 199 | 4,76 | ||||
| 2025-07-11 | 13F | Busey Wealth Management | 11 113 | 96 | ||||||
| 2025-08-11 | 13F | Alteri Wealth LLC | 58 827 | −0,04 | 509 | 4,74 | ||||
| 2025-08-12 | 13F | Proequities, Inc. | 0 | 0 | ||||||
| 2025-08-05 | 13F | Carolinas Wealth Consulting Llc | 0 | −100,00 | 0 | −100,00 | ||||
| 2025-08-29 | 13F | Centaurus Financial, Inc. | 44 725 | −1,88 | 0 | |||||
| 2025-08-06 | 13F | Wedbush Securities Inc | 0 | −100,00 | 0 | |||||
| 2025-08-14 | 13F | Cnh Partners Llc | 292 139 | −50,54 | 2 527 | −47,37 | ||||
| 2025-08-14 | 13F | Balyasny Asset Management Llc | 28 606 | 247 | ||||||
| 2025-08-13 | 13F | Guggenheim Capital Llc | 2 043 650 | 10,88 | 17 678 | 16,25 | ||||
| 2025-07-29 | 13F | Stratos Wealth Partners, LTD. | 47 767 | 158,94 | 413 | 171,71 | ||||
| 2025-08-11 | 13F | Regal Investment Advisors LLC | 17 250 | 0,00 | 149 | 4,93 | ||||
| 2025-07-18 | 13F | Cohen Klingenstein LLC | 145 960 | 0,00 | 1 263 | 4,82 | ||||
| 2025-08-04 | 13F | Noesis Capital Mangement Corp | 19 236 | 166 | ||||||
| 2025-08-05 | 13F | GPS Wealth Strategies Group, LLC | 8 493 | 0,00 | 73 | 4,29 | ||||
| 2025-08-12 | 13F | CIBC Private Wealth Group, LLC | 11 252 | 2,41 | 97 | 22,78 | ||||
| 2025-07-11 | 13F | Pinnacle Bancorp, Inc. | 3 500 | 30 | ||||||
| 2025-08-15 | 13F | Captrust Financial Advisors | 20 231 | 175 | ||||||
| 2025-07-18 | 13F | SOA Wealth Advisors, LLC. | 637 | 2,41 | 6 | 0,00 | ||||
| 2025-09-09 | 13F | NWF Advisory Services Inc. | 33 600 | 0,00 | 291 | 4,69 | ||||
| 2025-08-14 | 13F | Stifel Financial Corp | 127 228 | −14,24 | 1 101 | −10,06 | ||||
| 2025-07-25 | 13F | Allspring Global Investments Holdings, LLC | 17 284 | 0,00 | 150 | 4,93 | ||||
| 2025-07-15 | 13F | LVZ Advisors, Inc. | 15 490 | −6,32 | 134 | −2,21 | ||||
| 2025-08-14 | 13F | Citadel Advisors Llc | 11 348 | −87,82 | 98 | −87,24 | ||||
| 2025-08-11 | 13F | VSM Wealth Advisory, LLC | 11 953 | 2,79 | 103 | 8,42 | ||||
| 2025-08-13 | 13F | Cresset Asset Management, LLC | 547 092 | −0,72 | 4 732 | 4,09 | ||||
| 2025-07-15 | 13F | Mather Group, Llc. | 0 | −100,00 | 0 | |||||
| 2025-07-31 | 13F | Oppenheimer & Co Inc | 36 993 | 9,05 | 320 | 14,34 | ||||
| 2025-07-23 | 13F | Detalus Advisors, LLC | 10 375 | 0,00 | 90 | 4,71 | ||||
| 2025-08-27 | NP | RYDEX VARIABLE TRUST - Multi-Hedge Strategies Fund Variable Annuity | 369 | −20,13 | 3 | 0,00 | ||||
| 2025-05-15 | 13F | Polar Asset Management Partners Inc. | 0 | −100,00 | 0 | −100,00 | ||||
| 2025-08-08 | 13F | Avantax Advisory Services, Inc. | 35 233 | −1,63 | 305 | 3,05 | ||||
| 2025-08-06 | 13F | Decker Retirement Planning Inc. | 350 | 3 | ||||||
| 2025-07-21 | 13F | Investment Planning Advisors, Inc. | 107 111 | −11,47 | 927 | −7,21 | ||||
| 2025-08-14 | 13F | Wiley Bros.-aintree Capital, Llc | 11 439 | 99 | ||||||
| 2025-07-24 | 13F | Cyndeo Wealth Partners, LLC | 17 000 | 0,00 | 147 | 5,00 | ||||
| 2025-07-08 | 13F | Nbc Securities, Inc. | 4 269 | 0,00 | 0 | |||||
| 2025-07-11 | 13F | Farther Finance Advisors, LLC | 407 | 0,00 | 4 | 0,00 | ||||
| 2025-08-14 | 13F | Two Sigma Investments, Lp | 276 464 | 2 391 | ||||||
| 2025-07-18 | 13F | Truist Financial Corp | 24 737 | −2,75 | 214 | 1,91 | ||||
| 2025-08-05 | 13F | Summit Investment Advisory Services, LLC | 0 | −100,00 | 0 | |||||
| 2025-08-07 | 13F | Vista Investment Partners Ii, Llc | 19 607 | −0,01 | 170 | 4,97 | ||||
| 2025-07-14 | 13F | Park Avenue Securities Llc | 166 461 | −2,96 | 1 | 0,00 | ||||
| 2025-07-24 | 13F | Us Bancorp \de\ | 1 000 | 0,00 | 9 | 0,00 | ||||
| 2025-08-08 | 13F | Financial Gravity Companies, Inc. | 1 495 | 13 | ||||||
| 2025-08-11 | 13F | Elequin Capital Lp | 0 | −100,00 | 0 | |||||
| 2025-07-28 | 13F | Harbour Investments, Inc. | 15 383 | 0,17 | 133 | 5,56 | ||||
| 2025-08-14 | 13F | Hurley Capital, LLC | 2 831 | 24 | ||||||
| 2025-08-14 | 13F | Mml Investors Services, Llc | 30 070 | 3,52 | 0 | |||||
| 2025-08-19 | 13F | National Asset Management, Inc. | 46 624 | 403 | ||||||
| 2025-05-15 | 13F | Mangrove Partners | 0 | −100,00 | 0 | |||||
| 2025-07-30 | 13F | D.a. Davidson & Co. | 76 153 | 2,99 | 659 | 7,87 | ||||
| 2025-08-14 | 13F | 1607 Capital Partners, LLC | 462 934 | −16,10 | 4 004 | −12,04 | ||||
| 2025-06-27 | NP | Calamos ETF Trust - Calamos CEF Income & Arbitrage ETF | 52 174 | −11,54 | 424 | −16,37 | ||||
| 2025-08-14 | 13F | Modern Wealth Management, LLC | 18 754 | −3,00 | 162 | 1,89 | ||||
| 2025-08-13 | 13F | WCG Wealth Advisors LLC | 65 797 | 61,04 | 569 | 68,84 | ||||
| 2025-05-06 | 13F | Venturi Wealth Management, LLC | 0 | −100,00 | 0 | −100,00 | ||||
| 2025-07-23 | 13F | Abel Hall, LLC | 10 000 | 0,00 | 86 | 4,88 | ||||
| 2025-08-08 | 13F | CFO4Life Group, LLC | 13 908 | 2,41 | 120 | 7,14 | ||||
| 2025-08-13 | 13F | Jones Financial Companies Lllp | 247 | 2 | ||||||
| 2025-07-16 | 13F | Diversified Enterprises, LLC | 21 024 | 0,81 | 182 | 5,23 | ||||
| 2025-08-11 | 13F | Citigroup Inc | 35 877 | −9,86 | 310 | −5,49 | ||||
| 2025-07-11 | 13F | Annex Advisory Services, LLC | 24 004 | 0,00 | 208 | 4,55 | ||||
| 2025-08-12 | 13F | Putnam Fl Investment Management Co | 45 100 | 0,00 | 390 | 4,84 | ||||
| 2025-08-07 | 13F | Commerce Bank | 18 115 | 0,00 | 157 | 4,70 | ||||
| 2025-08-14 | 13F | Mpwm Advisory Solutions, Llc | 0 | −100,00 | 0 | |||||
| 2025-08-14 | 13F/A | Rockefeller Capital Management L.P. | 276 821 | 17,54 | 2 395 | 23,27 | ||||
| 2025-08-06 | 13F | Penserra Capital Management LLC | 590 064 | 3,04 | 5 | 25,00 | ||||
| 2025-08-19 | 13F | Asset Dedication, LLC | 0 | −100,00 | 0 | |||||
| 2025-08-12 | 13F | Global Retirement Partners, LLC | 250 | 2 | ||||||
| 2025-07-31 | 13F | Avory & Company, LLC | 45 682 | 0,00 | 395 | 5,05 | ||||
| 2025-08-14 | 13F | IHT Wealth Management, LLC | 12 210 | 17,56 | 106 | 23,53 | ||||
| 2025-08-15 | 13F | Prevail Innovative Wealth Advisors, Llc | 0 | −100,00 | 0 | |||||
| 2025-07-14 | 13F | Argentarii, LLC | 0 | −100,00 | 0 | |||||
| 2025-07-25 | 13F | Atria Wealth Solutions, Inc. | 15 112 | −32,01 | 131 | −28,96 | ||||
| 2025-08-04 | 13F | L.m. Kohn & Company | 14 642 | 0,00 | 127 | 5,00 | ||||
| 2025-08-11 | 13F | HighTower Advisors, LLC | 59 878 | −1,30 | 518 | 3,40 | ||||
| 2025-08-14 | 13F | UBS Group AG | 556 848 | −21,86 | 4 817 | −18,08 | ||||
| 2025-08-11 | 13F | Aptus Capital Advisors, LLC | 10 388 | −29,10 | 90 | −25,83 | ||||
| 2025-07-29 | 13F | International Assets Investment Management, Llc | 160 758 | 3,17 | 1 391 | 8,17 | ||||
| 2025-08-05 | 13F | Shaker Financial Services, LLC | 449 311 | 32,27 | 3 887 | 38,69 | ||||
| 2025-07-30 | 13F | Cornerstone Advisory, LLC | 19 788 | 0,46 | 171 | 5,56 | ||||
| 2025-08-14 | 13F | TCG Advisory Services, LLC | 19 275 | 0,00 | 167 | 4,40 | ||||
| 2025-07-10 | 13F | Worth Asset Management, LLC | 15 870 | 0,00 | 137 | 5,38 | ||||
| 2025-08-15 | 13F | CI Private Wealth, LLC | 13 281 | −9,81 | 115 | −5,79 | ||||
| 2025-08-08 | 13F | Kingsview Wealth Management, LLC | 12 842 | 0,00 | 111 | 5,71 | ||||
| 2025-04-28 | 13F | Bellevue Asset Management, Llc | 0 | −100,00 | 0 | |||||
| 2025-08-14 | 13F | Heritage Wealth Management, Inc. | 28 889 | 0,00 | 250 | 4,62 | ||||
| 2025-07-07 | 13F | Centurion Wealth Management LLC | 52 043 | 0,00 | 450 | 2,74 | ||||
| 2025-07-29 | 13F | Private Trust Co Na | 5 500 | 0,00 | 48 | 4,44 | ||||
| 2025-08-12 | 13F | MAI Capital Management | 8 734 | 2,42 | 76 | 7,14 | ||||
| 2025-07-22 | 13F | DAVENPORT & Co LLC | 15 020 | 0,00 | 130 | 4,88 | ||||
| 2025-08-01 | 13F | Winebrenner Capital Management Llc | 80 000 | 0,00 | 692 | 4,85 | ||||
| 2025-05-14 | 13F | Keeley-Teton Advisors, LLC | 30 963 | 0,00 | 255 | −1,92 | ||||
| 2025-08-14 | 13F | Atomi Financial Group, Inc. | 53 492 | 0,00 | 463 | 4,76 | ||||
| 2025-08-12 | 13F | Pathstone Holdings, LLC | 1 192 502 | 11,37 | 10 253 | 14,11 | ||||
| 2025-07-25 | 13F | Integrated Capital Management, Inc. | 35 399 | 4,38 | 306 | 9,68 | ||||
| 2025-08-14 | 13F | Guardian Wealth Advisors, Llc / Nc | 10 388 | −29,10 | 90 | −25,83 | ||||
| 2025-08-14 | 13F | Comerica Bank | 18 971 | 2,71 | 164 | 7,89 | ||||
| 2025-08-04 | 13F | Flagship Harbor Advisors, Llc | 0 | −100,00 | 0 | |||||
| 2025-07-08 | 13F | Parallel Advisors, LLC | 1 091 | −39,79 | 9 | −35,71 | ||||
| 2025-08-14 | 13F | Mariner, LLC | 27 603 | 13,12 | 239 | 18,41 | ||||
| 2025-08-12 | 13F | Change Path, LLC | 46 483 | −12,24 | 402 | −7,80 | ||||
| 2025-04-22 | 13F | Synergy Financial Management, LLC | 0 | −100,00 | 0 | |||||
| 2025-08-05 | 13F | Sensible Money, LLC | 0 | −100,00 | 0 | |||||
| 2025-08-12 | 13F | Jpmorgan Chase & Co | 220 | 0,00 | 2 | 0,00 | ||||
| 2025-08-14 | 13F | Quantedge Capital Pte Ltd | 11 900 | 103 | ||||||
| 2025-08-11 | 13F | Private Advisor Group, LLC | 115 132 | 0,19 | 996 | 4,96 | ||||
| 2025-08-01 | 13F | Twin Lakes Capital Management, LLC | 37 443 | 2,41 | 324 | 7,31 | ||||
| 2025-05-07 | 13F | Sheaff Brock Investment Advisors, LLC | 59 453 | 0,04 | 490 | −2,00 | ||||
| 2025-08-06 | 13F | Commonwealth Equity Services, Llc | 83 101 | 5,59 | 1 | |||||
| 2025-08-14 | 13F | Wells Fargo & Company/mn | 309 629 | −5,50 | 2 678 | −0,92 | ||||
| 2025-08-15 | 13F | Kestra Advisory Services, LLC | 126 427 | 119,07 | 1 094 | 129,62 | ||||
| 2025-08-13 | 13F | Summit Financial, LLC | 27 301 | 236 | ||||||
| 2025-07-21 | 13F | Barrett & Company, Inc. | 2 250 | 0,00 | 19 | 5,56 | ||||
| 2025-05-15 | 13F | Advisory Services Network, LLC | 0 | −100,00 | 0 | |||||
| 2025-08-01 | 13F | Envestnet Asset Management Inc | 219 025 | −1,76 | 1 895 | 2,99 | ||||
| 2025-08-13 | 13F | Walleye Capital LLC | 0 | −100,00 | 0 | |||||
| 2025-08-14 | 13F | Karpus Management, Inc. | 1 695 491 | −1,88 | 14 666 | 2,88 | ||||
| 2025-07-21 | 13F | Ameriflex Group, Inc. | 0 | −100,00 | 0 | |||||
| 2025-08-06 | 13F | Golden State Wealth Management, LLC | 0 | −100,00 | 0 | |||||
| 2025-07-01 | 13F | Harbor Investment Advisory, Llc | 1 925 | 0,00 | 17 | 6,67 | ||||
| 2025-07-28 | NP | PCEF - Invesco CEF Income Composite ETF This fund is a listed as child fund of Invesco Ltd. and if that institution has disclosed ownership in this security, then these positions will not be double counted when calculating total shares and total value | 1 541 000 | −0,14 | 12 960 | −0,96 | ||||
| 2025-05-12 | 13F | Fmr Llc | 0 | −100,00 | 0 | |||||
| 2025-08-27 | NP | RYMSX - Guggenheim Multi-Hedge Strategies Fund Class P | 219 | −38,14 | 2 | −50,00 | ||||
| 2025-04-21 | 13F | ORG Partners LLC | 0 | −100,00 | 0 | |||||
| 2025-07-17 | 13F | Vermillion Wealth Management, Inc. | 2 747 | 0,00 | 24 | 4,55 | ||||
| 2025-08-11 | 13F | Advisor Resource Council | 0 | −100,00 | 0 | |||||
| 2025-08-13 | 13F | Invesco Ltd. | 1 568 468 | −1,12 | 13 567 | 3,68 | ||||
| 2025-08-11 | 13F | Blue Bell Private Wealth Management, Llc | 15 587 | 27,90 | 135 | 34,00 | ||||
| 2025-08-15 | 13F | Morgan Stanley | 1 835 258 | 1,70 | 15 875 | 6,63 | ||||
| 2025-04-30 | 13F | Sofos Investments, Inc. | 1 495 | 12 | ||||||
| 2025-08-04 | 13F | Joseph P. Lucia & Associates, LLC | 62 420 | 1,14 | 540 | 5,89 | ||||
| 2025-08-08 | 13F | Creative Planning | 35 307 | 2,17 | 307 | 7,72 | ||||
| 2025-07-24 | 13F | Bernard Wealth Management Corp. | 205 | 0,00 | 2 | 0,00 | ||||
| 2025-08-14 | 13F | Royal Bank Of Canada | 882 723 | 1,44 | 7 636 | 6,37 | ||||
| 2025-07-11 | 13F | Quad-Cities Investment Group, LLC | 11 072 | 2,23 | 96 | 6,74 | ||||
| 2025-08-14 | 13F | Jane Street Group, Llc | 51 164 | 288,78 | 443 | 309,26 | ||||
| 2025-08-15 | 13F | Tower Research Capital LLC (TRC) | 608 | 8 585,71 | 5 | |||||
| 2025-08-14 | 13F | Certified Advisory Corp | 32 568 | −0,91 | 282 | 3,69 | ||||
| 2025-05-12 | 13F | Independent Advisor Alliance | 0 | −100,00 | 0 | |||||
| 2025-07-31 | 13F | West Michigan Advisors, Llc | 12 865 | 0,00 | 111 | 4,72 | ||||
| 2025-08-13 | 13F | Gamco Investors, Inc. Et Al | 30 963 | 268 | ||||||
| 2025-08-12 | 13F | Advisors Asset Management, Inc. | 669 868 | 10,81 | 5 794 | 16,18 | ||||
| 2025-08-14 | 13F | Ameriprise Financial Inc | 464 182 | 41,20 | 4 016 | 48,08 | ||||
| 2025-07-21 | 13F | Ashton Thomas Securities, Llc | 10 467 | 0,00 | 91 | 4,65 | ||||
| 2025-08-13 | 13F | Northwestern Mutual Wealth Management Co | 32 316 | −17,65 | 280 | −13,62 | ||||
| 2025-07-10 | 13F | Wealth Enhancement Advisory Services, Llc | 84 729 | 14,92 | 737 | 21,22 | ||||
| 2025-05-14 | 13F | Landscape Capital Management, L.l.c. | 0 | −100,00 | 0 | |||||
| 2025-07-31 | 13F | Buckingham Strategic Partners | 32 194 | 278 | ||||||
| 2025-08-12 | 13F | Steward Partners Investment Advisory, Llc | 49 664 | −30,21 | 430 | −26,92 | ||||
| 2025-07-29 | 13F | Ballast, Inc. | 62 420 | 540 | ||||||
| 2025-07-30 | 13F | Roman Butler Fullerton & Co | 196 762 | −0,72 | 1 724 | 10,52 | ||||
| 2025-08-28 | NP | YYY - Amplify High Income ETF | 584 054 | 1,99 | 5 052 | 6,94 | ||||
| 2025-07-28 | 13F | Sagespring Wealth Partners, Llc | 0 | −100,00 | 0 | |||||
| 2025-08-07 | 13F | Allworth Financial LP | 60 419 | 6 259,89 | 523 | 7 357,14 | ||||
| 2025-08-08 | 13F | Pnc Financial Services Group, Inc. | 57 585 | −27,72 | 498 | −24,20 | ||||
| 2025-08-14 | 13F | CoreCap Advisors, LLC | 1 150 | −46,51 | 10 | −47,06 | ||||
| 2025-09-04 | 13F/A | Advisor Group Holdings, Inc. | 389 308 | 62,43 | 3 368 | 70,31 | ||||
| 2025-08-11 | 13F | Rothschild Investment Llc | 27 831 | −0,22 | 241 | 4,35 | ||||
| 2025-07-17 | 13F | Saxon Interests, Inc. | 38 116 | 0,00 | 314 | 0,00 | ||||
| 2025-08-05 | 13F | Strategic Financial Concepts, LLC | 10 300 | −9,27 | 89 | −4,30 | ||||
| 2025-07-17 | 13F | Janney Montgomery Scott LLC | 28 050 | −3,44 | 0 | |||||
| 2025-08-12 | 13F | LPL Financial LLC | 524 999 | 25,85 | 4 541 | 31,97 | ||||
| 2025-08-05 | 13F | Claro Advisors LLC | 39 953 | −37,26 | 346 | −34,29 | ||||
| 2025-07-11 | 13F | Kapstone Financial Advisors LLC | 0 | −100,00 | 0 | |||||
| 2025-07-21 | 13F | Ameritas Advisory Services, LLC | 9 489 | 82 | ||||||
| 2025-08-14 | 13F | Logan Stone Capital, LLC | 37 132 | −73,16 | 321 | −71,87 | ||||
| 2025-07-17 | 13F | Youngs Advisory Group, Inc. | 55 380 | −18,50 | 480 | −14,44 | ||||
| 2025-07-17 | 13F | Camelot Portfolios, LLC | 45 400 | 0,00 | 393 | 4,81 | ||||
| 2025-08-07 | 13F | Parkside Financial Bank & Trust | 4 500 | 39 | ||||||
| 2025-08-14 | 13F | Raymond James Financial Inc | 1 544 773 | 1,66 | 13 362 | 6,59 | ||||
| 2025-08-26 | NP | MCTOX - Modern Capital Tactical Opportunities Fund Class A Shares | 59 407 | 8,41 | 514 | 13,50 | ||||
| 2025-07-09 | 13F | David J Yvars Group | 23 635 | 204 | ||||||
| 2025-07-23 | 13F | Tyche Wealth Partners LLC | 11 464 | 0,00 | 99 | 5,32 | ||||
| 2025-08-06 | 13F | Financial Alternatives, Inc | 15 091 | 0,00 | 131 | 4,84 | ||||
| 2025-08-14 | 13F | Bank Of America Corp /de/ | 2 288 653 | 3,62 | 19 797 | 8,64 | ||||
| 2025-08-07 | 13F | Kestra Private Wealth Services, Llc | 27 544 | 33,51 | 238 | 40,00 | ||||
| 2025-08-07 | 13F | Readystate Asset Management Lp | 167 796 | 20,91 | 1 451 | 26,84 | ||||
| 2025-08-13 | 13F | Lido Advisors, LLC | 74 900 | 0,00 | 648 | 4,86 | ||||
| 2025-08-14 | 13F | Integrated Wealth Concepts LLC | 11 322 | 0,04 | 98 | 4,30 | ||||
| 2025-08-14 | 13F | GWM Advisors LLC | 67 845 | 0,04 | 587 | 4,83 | ||||
| 2025-07-21 | 13F | Franklin Street Advisors Inc /nc | 150 334 | 0,00 | 1 | 0,00 | ||||
| 2025-08-08 | 13F | Calamos Advisors LLC | 52 174 | −8,00 | 451 | −3,43 |