Grundläggande statistik
| Institutionella ägare | 143 total, 143 long only, 0 short only, 0 long/short - change of 8,96% MRQ |
| Genomsnittlig portföljallokering | 0.2414 % - change of −15,74% MRQ |
| Institutionella aktier (lång) | 6 734 511 (ex 13D/G) - change of 0,68MM shares 11,18% MRQ |
| Institutionellt värde (lång) | $ 260 910 USD ($1000) |
Institutionellt ägande och aktieägare
SPDR Index Shares Funds - SPDR S&P International Dividend ETF (US:DWX) har 143 Institutionella ägare och aktieägare som har lämnat in 13D/G- eller 13F-formulär till Securities Exchange Commission (SEC). Dessa institut innehar totalt 6,734,511 aktier. Största aktieägare inkluderar Morgan Stanley, Bank Of America Corp /de/, Wells Fargo & Company/mn, UBS Group AG, Columbia River Financial Group, LLC, INKM - SPDR SSGA Income Allocation ETF, Concord Wealth Partners, Concord Asset Management, LLC/VA, Empirical Financial Services, LLC d.b.a. Empirical Wealth Management, and Baker Avenue Asset Management, LP .
SPDR Index Shares Funds - SPDR S&P International Dividend ETF (ARCA:DWX) Institutionell ägarstruktur visar institutioners och fonders nuvarande positioner i företaget, samt de senaste förändringarna i positionernas storlek. Större aktieägare kan vara enskilda investerare, fonder, hedgefonder eller institutioner. Bilaga 13D visar att investeraren äger (eller ägde) mer än 5% av företaget och avser (eller avsåg) att aktivt eftersträva en förändring av affärsstrategin. Schedule 13G indikerar en passiv investering på över 5%.
The share price as of September 17, 2025 is 43,64 / share. Previously, on September 18, 2024, the share price was 38,85 / share. This represents an increase of 12,33% over that period.

Fondsentimentets poäng
Fondsentimentet poängen(fka Ägarackumulation-poäng) visar vilka aktier som är mest köpta av fonder. Det är resultatet av en sofistikerad kvantitativ flerfaktormodell som identifierar företag med de högsta nivåerna av institutionell ackumulering. Poängsättningsmodellen använder en kombination av den totala ökningen av redovisade ägare, förändringarna i portföljallokeringarna för dessa ägare och andra mått. Siffran sträcker sig från 0 till 100, där högre siffror indikerar en högre nivå av ackumulering i förhållande till sina konkurrenter, och 50 är genomsnittet.
Uppdateringsfrekvens: Dagligen
Se Ownership Explorer, som innehåller en lista över de högst rankade företagen.
Institutionell sälj/köp-kvot
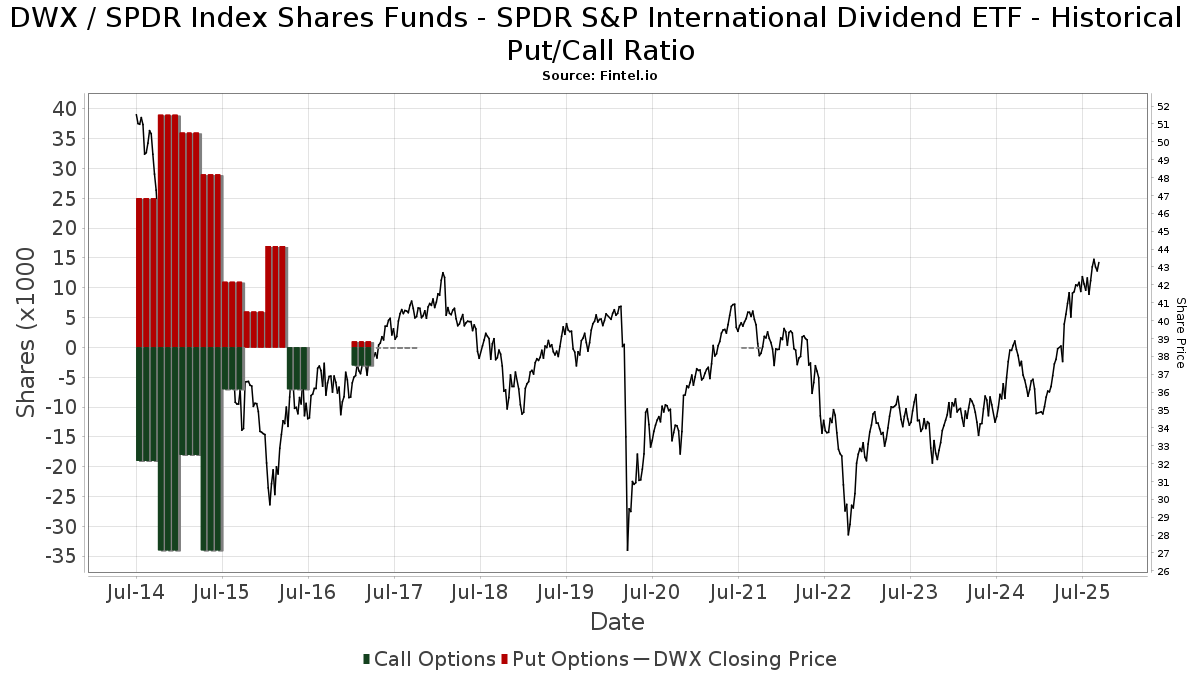
Förutom att rapportera vanliga eget kapital- och skuldemissioner måste institutioner med mer än 100MM tillgångar under förvaltning också avslöja sina innehav av sälj- och köpoptioner. Eftersom säljoptioner i allmänhet indikerar ett negativt sentiment och köpoptioner indikerar ett positivt sentiment, kan vi få en uppfattning om det övergripande institutionella sentimentet genom att plotta förhållandet mellan säljoptioner och köpoptioner. Diagrammet till höger visar det historiska förhållandet mellan sälj- och köpoptioner för detta instrument.
Genom att använda sälj/köp-kvoten som en indikator på aktieägarnas sentiment undviker man en av de största bristerna med att använda det totala institutionella ägandet, nämligen att en betydande del av de förvaltade tillgångarna investeras passivt för att följa index. Passivt förvaltade fonder köper vanligtvis inte optioner, så indikatorn för sälj/köp-kvoten ger en bättre bild av stämningen i aktivt förvaltade fonder.
13F- och NPORT-arkiveringar
Detaljer om 13F-arkiveringar är gratis. Detaljer om NP-arkiveringar kräver ett premiummedlemskap. Gröna rader indikerar nya positioner. Röda rader indikerar stängda positioner. Klicka på länk symbolen för att se hela transaktionshistoriken.
Uppgradera
för att låsa upp premiumdata och exportera till Excel ![]() .
.
| Fil Datum | Källa | Investerare | Typ | Genomsnittligt pris (beräknat) |
Aktier | Δ Aktier (%) |
Rapporterat värde (1000 USD) |
Δ Värde (%) |
Portföljallokering (%) |
|
|---|---|---|---|---|---|---|---|---|---|---|
| 2025-08-14 | 13F | Financial Network Wealth Advisors LLC | 217 | 9 | ||||||
| 2025-07-14 | 13F | Southland Equity Partners LLC | 7 825 | −0,37 | 330 | 9,30 | ||||
| 2025-08-14 | 13F | Royal Bank Of Canada | 95 948 | −9,48 | 4 044 | −0,52 | ||||
| 2025-08-04 | 13F | HBK Sorce Advisory LLC | 18 122 | −9,86 | 764 | −1,04 | ||||
| 2025-05-30 | NP | GPMIX - GuidePath(R) Multi-Asset Income Allocation Fund Service Shares | 43 680 | 5,40 | 1 676 | 15,68 | ||||
| 2025-07-24 | 13F | Brandywine Oak Private Wealth Llc | 23 210 | 0,00 | 978 | 9,89 | ||||
| 2025-07-21 | 13F | Crews Bank & Trust | 2 735 | 0,00 | 115 | 10,58 | ||||
| 2025-07-28 | 13F | Axxcess Wealth Management, Llc | 10 850 | 20,56 | 457 | 32,46 | ||||
| 2025-08-12 | 13F | Founders Financial Alliance, LLC | 161 | 0,00 | 7 | 0,00 | ||||
| 2025-08-14 | 13F | Kovitz Investment Group Partners, LLC | 9 193 | 387 | ||||||
| 2025-08-14 | 13F | Citadel Advisors Llc | 7 060 | 298 | ||||||
| 2025-08-13 | 13F | Northwestern Mutual Wealth Management Co | 70 437 | 0,22 | 2 969 | 10,09 | ||||
| 2025-08-06 | 13F | Founders Financial Securities Llc | 0 | −100,00 | 0 | |||||
| 2025-08-11 | 13F | Citigroup Inc | 10 697 | −0,25 | 451 | 9,49 | ||||
| 2025-08-14 | 13F | Integrated Wealth Concepts LLC | 9 563 | 0,48 | 403 | 10,41 | ||||
| 2025-08-15 | 13F | Tower Research Capital LLC (TRC) | 8 | 60,00 | 0 | |||||
| 2025-07-01 | 13F | Harbor Investment Advisory, Llc | 830 | 0,00 | 35 | 9,68 | ||||
| 2025-07-24 | 13F | Us Bancorp \de\ | 349 | −35,37 | 15 | −30,00 | ||||
| 2025-08-19 | 13F | Asset Dedication, LLC | 555 | 0,00 | 23 | 9,52 | ||||
| 2025-07-28 | 13F | Harbour Investments, Inc. | 65 | 0,00 | 3 | 0,00 | ||||
| 2025-08-14 | 13F | Glen Eagle Advisors, LLC | 717 | −12,13 | 30 | −3,23 | ||||
| 2025-08-18 | 13F | Geneos Wealth Management Inc. | 1 406 | 2,33 | 59 | 13,46 | ||||
| 2025-08-12 | 13F | NFP Retirement, Inc. | 5 105 | 215 | ||||||
| 2025-08-01 | 13F | Winebrenner Capital Management Llc | 20 535 | 0,00 | 866 | 9,91 | ||||
| 2025-05-15 | 13F | Putnam Fl Investment Management Co | 0 | −100,00 | 0 | |||||
| 2025-07-18 | 13F | Truist Financial Corp | 23 159 | −3,07 | 976 | 6,55 | ||||
| 2025-08-08 | 13F | Emerald Investment Partners, Llc | 47 790 | −3,12 | 2 014 | 6,45 | ||||
| 2025-08-19 | 13F | Newbridge Financial Services Group, Inc. | 18 618 | 785 | ||||||
| 2025-07-14 | 13F | Legacy Capital Group California, Inc. | 5 390 | 227 | ||||||
| 2025-08-14 | 13F | Raymond James Financial Inc | 43 156 | −3,78 | 1 819 | 5,76 | ||||
| 2025-08-19 | 13F | National Asset Management, Inc. | 5 090 | 215 | ||||||
| 2025-07-17 | 13F | Janney Montgomery Scott LLC | 14 626 | 0,43 | 1 | |||||
| 2025-07-25 | 13F | Cwm, Llc | 697 | 0,00 | 0 | |||||
| 2025-08-14 | 13F | Stifel Financial Corp | 119 307 | −1,11 | 5 029 | 8,67 | ||||
| 2025-08-12 | 13F | Steward Partners Investment Advisory, Llc | 116 | 0,00 | 5 | 0,00 | ||||
| 2025-07-17 | 13F | Peoples Financial Services Corp. | 800 | 0,00 | 34 | 10,00 | ||||
| 2025-05-01 | 13F | Country Club Bank /gfn | 0 | −100,00 | 0 | |||||
| 2025-07-29 | 13F | Stratos Wealth Partners, LTD. | 0 | −100,00 | 0 | |||||
| 2025-08-11 | 13F | Blue Bell Private Wealth Management, Llc | 0 | 0 | ||||||
| 2025-08-14 | 13F | Mml Investors Services, Llc | 72 606 | 33,64 | 3 | 50,00 | ||||
| 2025-08-18 | 13F/A | National Bank Of Canada /fi/ | 3 750 | −1,83 | 158 | 8,22 | ||||
| 2025-08-14 | 13F | Fmr Llc | 2 724 | 8,70 | 115 | 18,75 | ||||
| 2025-08-01 | 13F | Austin Private Wealth, LLC | 5 977 | 3,05 | 252 | 13,06 | ||||
| 2025-08-11 | 13F | Beta Wealth Group, Inc. | 5 927 | 0,56 | 250 | 10,18 | ||||
| 2025-08-14 | 13F | Synovus Financial Corp | 6 255 | −3,08 | 264 | 6,48 | ||||
| 2025-07-24 | 13F | IFP Advisors, Inc | 882 | 1,61 | 37 | 12,12 | ||||
| 2025-08-14 | 13F | Sequent Planning LLC | 5 988 | 252 | ||||||
| 2025-07-15 | 13F | Bay Capital Advisors, LLC | 0 | −100,00 | 0 | |||||
| 2025-08-04 | 13F | Assetmark, Inc | 6 121 | −96,93 | 258 | −96,62 | ||||
| 2025-08-14 | 13F | UBS Group AG | 388 488 | 6,29 | 16 375 | 16,80 | ||||
| 2025-07-09 | 13F | Hardin Capital Partners, LLC | 4 866 | 207 | ||||||
| 2025-08-08 | 13F | Arcadia Investment Management Corp/mi | 1 400 | 0,00 | 59 | 11,32 | ||||
| 2025-08-12 | 13F | Wayfinding Financial, LLC | 0 | −100,00 | 0 | |||||
| 2025-07-30 | 13F | Rehmann Capital Advisory Group | 7 560 | 0,00 | 319 | 9,66 | ||||
| 2025-07-22 | 13F | Red Tortoise LLC | 47 508 | 2 002 | ||||||
| 2025-08-07 | 13F | Parkside Financial Bank & Trust | 278 | 1,46 | 12 | 10,00 | ||||
| 2025-08-14 | 13F | Mercer Global Advisors Inc /adv | 68 568 | −12,28 | 2 890 | −3,60 | ||||
| 2025-07-22 | 13F | Brown Miller Wealth Management, LLC | 10 850 | 457 | ||||||
| 2025-08-14 | 13F | CoreCap Advisors, LLC | 0 | −100,00 | 0 | |||||
| 2025-08-08 | 13F | Atlantic Trust, LLC | 3 000 | 0,00 | 126 | 9,57 | ||||
| 2025-07-18 | 13F | Benchmark Wealth Management, LLC | 6 211 | 0,00 | 262 | 9,66 | ||||
| 2025-08-04 | 13F | Balentine LLC | 10 107 | −0,41 | 426 | 9,51 | ||||
| 2025-08-14 | 13F | Financial Advisory Service, Inc. | 735 | 1,52 | 31 | 11,11 | ||||
| 2025-07-09 | 13F | Breakwater Investment Management | 170 | 0,00 | 7 | 16,67 | ||||
| 2025-04-24 | 13F | Decker Retirement Planning Inc. | 0 | 0 | ||||||
| 2025-07-08 | 13F | Nbc Securities, Inc. | 50 | 0,00 | 0 | |||||
| 2025-08-12 | 13F | Jpmorgan Chase & Co | 14 197 | −6,60 | 598 | 2,57 | ||||
| 2025-05-14 | 13F | Note Advisors, LLC | 0 | −100,00 | 0 | |||||
| 2025-07-25 | 13F | Concord Wealth Partners | 228 260 | 31,74 | 9 621 | 44,76 | ||||
| 2025-08-05 | 13F | Huntington National Bank | 0 | |||||||
| 2025-08-13 | 13F | Invesco Ltd. | 35 963 | −8,23 | 1 516 | 0,80 | ||||
| 2025-08-14 | 13F | Wiley Bros.-aintree Capital, Llc | 11 667 | 492 | ||||||
| 2025-08-14 | 13F | Harwood Advisory Group, LLC | 0 | −100,00 | 0 | |||||
| 2025-08-12 | 13F | Park Square Financial Group, LLC | 0 | −100,00 | 0 | |||||
| 2025-08-11 | 13F | Principal Securities, Inc. | 420 | 0,00 | 18 | 21,43 | ||||
| 2025-08-13 | 13F | Continuum Advisory, LLC | 0 | −100,00 | 0 | |||||
| 2025-08-05 | 13F | Counterweight Ventures, LLC | 6 675 | 0,00 | 281 | 9,77 | ||||
| 2025-08-11 | 13F | HighTower Advisors, LLC | 13 050 | 3,39 | 550 | 13,64 | ||||
| 2025-08-14 | 13F | Jane Street Group, Llc | 57 762 | 2 435 | ||||||
| 2025-08-14 | 13F | Qube Research & Technologies Ltd | 178 | 0,00 | 8 | 16,67 | ||||
| 2025-08-05 | 13F | Westside Investment Management, Inc. | 140 | 0,00 | 6 | 0,00 | ||||
| 2025-07-25 | 13F | Concord Asset Management, LLC/VA | 228 260 | 28,45 | 9 621 | 34,18 | ||||
| 2025-05-14 | 13F | Flow Traders U.s. Llc | 0 | −100,00 | 0 | |||||
| 2025-07-02 | 13F | HBW Advisory Services LLC | 0 | −100,00 | 0 | |||||
| 2025-07-29 | 13F | Beverly Hills Private Wealth, LLC | 11 389 | −2,10 | 480 | 7,62 | ||||
| 2025-07-22 | 13F | Partners Wealth Management, Llc | 21 601 | 0,00 | 832 | 0,36 | ||||
| 2025-08-13 | 13F | Stablepoint Partners, LLC | 7 342 | −1,44 | 309 | 8,42 | ||||
| 2025-08-14 | 13F | Sunbelt Securities, Inc. | 600 | 0,00 | 21 | −13,04 | ||||
| 2025-08-14 | 13F | Susquehanna International Group, Llp | 37 848 | 21,48 | 1 595 | 33,47 | ||||
| 2025-08-13 | 13F | Milestone Investment Advisors LLC | 1 249 | 0,00 | 53 | 10,64 | ||||
| 2025-08-08 | 13F | Avantax Advisory Services, Inc. | 13 253 | 1,75 | 559 | 11,82 | ||||
| 2025-08-07 | 13F | Allworth Financial LP | 525 | 0,00 | 22 | 4,76 | ||||
| 2025-08-14 | 13F | Wells Fargo & Company/mn | 636 241 | 111,18 | 26 818 | 132,06 | ||||
| 2025-08-11 | 13F | Dorsey Wright & Associates | 66 718 | 2 812 | ||||||
| 2025-08-14 | 13F | Gen-Wealth Partners Inc | 260 | 0,00 | 11 | 11,11 | ||||
| 2025-08-15 | 13F | Morgan Stanley | 852 932 | −4,15 | 35 951 | 5,33 | ||||
| 2025-07-31 | 13F | Glass Jacobson Investment Advisors llc | 0 | −100,00 | 0 | −100,00 | ||||
| 2025-08-11 | 13F | Private Advisor Group, LLC | 36 345 | 4,48 | 1 532 | 14,77 | ||||
| 2025-05-28 | NP | INKM - SPDR SSGA Income Allocation ETF This fund is a listed as child fund of State Street Corp and if that institution has disclosed ownership in this security, then these positions will not be double counted when calculating total shares and total value | 249 042 | 704,89 | 9 553 | 783,72 | ||||
| 2025-08-14 | 13F | Bank Of America Corp /de/ | 711 358 | −3,24 | 29 984 | 6,32 | ||||
| 2025-07-21 | 13F | Empirical Financial Services, LLC d.b.a. Empirical Wealth Management | 214 955 | −3,93 | 9 060 | 5,57 | ||||
| 2025-07-25 | 13F | NorthRock Partners, LLC | 41 | 0,00 | 2 | 0,00 | ||||
| 2025-08-07 | 13F | CENTRAL TRUST Co | 700 | −17,65 | 30 | −9,37 | ||||
| 2025-09-04 | 13F/A | Advisor Group Holdings, Inc. | 98 002 | 73,58 | 4 066 | 87,59 | ||||
| 2025-04-23 | 13F | Golden State Wealth Management, LLC | 0 | −100,00 | 0 | |||||
| 2025-08-14 | 13F | GWM Advisors LLC | 1 400 | 59 | ||||||
| 2025-07-08 | 13F | Heartwood Wealth Advisors LLC | 24 906 | 0,00 | 1 050 | 9,84 | ||||
| 2025-08-15 | 13F | Captrust Financial Advisors | 4 775 | 201 | ||||||
| 2025-08-12 | 13F | Wood Tarver Financial Group, LLC | 5 381 | −2,23 | 0 | −100,00 | ||||
| 2025-08-08 | 13F | Pnc Financial Services Group, Inc. | 2 133 | −5,28 | 90 | 3,49 | ||||
| 2025-08-12 | 13F | Global Retirement Partners, LLC | 5 200 | 0,00 | 219 | 20,99 | ||||
| 2025-04-24 | 13F | Mascoma Wealth Management LLC | 0 | −100,00 | 0 | |||||
| 2025-07-24 | 13F | Eastern Bank | 359 | 0,00 | 15 | 15,38 | ||||
| 2025-08-14 | 13F | Colony Group, LLC | 161 743 | 6 817 | ||||||
| 2025-08-15 | 13F | Equitable Holdings, Inc. | 38 266 | 1 613 | ||||||
| 2025-08-06 | 13F | Savant Capital, LLC | 6 437 | 2,63 | 271 | 12,92 | ||||
| 2025-08-06 | 13F | Columbia River Financial Group, LLC | 269 476 | −10,93 | 11 | 0,00 | ||||
| 2025-08-08 | 13F | Cetera Investment Advisers | 91 850 | 16,21 | 3 871 | 27,71 | ||||
| 2025-07-31 | 13F | Hanlon Investment Management, Inc. | 12 095 | 510 | ||||||
| 2025-08-11 | 13F | Mount Lucas Management LP | 61 944 | −12,66 | 2 611 | −4,04 | ||||
| 2025-07-15 | 13F | McAdam, LLC | 28 303 | −1,78 | 1 193 | 7,87 | ||||
| 2025-08-12 | 13F | LPL Financial LLC | 187 453 | 8,93 | 7 901 | 19,69 | ||||
| 2025-08-12 | 13F | Allen Capital Group, LLC | 143 129 | −2,36 | 6 033 | 7,27 | ||||
| 2025-07-22 | 13F | Wealthcare Advisory Partners LLC | 6 250 | 2,19 | 263 | 12,39 | ||||
| 2025-05-06 | 13F | AE Wealth Management LLC | 0 | −100,00 | 0 | |||||
| 2025-08-12 | 13F | MAI Capital Management | 5 900 | 0,00 | 249 | 9,73 | ||||
| 2025-05-05 | 13F | Conservest Capital Advisors, Inc. | 0 | −100,00 | 0 | |||||
| 2025-08-13 | 13F | Mount Yale Investment Advisors, LLC | 30 576 | −0,26 | 1 289 | 9,62 | ||||
| 2025-07-11 | 13F | Farther Finance Advisors, LLC | 50 | 2 | ||||||
| 2025-08-06 | 13F | Commonwealth Equity Services, Llc | 53 579 | −4,76 | 2 | 0,00 | ||||
| 2025-08-14 | 13F | Moneta Group Investment Advisors Llc | 9 764 | −6,82 | 412 | 2,49 | ||||
| 2025-08-12 | 13F | Proequities, Inc. | 0 | 0 | ||||||
| 2025-04-15 | 13F | Transform Wealth, LLC | 9 193 | 0,00 | 353 | 9,66 | ||||
| 2025-07-08 | 13F | Parallel Advisors, LLC | 32 834 | 0,31 | 1 384 | 10,20 | ||||
| 2025-07-29 | 13F | Creekside Partners | 6 641 | 0,33 | 280 | 10,28 | ||||
| 2025-07-18 | 13F | PFG Investments, LLC | 10 825 | 1,41 | 456 | 11,49 | ||||
| 2025-08-13 | 13F | Colonial Trust Co / SC | 756 | −12,70 | 32 | −6,06 | ||||
| 2025-08-13 | 13F | Gibbs Wealth Management | 5 742 | 242 | ||||||
| 2025-08-14 | 13F | Atomi Financial Group, Inc. | 18 918 | 797 | ||||||
| 2025-09-03 | 13F | Q3 Asset Management | 0 | −100,00 | 0 | |||||
| 2025-07-30 | 13F | Eqis Capital Management, Inc. | 19 077 | −3,16 | 804 | 6,49 | ||||
| 2025-08-14 | 13F | Mariner, LLC | 8 722 | −32,70 | 368 | −26,16 | ||||
| 2025-04-23 | 13F | Creative Financial Designs Inc /adv | 0 | −100,00 | 0 | −100,00 | ||||
| 2025-07-21 | 13F | Barrett & Company, Inc. | 47 | 0,00 | 2 | 0,00 | ||||
| 2025-08-11 | 13F | Novak & Powell Financial Services, Inc. | 19 422 | 1,45 | 819 | 11,44 | ||||
| 2025-08-08 | 13F | Cornerstone Advisors Asset Management, Inc | 4 966 | 209 | ||||||
| 2025-08-05 | 13F | NewSquare Capital LLC | 1 | 0,00 | 0 | |||||
| 2025-08-13 | 13F | Jones Financial Companies Lllp | 32 524 | −0,61 | 1 367 | 8,41 | ||||
| 2025-07-11 | 13F/A | Umb Bank N A/mo | 250 | 0,00 | 11 | 11,11 | ||||
| 2025-07-24 | 13F | Blair William & Co/il | 200 | 8 | ||||||
| 2025-07-17 | 13F | Fifth Third Securities, Inc. | 11 344 | 17,14 | 478 | 28,84 | ||||
| 2025-07-30 | 13F | D.a. Davidson & Co. | 13 383 | 0,00 | 564 | 9,94 | ||||
| 2025-07-31 | 13F | Cambridge Investment Research Advisors, Inc. | 48 403 | 194,92 | 2 | |||||
| 2025-08-14 | 13F | Comerica Bank | 7 925 | 2,59 | 334 | 12,84 | ||||
| 2025-08-13 | 13F | Capital Analysts, Inc. | 12 506 | 0,16 | 1 | |||||
| 2025-07-03 | 13F | Arvest Investments, Inc. | 3 790 | −8,87 | 160 | 0,00 | ||||
| 2025-08-08 | 13F | Capital Investment Advisory Services, LLC | 258 | 0,00 | 11 | 11,11 | ||||
| 2025-08-08 | 13F | Larson Financial Group LLC | 2 989 | 1,56 | 126 | 11,61 | ||||
| 2025-08-07 | 13F | FDx Advisors, Inc. | 34 982 | −1,83 | 1 | 0,00 | ||||
| 2025-08-28 | NP | SYMIX - AlphaCentric Symmetry Strategy Fund Class I | 8 836 | −14,94 | 372 | −6,53 | ||||
| 2025-05-14 | 13F | Oarsman Capital, Inc. | 0 | −100,00 | 0 | |||||
| 2025-08-14 | 13F/A | Barclays Plc | 300 | 0,00 | 0 | |||||
| 2025-08-15 | 13F | Kestra Advisory Services, LLC | 11 213 | −3,15 | 473 | 6,31 | ||||
| 2025-07-29 | 13F | Curbstone Financial Management Corp | 11 028 | 0,00 | 465 | 9,69 | ||||
| 2025-08-05 | 13F | Key FInancial Inc | 24 440 | −0,49 | 1 030 | 9,34 | ||||
| 2025-07-29 | 13F | Dumont & Blake Investment Advisors Llc | 22 507 | −1,47 | 949 | 8,22 | ||||
| 2025-04-23 | 13F | Bessemer Group Inc | 0 | −100,00 | 0 | |||||
| 2025-08-01 | 13F | Envestnet Asset Management Inc | 154 065 | 45,32 | 6 494 | 59,69 | ||||
| 2025-08-13 | 13F | Baker Avenue Asset Management, LP | 210 444 | 161,19 | 8 870 | 187,06 |