Grundläggande statistik
| Institutionella ägare | 138 total, 138 long only, 0 short only, 0 long/short - change of 12,70% MRQ |
| Genomsnittlig portföljallokering | 0.1690 % - change of 95,47% MRQ |
| Institutionella aktier (lång) | 2 584 422 (ex 13D/G) - change of 0,01MM shares 0,23% MRQ |
| Institutionellt värde (lång) | $ 266 879 USD ($1000) |
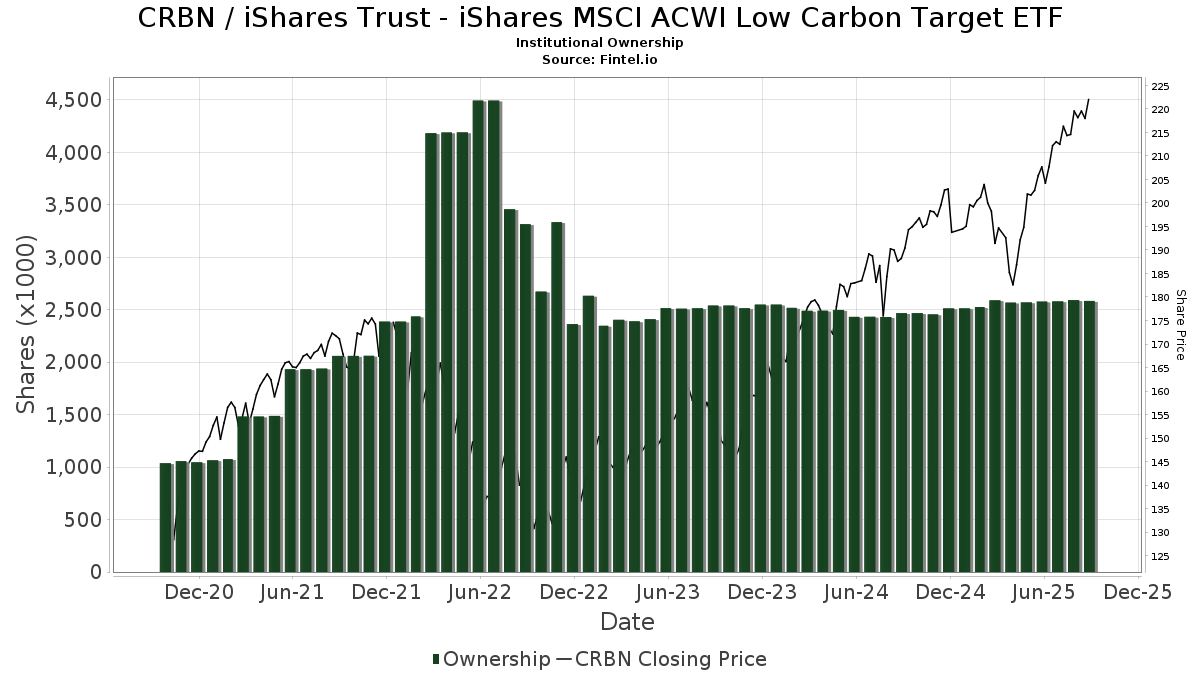
Institutionellt ägande och aktieägare
iShares Trust - iShares MSCI ACWI Low Carbon Target ETF (US:CRBN) har 138 Institutionella ägare och aktieägare som har lämnat in 13D/G- eller 13F-formulär till Securities Exchange Commission (SEC). Dessa institut innehar totalt 2,584,422 aktier. Största aktieägare inkluderar Betterment LLC, Morgan Stanley, Aspiriant, Llc, Bank Of America Corp /de/, Investure, LLC, Allianz Se, Jpmorgan Chase & Co, UBS Group AG, Wells Fargo & Company/mn, and Susquehanna International Group, Llp .
iShares Trust - iShares MSCI ACWI Low Carbon Target ETF (ARCA:CRBN) Institutionell ägarstruktur visar institutioners och fonders nuvarande positioner i företaget, samt de senaste förändringarna i positionernas storlek. Större aktieägare kan vara enskilda investerare, fonder, hedgefonder eller institutioner. Bilaga 13D visar att investeraren äger (eller ägde) mer än 5% av företaget och avser (eller avsåg) att aktivt eftersträva en förändring av affärsstrategin. Schedule 13G indikerar en passiv investering på över 5%.
The share price as of September 12, 2025 is 223,81 / share. Previously, on September 16, 2024, the share price was 191,17 / share. This represents an increase of 17,07% over that period.
Fondsentimentets poäng
Fondsentimentet poängen(fka Ägarackumulation-poäng) visar vilka aktier som är mest köpta av fonder. Det är resultatet av en sofistikerad kvantitativ flerfaktormodell som identifierar företag med de högsta nivåerna av institutionell ackumulering. Poängsättningsmodellen använder en kombination av den totala ökningen av redovisade ägare, förändringarna i portföljallokeringarna för dessa ägare och andra mått. Siffran sträcker sig från 0 till 100, där högre siffror indikerar en högre nivå av ackumulering i förhållande till sina konkurrenter, och 50 är genomsnittet.
Uppdateringsfrekvens: Dagligen
Se Ownership Explorer, som innehåller en lista över de högst rankade företagen.
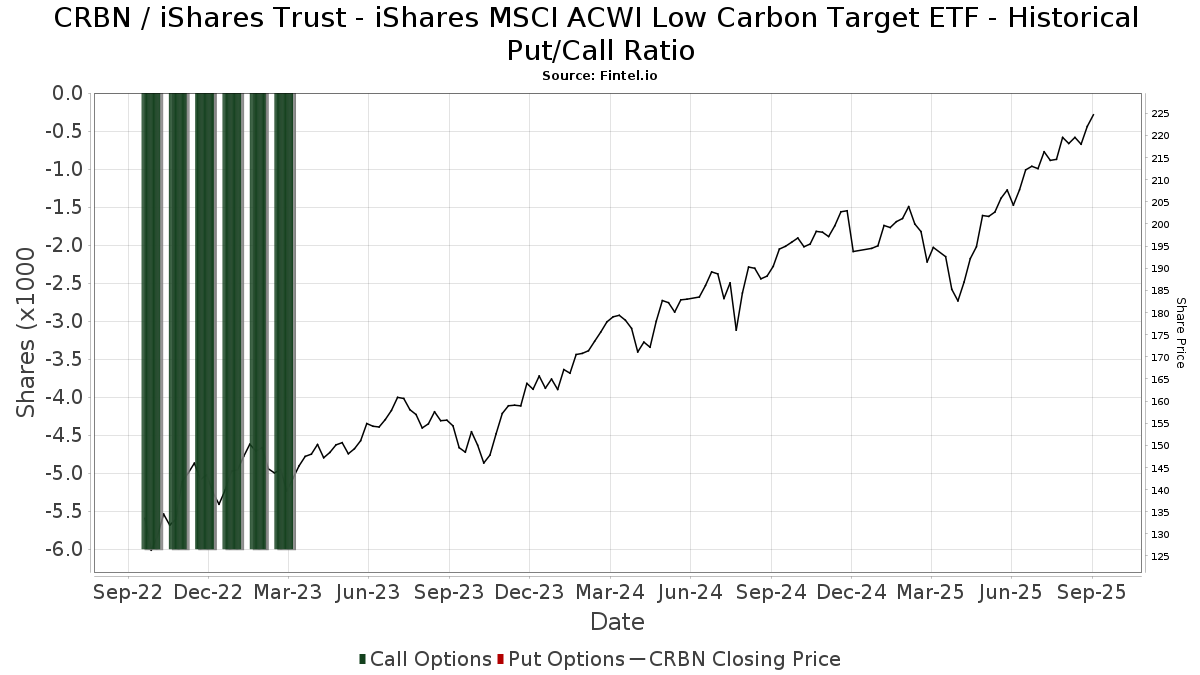
Institutionell sälj/köp-kvot
Förutom att rapportera vanliga eget kapital- och skuldemissioner måste institutioner med mer än 100MM tillgångar under förvaltning också avslöja sina innehav av sälj- och köpoptioner. Eftersom säljoptioner i allmänhet indikerar ett negativt sentiment och köpoptioner indikerar ett positivt sentiment, kan vi få en uppfattning om det övergripande institutionella sentimentet genom att plotta förhållandet mellan säljoptioner och köpoptioner. Diagrammet till höger visar det historiska förhållandet mellan sälj- och köpoptioner för detta instrument.
Genom att använda sälj/köp-kvoten som en indikator på aktieägarnas sentiment undviker man en av de största bristerna med att använda det totala institutionella ägandet, nämligen att en betydande del av de förvaltade tillgångarna investeras passivt för att följa index. Passivt förvaltade fonder köper vanligtvis inte optioner, så indikatorn för sälj/köp-kvoten ger en bättre bild av stämningen i aktivt förvaltade fonder.
13F- och NPORT-arkiveringar
Detaljer om 13F-arkiveringar är gratis. Detaljer om NP-arkiveringar kräver ett premiummedlemskap. Gröna rader indikerar nya positioner. Röda rader indikerar stängda positioner. Klicka på länk symbolen för att se hela transaktionshistoriken.
Uppgradera
för att låsa upp premiumdata och exportera till Excel ![]() .
.
| Fil Datum | Källa | Investerare | Typ | Genomsnittligt pris (beräknat) |
Aktier | Δ Aktier (%) |
Rapporterat värde (1000 USD) |
Δ Värde (%) |
Portföljallokering (%) |
|
|---|---|---|---|---|---|---|---|---|---|---|
| 2025-07-15 | 13F | Td Private Client Wealth Llc | 2 405 | 1,56 | 509 | 12,61 | ||||
| 2025-07-18 | 13F | BSW Wealth Partners | 27 991 | 12,52 | 5 929 | 24,66 | ||||
| 2025-08-06 | 13F | Modera Wealth Management, LLC | 1 466 | 311 | ||||||
| 2025-08-13 | 13F | Van Hulzen Asset Management, LLC | 8 916 | −9,55 | 1 889 | 0,21 | ||||
| 2025-07-21 | 13F | Ameritas Advisory Services, LLC | 958 | −19,63 | 203 | −11,01 | ||||
| 2025-07-25 | 13F | Community Bank, N.A. | 17 | 0,00 | 4 | 0,00 | ||||
| 2025-08-05 | 13F | GPS Wealth Strategies Group, LLC | 425 | −7,41 | 90 | 2,30 | ||||
| 2025-05-05 | 13F | Eagle Bay Advisors LLC | 0 | −100,00 | 0 | |||||
| 2025-04-28 | 13F | Equita Financial Network, Inc. | 0 | −100,00 | 0 | |||||
| 2025-07-22 | 13F | Miracle Mile Advisors, LLC | 7 009 | 121,94 | 1 485 | 146,10 | ||||
| 2025-07-28 | 13F | Ritholtz Wealth Management | 3 734 | −18,63 | 791 | −9,81 | ||||
| 2025-04-29 | 13F | Truist Financial Corp | 0 | −100,00 | 0 | |||||
| 2025-08-14 | 13F | Comerica Bank | 929 | 10,07 | 197 | 21,74 | ||||
| 2025-08-18 | 13F | Geneos Wealth Management Inc. | 2 245 | 1 154,19 | 475 | 1 297,06 | ||||
| 2025-07-14 | 13F | AdvisorNet Financial, Inc | 694 | 5,15 | 147 | 15,87 | ||||
| 2025-07-28 | 13F | BRYN MAWR TRUST Co | 225 | 48 | ||||||
| 2025-08-14 | 13F | Smartleaf Asset Management LLC | 2 689 | −56,30 | 566 | −51,87 | ||||
| 2025-07-22 | 13F | Dougherty Wealth Advisers LLC | 696 | 92,80 | 147 | 113,04 | ||||
| 2025-07-09 | 13F | Westmount Partners, LLC | 3 891 | 0,96 | 824 | 11,96 | ||||
| 2025-07-17 | 13F | Wolff Wiese Magana Llc | 6 | 1 | ||||||
| 2025-07-22 | 13F | Relyea Zuckerberg Hanson LLC | 1 938 | 0,36 | 411 | 11,11 | ||||
| 2025-08-11 | 13F | HighTower Advisors, LLC | 5 070 | −7,63 | 1 074 | 2,29 | ||||
| 2025-08-14 | 13F | Royal Bank Of Canada | 12 585 | 3,35 | 2 666 | 14,57 | ||||
| 2025-07-08 | 13F | Nbc Securities, Inc. | 262 | 0,00 | 0 | |||||
| 2025-07-11 | 13F | Farther Finance Advisors, LLC | 1 683 | −5,82 | 356 | 4,09 | ||||
| 2025-07-02 | 13F | Howard Financial Services, Ltd. | 1 043 | 221 | ||||||
| 2025-07-25 | 13F | Ackerman Capital Advisors, LLC | 2 849 | 603 | ||||||
| 2025-08-13 | 13F | North Berkeley Wealth Management, LLC | 4 157 | 37,10 | 881 | 51,99 | ||||
| 2025-05-14 | 13F | Monterey Private Wealth, Inc. | 2 491 | 0,00 | 476 | −1,24 | ||||
| 2025-07-31 | 13F | Brighton Jones Llc | 2 296 | 0,83 | 486 | 11,72 | ||||
| 2025-08-12 | 13F | Proequities, Inc. | 0 | 0 | ||||||
| 2025-08-12 | 13F | BlackRock, Inc. | 12 761 | −4,02 | 2 703 | 6,38 | ||||
| 2025-08-14 | 13F | UBS Group AG | 40 934 | −2,26 | 8 671 | 8,29 | ||||
| 2025-06-24 | NP | NSTLX - Neuberger Berman Strategic Income Fund Institutional Class | 961 | −4,00 | ||||||
| 2025-07-01 | 13F | Stonehearth Capital Management, LLC | 15 205 | 17,02 | 3 221 | 29,63 | ||||
| 2025-07-25 | 13F | PrairieView Partners, LLC | 581 | 0,00 | 0 | |||||
| 2025-07-30 | 13F | Crewe Advisors LLC | 29 | 0,00 | 6 | 20,00 | ||||
| 2025-08-11 | 13F | United Capital Financial Advisers, Llc | 1 485 | 0,34 | 315 | 11,35 | ||||
| 2025-07-07 | 13F | Investors Research Corp | 362 | 0,00 | 77 | 10,14 | ||||
| 2025-07-29 | 13F | Harbor Asset Planning, Inc. | 100 | 21 | ||||||
| 2025-08-06 | 13F | Longview Financial Advisors LLC | 238 | 0,00 | 50 | 11,11 | ||||
| 2025-07-08 | 13F | Gradient Investments LLC | 7 639 | −17,97 | 1 618 | −9,10 | ||||
| 2025-08-12 | 13F | Investure, LLC | 102 661 | 0,82 | 21 746 | 11,71 | ||||
| 2025-08-13 | 13F | Northwestern Mutual Wealth Management Co | 2 484 | 0,93 | 526 | 11,91 | ||||
| 2025-08-15 | 13F | Kestra Advisory Services, LLC | 1 032 | 2,48 | 219 | 13,54 | ||||
| 2025-07-14 | 13F | UMA Financial Services, Inc. | 159 | −6,47 | 34 | 3,13 | ||||
| 2025-07-24 | 13F | IFP Advisors, Inc | 14 | −41,67 | 3 | −50,00 | ||||
| 2025-07-22 | 13F | Mascoma Wealth Management LLC | 10 | 0,00 | 2 | 100,00 | ||||
| 2025-08-08 | 13F | Pnc Financial Services Group, Inc. | 308 | 0,65 | 65 | 12,07 | ||||
| 2025-08-13 | 13F/A | StoneX Group Inc. | 0 | −100,00 | 0 | −100,00 | ||||
| 2025-08-06 | 13F | Commonwealth Equity Services, Llc | 3 283 | −25,27 | 1 | |||||
| 2025-08-12 | 13F | SRS Capital Advisors, Inc. | 15 148 | 3 209 | ||||||
| 2025-08-06 | 13F | First Horizon Advisors, Inc. | 0 | −100,00 | 0 | |||||
| 2025-08-13 | 13F | Baird Financial Group, Inc. | 2 553 | 0,00 | 541 | 10,66 | ||||
| 2025-08-14 | 13F | Mml Investors Services, Llc | 2 406 | 1,26 | 1 | |||||
| 2025-08-29 | NP | CFRAX - Catalyst/CIFC Floating Rate Income Fund Class A | 497 | 0,81 | ||||||
| 2025-07-08 | 13F | Morris Retirement Advisors, LLC | 1 022 | 216 | ||||||
| 2025-07-24 | 13F | Financial Connections Group, Inc. | 440 | 0 | ||||||
| 2025-08-14 | 13F | Jane Street Group, Llc | 15 818 | 114,71 | 3 351 | 137,93 | ||||
| 2025-08-14 | 13F | Wiley Bros.-aintree Capital, Llc | 1 001 | −14,08 | 212 | −4,50 | ||||
| 2025-08-12 | 13F | CIBC Private Wealth Group, LLC | 41 | 0,00 | 9 | 33,33 | ||||
| 2025-07-11 | 13F | Bond & Devick Financial Network, Inc. | 5 380 | 2,16 | 1 140 | 13,22 | ||||
| 2025-09-04 | 13F/A | Advisor Group Holdings, Inc. | 6 005 | 17,17 | 1 272 | 29,83 | ||||
| 2025-07-25 | 13F | Atria Wealth Solutions, Inc. | 0 | −100,00 | 0 | |||||
| 2025-08-08 | 13F | Allianz Se | 99 015 | −3,88 | 20 973 | 6,49 | ||||
| 2025-08-14 | 13F | Mercer Global Advisors Inc /adv | 9 300 | −3,49 | 1 970 | 6,89 | ||||
| 2025-08-05 | 13F | Westside Investment Management, Inc. | 300 | 0,00 | 64 | 10,53 | ||||
| 2025-08-13 | 13F | KilterHowling LLC | 1 289 | 0,86 | 273 | 9,20 | ||||
| 2025-08-14 | 13F | Colony Group, LLC | 6 006 | 23,10 | 1 272 | 36,48 | ||||
| 2025-08-13 | 13F | Twin Peaks Wealth Advisors, LLC | 265 | 58 | ||||||
| 2025-08-18 | 13F | Front Row Advisors LLC | 45 | 0,00 | 10 | 12,50 | ||||
| 2025-07-31 | 13F | AlTi Global, Inc. | 18 304 | −3,58 | 3 877 | 6,83 | ||||
| 2025-08-14 | 13F | Raymond James Financial Inc | 4 290 | 24,78 | 909 | 38,20 | ||||
| 2025-08-14 | 13F | California State Teachers Retirement System | 523 | 0,00 | 111 | 11,11 | ||||
| 2025-07-23 | 13F | Dohj, Llc | 3 870 | −1,25 | 723 | −3,47 | ||||
| 2025-08-01 | 13F | Transcend Wealth Collective, Llc | 1 627 | 3,63 | 345 | 14,67 | ||||
| 2025-08-06 | 13F | Golden State Wealth Management, LLC | 1 694 | −2,31 | 359 | 8,16 | ||||
| 2025-08-12 | 13F | Steward Partners Investment Advisory, Llc | 5 163 | 0,00 | 1 094 | 10,74 | ||||
| 2025-07-29 | 13F | Financial Futures Ltd Liability Co. | 1 127 | 239 | ||||||
| 2025-08-14 | 13F | Goldman Sachs Group Inc | 12 101 | −2,02 | 2 563 | 8,56 | ||||
| 2025-08-08 | 13F | Cetera Investment Advisers | 5 072 | −79,50 | 1 074 | −77,29 | ||||
| 2025-08-08 | 13F | Larson Financial Group LLC | 113 | 0,89 | 24 | 9,52 | ||||
| 2025-08-12 | 13F | LPL Financial LLC | 15 498 | 3,42 | 3 283 | 14,59 | ||||
| 2025-07-29 | 13F | Kraft, Davis & Associates, LLC | 974 | 210 | ||||||
| 2025-08-14 | 13F | Susquehanna International Group, Llp | 35 971 | 65,35 | 7 619 | 83,19 | ||||
| 2025-07-29 | 13F | Mattson Financial Services, LLC | 0 | −100,00 | 0 | |||||
| 2025-08-13 | 13F | Flow Traders U.s. Llc | 16 372 | −35,74 | 3 | −25,00 | ||||
| 2025-07-23 | 13F | Proffitt & Goodson Inc | 389 | −9,95 | 82 | 0,00 | ||||
| 2025-08-12 | 13F | Coldstream Capital Management Inc | 18 251 | −0,30 | 3 866 | 10,46 | ||||
| 2025-08-12 | 13F | Jpmorgan Chase & Co | 70 585 | −0,47 | 14 951 | 10,27 | ||||
| 2025-07-31 | 13F | Wealthfront Advisers Llc | 13 182 | 2,29 | 2 792 | 13,36 | ||||
| 2025-08-13 | 13F | Ally Invest Advisors Inc. | 3 419 | −14,29 | 724 | −4,99 | ||||
| 2025-07-22 | 13F | Belpointe Asset Management LLC | 1 832 | 7,64 | 388 | 19,38 | ||||
| 2025-08-05 | 13F | Huntington National Bank | 0 | |||||||
| 2025-08-13 | 13F | Cerity Partners LLC | 1 072 | 0,85 | 227 | 11,82 | ||||
| 2025-05-07 | 13F | Nottingham Advisors, Inc. | 0 | −100,00 | 0 | |||||
| 2025-08-14 | 13F | Wells Fargo & Company/mn | 37 265 | 111,36 | 7 893 | 134,21 | ||||
| 2025-07-18 | 13F | Bartlett & Co. Wealth Management Llc | 440 | 0,00 | 93 | 10,71 | ||||
| 2025-08-12 | 13F | Choate Investment Advisors | 735 | 156 | ||||||
| 2025-07-22 | 13F | 4Thought Financial Group Inc. | 57 | 90,00 | 12 | 140,00 | ||||
| 2025-07-24 | 13F | Us Bancorp \de\ | 960 | 0,00 | 203 | 10,93 | ||||
| 2025-08-14 | 13F | Glenmede Investment Management, LP | 1 440 | 305 | ||||||
| 2025-08-06 | 13F | Long Run Wealth Advisors, LLC | 4 775 | −4,71 | 1 011 | 5,53 | ||||
| 2025-07-29 | 13F | Aspiriant, Llc | 113 526 | 0,29 | 24 047 | 11,12 | ||||
| 2025-07-25 | 13F | Cwm, Llc | 297 | 0,00 | 0 | |||||
| 2025-07-30 | 13F | Patten Group, Inc. | 2 076 | −2,76 | 440 | 7,60 | ||||
| 2025-08-14 | 13F | Betterment LLC | 1 285 649 | −0,94 | 272 | 9,68 | ||||
| 2025-05-15 | 13F | Glenmede Trust Co Na | 1 440 | −75,06 | 275 | −75,38 | ||||
| 2025-08-05 | 13F | Bank Of Montreal /can/ | 617 | 0,00 | 131 | 11,11 | ||||
| 2025-08-14 | 13F | Bnp Paribas Arbitrage, Sa | 0 | −100,00 | 0 | |||||
| 2025-07-17 | 13F | Halbert Hargrove Global Advisors, Llc | 1 542 | −0,77 | 327 | 9,76 | ||||
| 2025-08-14 | 13F | Widmann Financial Services, Inc. | 1 110 | 235 | ||||||
| 2025-08-14 | 13F | Ameriprise Financial Inc | 25 142 | 1,22 | 5 326 | 12,15 | ||||
| 2025-08-14 | 13F | Camden Capital, LLC | 2 107 | 0,81 | 446 | 11,78 | ||||
| 2025-08-08 | 13F | Creative Planning | 8 471 | 1,29 | 1 794 | 12,27 | ||||
| 2025-08-05 | 13F | Plante Moran Financial Advisors, LLC | 65 | 14 | ||||||
| 2025-07-31 | 13F | University of Maryland Foundation, Inc. | 10 000 | 0,00 | 2 | 100,00 | ||||
| 2025-07-25 | 13F | Concord Wealth Partners | 400 | 85 | ||||||
| 2025-07-31 | 13F | Cambridge Investment Research Advisors, Inc. | 5 158 | 7,41 | 1 | |||||
| 2025-08-14 | 13F | Federation des caisses Desjardins du Quebec | 60 | 0,00 | 13 | 9,09 | ||||
| 2025-07-22 | 13F | Merit Financial Group, LLC | 1 330 | −2,85 | 282 | 7,66 | ||||
| 2025-08-14 | 13F | Evergreen Capital Management Llc | 3 566 | 0,00 | 755 | 10,87 | ||||
| 2025-08-12 | 13F | Prudential Plc | 1 700 | 0,00 | 360 | 10,77 | ||||
| 2025-08-14 | 13F | Citadel Advisors Llc | 4 789 | −74,19 | 1 014 | −71,41 | ||||
| 2025-07-15 | 13F | Retirement Income Solutions, Inc | 1 038 | −13,43 | 220 | −25,51 | ||||
| 2025-07-24 | 13F | Bernard Wealth Management Corp. | 7 | −41,67 | 1 | −50,00 | ||||
| 2025-08-05 | 13F | Dunhill Financial, LLC | 15 | 0,00 | 3 | 50,00 | ||||
| 2025-08-29 | NP | Barings Global Short Duration High Yield Fund | 748 | 4,48 | ||||||
| 2025-08-04 | 13F | Assetmark, Inc | 5 | 0,00 | 1 | |||||
| 2025-08-14 | 13F | EP Wealth Advisors, Inc. | 1 374 | 70,68 | 291 | 90,20 | ||||
| 2025-08-11 | 13F | Plum Street Advisors, LLC | 4 984 | −2,83 | 1 056 | 7,65 | ||||
| 2025-07-17 | 13F | Albion Financial Group /ut | 7 870 | 0,58 | 1 667 | 11,51 | ||||
| 2025-07-30 | 13F | Whittier Trust Co Of Nevada Inc | 391 | 0,00 | 83 | 10,81 | ||||
| 2025-08-15 | 13F | Morgan Stanley | 201 932 | 2,81 | 42 773 | 13,91 | ||||
| 2025-08-14 | 13F | Bank Of America Corp /de/ | 109 812 | −13,31 | 23 260 | −3,94 | ||||
| 2025-08-01 | 13F | Rossby Financial, LCC | 18 | 0,00 | 4 | 0,00 | ||||
| 2025-07-28 | 13F | Harbour Investments, Inc. | 25 | 8,70 | 5 | 25,00 | ||||
| 2025-07-18 | 13F | TruNorth Capital Management, LLC | 1 300 | 0,00 | 275 | 10,89 | ||||
| 2025-08-05 | 13F | Simplex Trading, Llc | 6 | 0 | ||||||
| 2025-08-12 | 13F | Global Retirement Partners, LLC | 2 | 0 | ||||||
| 2025-04-09 | 13F | Roxbury Financial LLC | 0 | −100,00 | 0 | |||||
| 2025-04-23 | 13F | Financial Life Planners | 0 | −100,00 | 0 | |||||
| 2025-08-13 | 13F | Northern Trust Corp | 4 995 | −1,21 | 1 058 | 9,52 | ||||
| 2025-08-05 | 13F | Gould Asset Management Llc /ca/ | 9 785 | −1,76 | 2 073 | 8,82 | ||||
| 2025-08-14 | 13F/A | Barclays Plc | 152 | 0,00 | 0 | |||||
| 2025-05-09 | 13F | Wharton Business Group, LLC | 0 | −100,00 | 0 | |||||
| 2025-07-31 | 13F | Cardinal Point Capital Management, ULC | 6 905 | −1,71 | 1 463 | 8,86 | ||||
| 2025-08-13 | 13F | Jones Financial Companies Lllp | 5 448 | 26,08 | 1 146 | 38,91 | ||||
| 2025-07-16 | 13F/A | CX Institutional | 49 | 0,00 | 0 | |||||
| 2025-08-07 | 13F | Parkside Financial Bank & Trust | 760 | 0,00 | 161 | 10,34 | ||||
| 2025-08-01 | 13F | Envestnet Asset Management Inc | 20 223 | 0,05 | 4 284 | 10,84 | ||||
| 2025-08-14 | 13F | Fmr Llc | 3 735 | −10,82 | 791 | −1,12 | ||||
| 2025-04-18 | 13F | Wolf Group Capital Advisors | 0 | −100,00 | 0 | −100,00 | ||||
| 2025-08-08 | 13F | Hartland & Co., LLC | 1 971 | −16,45 | 417 | −7,33 | ||||
| 2025-05-08 | 13F | Wrapmanager Inc | 0 | −100,00 | 0 | |||||
| 2025-04-29 | 13F | Raleigh Capital Management Inc. | 0 | −100,00 | 0 | |||||
| 2025-08-12 | 13F | MAI Capital Management | 84 | 55,56 | 18 | 70,00 | ||||
| 2025-08-14 | 13F | Kovitz Investment Group Partners, LLC | 1 401 | −2,37 | 297 | 8,03 |
Other Listings
| CL:CRBNCL |