Grundläggande statistik
| Institutionella ägare | 100 total, 100 long only, 0 short only, 0 long/short - change of 19,05% MRQ |
| Genomsnittlig portföljallokering | 0.5466 % - change of −18,64% MRQ |
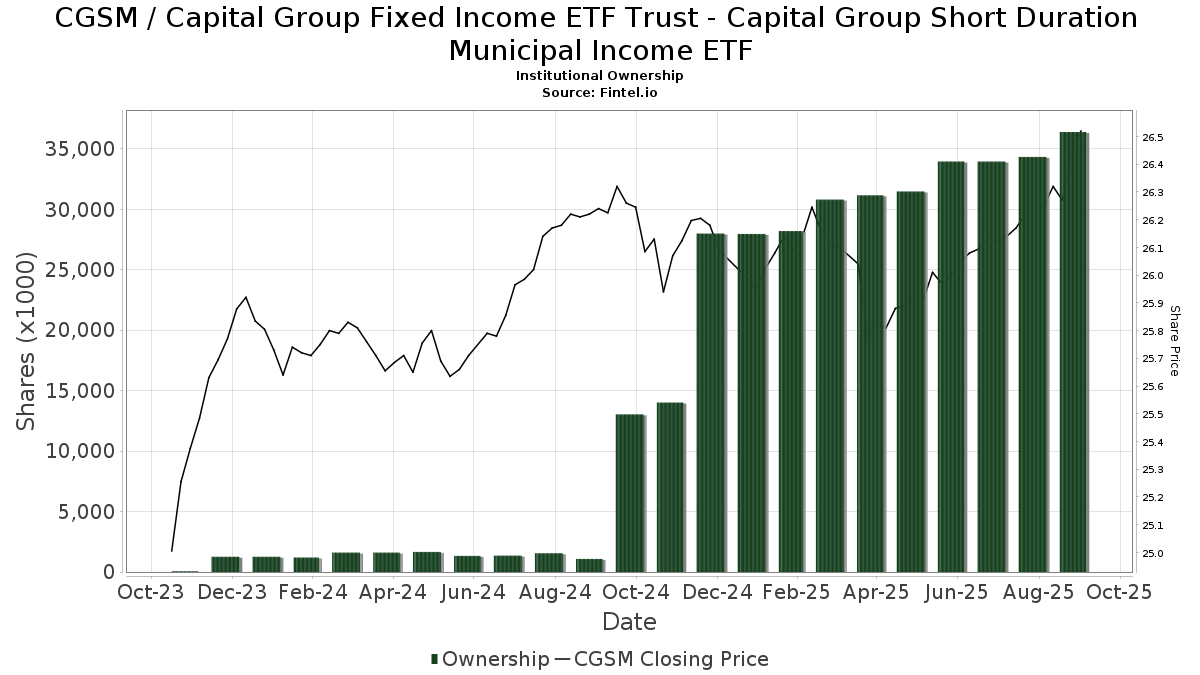
| Institutionella aktier (lång) | 36 387 654 (ex 13D/G) - change of 2,44MM shares 7,18% MRQ |
| Institutionellt värde (lång) | $ 916 916 USD ($1000) |
Institutionellt ägande och aktieägare
Capital Group Fixed Income ETF Trust - Capital Group Short Duration Municipal Income ETF (US:CGSM) har 100 Institutionella ägare och aktieägare som har lämnat in 13D/G- eller 13F-formulär till Securities Exchange Commission (SEC). Dessa institut innehar totalt 36,387,654 aktier. Största aktieägare inkluderar Capital International Investors, TAIAX - American Funds Tax-Aware Conservative Growth and Income Portfolio Class A, TEPAX - American Funds Tax-Exempt Preservation Portfolio Class A, Morgan Stanley, Envestnet Asset Management Inc, LPL Financial LLC, Captrust Financial Advisors, PUREfi Wealth, LLC, Cetera Investment Advisers, and Vestmark Advisory Solutions, Inc. .
Capital Group Fixed Income ETF Trust - Capital Group Short Duration Municipal Income ETF (ARCA:CGSM) Institutionell ägarstruktur visar institutioners och fonders nuvarande positioner i företaget, samt de senaste förändringarna i positionernas storlek. Större aktieägare kan vara enskilda investerare, fonder, hedgefonder eller institutioner. Bilaga 13D visar att investeraren äger (eller ägde) mer än 5% av företaget och avser (eller avsåg) att aktivt eftersträva en förändring av affärsstrategin. Schedule 13G indikerar en passiv investering på över 5%.
The share price as of September 18, 2025 is 26,49 / share. Previously, on September 19, 2024, the share price was 26,25 / share. This represents an increase of 0,91% over that period.
Fondsentimentets poäng
Fondsentimentet poängen(fka Ägarackumulation-poäng) visar vilka aktier som är mest köpta av fonder. Det är resultatet av en sofistikerad kvantitativ flerfaktormodell som identifierar företag med de högsta nivåerna av institutionell ackumulering. Poängsättningsmodellen använder en kombination av den totala ökningen av redovisade ägare, förändringarna i portföljallokeringarna för dessa ägare och andra mått. Siffran sträcker sig från 0 till 100, där högre siffror indikerar en högre nivå av ackumulering i förhållande till sina konkurrenter, och 50 är genomsnittet.
Uppdateringsfrekvens: Dagligen
Se Ownership Explorer, som innehåller en lista över de högst rankade företagen.
Institutionell sälj/köp-kvot
Förutom att rapportera vanliga eget kapital- och skuldemissioner måste institutioner med mer än 100MM tillgångar under förvaltning också avslöja sina innehav av sälj- och köpoptioner. Eftersom säljoptioner i allmänhet indikerar ett negativt sentiment och köpoptioner indikerar ett positivt sentiment, kan vi få en uppfattning om det övergripande institutionella sentimentet genom att plotta förhållandet mellan säljoptioner och köpoptioner. Diagrammet till höger visar det historiska förhållandet mellan sälj- och köpoptioner för detta instrument.
Genom att använda sälj/köp-kvoten som en indikator på aktieägarnas sentiment undviker man en av de största bristerna med att använda det totala institutionella ägandet, nämligen att en betydande del av de förvaltade tillgångarna investeras passivt för att följa index. Passivt förvaltade fonder köper vanligtvis inte optioner, så indikatorn för sälj/köp-kvoten ger en bättre bild av stämningen i aktivt förvaltade fonder.
13F- och NPORT-arkiveringar
Detaljer om 13F-arkiveringar är gratis. Detaljer om NP-arkiveringar kräver ett premiummedlemskap. Gröna rader indikerar nya positioner. Röda rader indikerar stängda positioner. Klicka på länk symbolen för att se hela transaktionshistoriken.
Uppgradera
för att låsa upp premiumdata och exportera till Excel ![]() .
.
| Fil Datum | Källa | Investerare | Typ | Genomsnittligt pris (beräknat) |
Aktier | Δ Aktier (%) |
Rapporterat värde (1000 USD) |
Δ Värde (%) |
Portföljallokering (%) |
|
|---|---|---|---|---|---|---|---|---|---|---|
| 2025-09-04 | 13F/A | Advisor Group Holdings, Inc. | 362 187 | 32,09 | 9 445 | 32,43 | ||||
| 2025-08-08 | 13F | Sittner & Nelson, Llc | 2 000 | 52 | ||||||
| 2025-08-08 | 13F | Thoroughbred Financial Services, Llc | 11 569 | 0,00 | 0 | |||||
| 2025-08-11 | 13F | Private Advisor Group, LLC | 127 892 | −1,64 | 3 335 | −1,36 | ||||
| 2025-05-12 | 13F | Fmr Llc | 0 | −100,00 | 0 | |||||
| 2025-07-30 | 13F | Cullen/frost Bankers, Inc. | 18 139 | 0,07 | 473 | 0,42 | ||||
| 2025-07-31 | 13F | Hanlon Investment Management, Inc. | 9 243 | 241 | ||||||
| 2025-07-10 | 13F | Oliver Lagore Vanvalin Investment Group | 100 | 3 | ||||||
| 2025-08-13 | 13F | Capital Analysts, Inc. | 0 | −100,00 | 0 | |||||
| 2025-07-25 | 13F | Envestnet Portfolio Solutions, Inc. | 61 453 | −20,69 | 1 603 | −20,50 | ||||
| 2025-08-15 | 13F | Kestra Advisory Services, LLC | 222 407 | 267,04 | 5 800 | 268,02 | ||||
| 2025-08-11 | 13F | Principal Securities, Inc. | 71 569 | 37,50 | 1 867 | 38,12 | ||||
| 2025-07-15 | 13F | Hartmann Taylor Wealth Management, LLC | 120 082 | 34,78 | 3 132 | 35,13 | ||||
| 2025-08-12 | 13F | Jpmorgan Chase & Co | 322 | −99,87 | 8 | −99,87 | ||||
| 2025-07-28 | 13F | Eq Wealth Advisors, Llc | 1 154 | 0,00 | 30 | 0,00 | ||||
| 2025-05-13 | 13F | UBS Group AG | 0 | −100,00 | 0 | |||||
| 2025-08-15 | 13F | Morgan Stanley | 2 319 117 | 63,81 | 60 483 | 64,25 | ||||
| 2025-08-18 | 13F | Geneos Wealth Management Inc. | 47 811 | 60,08 | 1 247 | 60,57 | ||||
| 2025-07-22 | 13F | PUREfi Wealth, LLC | 431 489 | −6,20 | 11 253 | −5,95 | ||||
| 2025-07-29 | 13F | Koshinski Asset Management, Inc. | 8 038 | 210 | ||||||
| 2025-08-12 | 13F | Global Retirement Partners, LLC | 1 125 | −8,98 | 29 | −9,37 | ||||
| 2025-07-22 | 13F | Oak Hill Wealth Advisors, Llc | 18 434 | −23,42 | 481 | −23,16 | ||||
| 2025-07-23 | 13F | Lakeside Advisors, INC. | 9 500 | 0,00 | 248 | 0,00 | ||||
| 2025-08-15 | 13F | First Heartland Consultants, Inc. | 12 470 | 10,51 | 325 | 10,92 | ||||
| 2025-08-14 | 13F | Wiley Bros.-aintree Capital, Llc | 19 830 | 551 | ||||||
| 2025-08-14 | 13F | Betterment LLC | 118 562 | −49,64 | 3 | −50,00 | ||||
| 2025-07-29 | 13F | International Assets Investment Management, Llc | 15 700 | 32,77 | 409 | 33,22 | ||||
| 2025-08-15 | 13F | Tower Research Capital LLC (TRC) | 550 | 14 | ||||||
| 2025-08-14 | 13F | Royal Bank Of Canada | 131 267 | −5,65 | 3 423 | −5,42 | ||||
| 2025-07-25 | 13F | Atria Wealth Solutions, Inc. | 27 424 | −39,77 | 715 | −39,76 | ||||
| 2025-08-08 | 13F | Royal Harbor Partners, LLC | 67 684 | 0,00 | 1 765 | 0,28 | ||||
| 2025-08-15 | 13F | Captrust Financial Advisors | 728 735 | 19,19 | 19 005 | 19,51 | ||||
| 2025-08-27 | 13F/A | Brinker Capital Investments, LLC | 89 163 | 1,51 | 2 325 | 1,80 | ||||
| 2025-08-14 | 13F | Great Valley Advisor Group, Inc. | 52 642 | 69,37 | 1 373 | 69,80 | ||||
| 2025-07-03 | 13F | TrueWealth Advisors, LLC | 14 116 | −15,35 | 368 | −15,01 | ||||
| 2025-08-11 | 13F | Beta Wealth Group, Inc. | 88 511 | −61,76 | 2 308 | −61,66 | ||||
| 2025-08-13 | 13F | Russell Investments Group, Ltd. | 1 | 0 | ||||||
| 2025-08-13 | 13F | Baird Financial Group, Inc. | 60 800 | 553,76 | 1 586 | 557,68 | ||||
| 2025-08-06 | 13F | Souders Financial Advisors | 29 166 | 15,28 | 761 | 15,50 | ||||
| 2025-07-28 | 13F | Keeler & Nadler Financial Planning & Wealth Management | 65 227 | 74,12 | 1 701 | 74,82 | ||||
| 2025-08-06 | 13F | First Horizon Advisors, Inc. | 2 672 | 3,53 | 70 | 2,99 | ||||
| 2025-08-12 | 13F | Steward Partners Investment Advisory, Llc | 93 423 | 2 436 | ||||||
| 2025-08-14 | 13F | Benjamin Edwards Inc | 57 799 | 93,68 | 1 507 | 94,20 | ||||
| 2025-07-28 | 13F | Harbour Investments, Inc. | 16 831 | 0,00 | 439 | 0,23 | ||||
| 2025-07-24 | 13F | IFP Advisors, Inc | 167 | 4 | ||||||
| 2025-08-04 | 13F | Saxony Capital Management, LLC | 10 158 | 0,00 | 265 | 0,00 | ||||
| 2025-08-13 | 13F | EverSource Wealth Advisors, LLC | 61 716 | 49,39 | 1 610 | 49,81 | ||||
| 2025-08-11 | 13F | Elequin Capital Lp | 0 | −100,00 | 0 | |||||
| 2025-07-15 | 13F | Armis Advisers, LLC | 42 607 | 10,16 | 1 113 | 11,19 | ||||
| 2025-08-14 | 13F | Raymond James Financial Inc | 104 881 | 176,38 | 2 735 | 177,10 | ||||
| 2025-08-04 | 13F | Creative Financial Designs Inc /adv | 434 | 0,00 | 11 | 0,00 | ||||
| 2025-08-14 | 13F | Jane Street Group, Llc | 65 567 | −44,27 | 1 710 | −44,15 | ||||
| 2025-08-14 | 13F | Two Sigma Securities, Llc | 7 808 | 204 | ||||||
| 2025-08-13 | 13F | StoneX Group Inc. | 44 222 | 1 153 | ||||||
| 2025-08-13 | 13F | Capital International Investors | 12 206 945 | −0,79 | 318 357 | −0,52 | ||||
| 2025-08-19 | 13F | Advisory Services Network, LLC | 28 135 | 735 | ||||||
| 2025-08-13 | 13F | Cerity Partners LLC | 0 | −100,00 | 0 | |||||
| 2025-08-08 | 13F | Cetera Investment Advisers | 410 680 | 8,71 | 10 711 | 9,01 | ||||
| 2025-08-12 | 13F | J.w. Cole Advisors, Inc. | 21 415 | 559 | ||||||
| 2025-08-12 | 13F | Wood Tarver Financial Group, LLC | 14 253 | 0,21 | 0 | −100,00 | ||||
| 2025-08-07 | 13F | Allworth Financial LP | 234 | −56,26 | 6 | −53,85 | ||||
| 2025-08-14 | 13F | Comerica Bank | 853 | 22 | ||||||
| 2025-07-10 | 13F | Wealth Enhancement Advisory Services, Llc | 157 096 | −1,50 | 4 102 | −1,13 | ||||
| 2025-06-26 | NP | TAIAX - American Funds Tax-Aware Conservative Growth and Income Portfolio Class A This fund is a listed as child fund of Capital World Investors and if that institution has disclosed ownership in this security, then these positions will not be double counted when calculating total shares and total value | 7 632 734 | 0,87 | 197 535 | 0,13 | ||||
| 2025-08-06 | 13F | Prospera Financial Services Inc | 25 254 | 0,00 | 659 | 0,30 | ||||
| 2025-08-14 | 13F | IHT Wealth Management, LLC | 8 894 | −30,27 | 232 | −30,21 | ||||
| 2025-08-04 | 13F | Assetmark, Inc | 113 700 | 54,12 | 2 965 | 54,59 | ||||
| 2025-07-08 | 13F | Nbc Securities, Inc. | 2 204 | 67,86 | 0 | |||||
| 2025-08-14 | 13F | Mml Investors Services, Llc | 293 659 | 24,76 | 8 | 16,67 | ||||
| 2025-07-22 | 13F | Simplicity Wealth,LLC | 86 208 | 234,54 | 2 248 | 235,52 | ||||
| 2025-08-06 | 13F | Commonwealth Equity Services, Llc | 201 054 | 41,95 | 5 | 66,67 | ||||
| 2025-08-01 | 13F | Gwn Securities Inc. | 20 199 | 152,93 | 527 | 154,11 | ||||
| 2025-06-26 | NP | TEPAX - American Funds Tax-Exempt Preservation Portfolio Class A This fund is a listed as child fund of Capital World Investors and if that institution has disclosed ownership in this security, then these positions will not be double counted when calculating total shares and total value | 4 526 444 | −1,51 | 117 144 | −2,22 | ||||
| 2025-05-15 | 13F/A | Orion Portfolio Solutions, LLC | 87 838 | 5,75 | 2 285 | 5,89 | ||||
| 2025-07-30 | 13F | Smith Thornton Advisors LLC | 58 890 | 8,07 | 1 536 | 8,33 | ||||
| 2025-07-31 | 13F | Richards, Merrill & Peterson, Inc. | 18 900 | 0,00 | 493 | 0,20 | ||||
| 2025-08-06 | 13F | Wedbush Securities Inc | 32 635 | 1,61 | 1 | |||||
| 2025-08-14 | 13F | Sei Investments Co | 23 254 | 606 | ||||||
| 2025-07-21 | 13F | Ameritas Advisory Services, LLC | 2 745 | 72 | ||||||
| 2025-07-29 | 13F | Uhlmann Price Securities, Llc | 16 213 | 7,46 | 423 | 7,65 | ||||
| 2025-07-07 | 13F | Peterson Wealth Advisors, LLC | 11 009 | −9,67 | 287 | −8,89 | ||||
| 2025-07-18 | 13F | Truist Financial Corp | 95 039 | 6,08 | 2 479 | 6,35 | ||||
| 2025-08-14 | 13F | Old Mission Capital Llc | 0 | −100,00 | 0 | |||||
| 2025-08-13 | 13F | Capital Group Private Client Services, Inc. | 345 114 | 330,16 | 9 001 | 331,45 | ||||
| 2025-08-14 | 13F | Wells Fargo & Company/mn | 26 054 | 679 | ||||||
| 2025-08-27 | 13F | Tribridge Partners Financial LLC | 26 848 | 1 | ||||||
| 2025-07-22 | 13F | Confluence Wealth Services, Inc. | 42 259 | 4,75 | 1 102 | 5,86 | ||||
| 2025-08-13 | 13F | Jones Financial Companies Lllp | 182 402 | 267,55 | 4 756 | 268,97 | ||||
| 2025-07-24 | 13F | Financial Connections Group, Inc. | 168 237 | 28,48 | 4 | 33,33 | ||||
| 2025-08-14 | 13F | Visionary Wealth Advisors | 8 685 | 1,32 | 227 | 1,80 | ||||
| 2025-07-30 | 13F | D.a. Davidson & Co. | 24 555 | 24,30 | 640 | 24,76 | ||||
| 2025-07-17 | 13F | Janney Montgomery Scott LLC | 73 857 | −17,70 | 2 | −50,00 | ||||
| 2025-08-12 | 13F | LPL Financial LLC | 972 516 | 21,35 | 25 363 | 21,67 | ||||
| 2025-08-13 | 13F | Gateway Wealth Partners, LLC | 12 513 | 326 | ||||||
| 2025-07-31 | 13F | Cambridge Investment Research Advisors, Inc. | 194 393 | 22,74 | 5 | 25,00 | ||||
| 2025-07-14 | 13F | AdvisorNet Financial, Inc | 4 100 | −11,85 | 107 | −11,67 | ||||
| 2025-08-12 | 13F | Jacobi Capital Management LLC | 31 883 | 0,78 | 831 | 1,09 | ||||
| 2025-08-08 | 13F | Avantax Advisory Services, Inc. | 17 884 | 23,36 | 466 | 23,61 | ||||
| 2025-07-14 | 13F | U.S. Capital Wealth Advisors, LLC | 13 550 | 0,00 | 353 | 0,28 | ||||
| 2025-08-12 | 13F | Proequities, Inc. | 0 | 0 | ||||||
| 2025-08-06 | 13F | Vestmark Advisory Solutions, Inc. | 367 896 | 128,90 | 9 595 | 129,52 | ||||
| 2025-08-05 | 13F | GPS Wealth Strategies Group, LLC | 1 950 | 0,00 | 51 | 0,00 | ||||
| 2025-08-14 | 13F | Citadel Advisors Llc | 0 | −100,00 | 0 | |||||
| 2025-07-29 | 13F | Stephens Inc /ar/ | 11 995 | −72,65 | 313 | −72,63 | ||||
| 2025-08-08 | 13F | Capital Investment Advisory Services, LLC | 4 800 | 125 | ||||||
| 2025-08-13 | 13F | Northwestern Mutual Wealth Management Co | 116 354 | 108,78 | 3 034 | 109,39 | ||||
| 2025-08-01 | 13F | Envestnet Asset Management Inc | 1 706 930 | 8,20 | 44 517 | 8,49 | ||||
| 2025-07-29 | 13F | Cottonwood Capital Advisors, Llc | 62 631 | 53,43 | 1 633 | 53,91 |