Grundläggande statistik
| Institutionella ägare | 186 total, 186 long only, 0 short only, 0 long/short - change of 19,87% MRQ |
| Genomsnittlig portföljallokering | 0.3138 % - change of 4,93% MRQ |
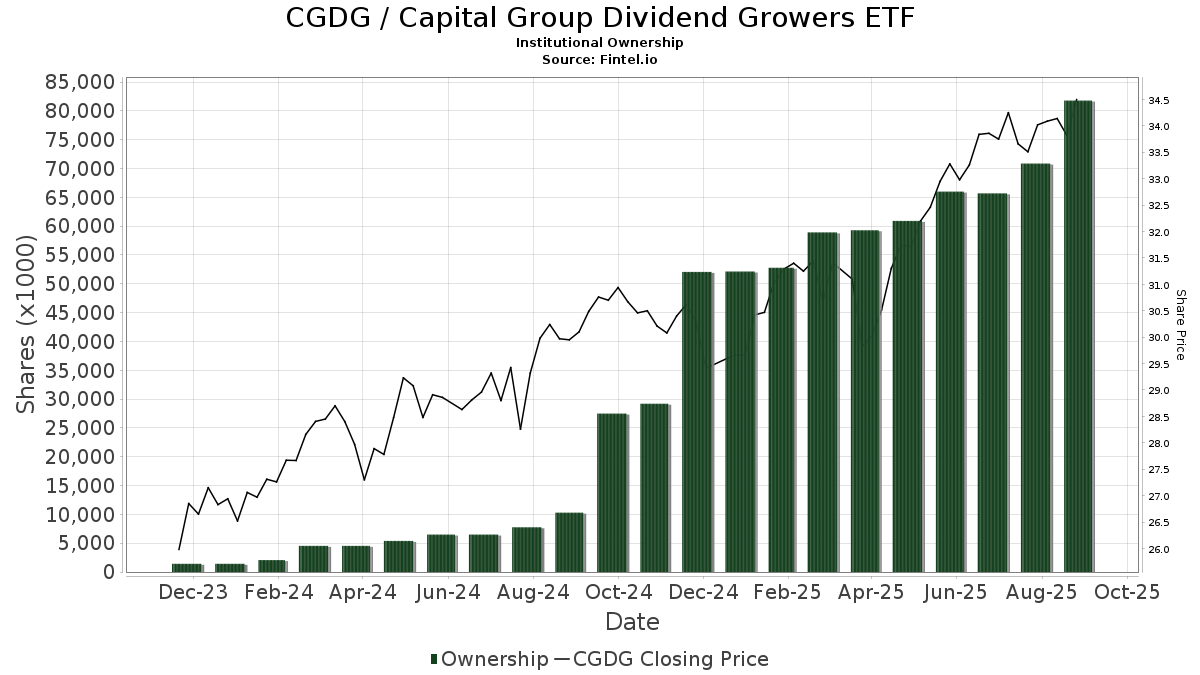
| Institutionella aktier (lång) | 81 783 749 (ex 13D/G) - change of 15,79MM shares 23,93% MRQ |
| Institutionellt värde (lång) | $ 2 567 612 USD ($1000) |
Institutionellt ägande och aktieägare
Capital Group Dividend Growers ETF (US:CGDG) har 186 Institutionella ägare och aktieägare som har lämnat in 13D/G- eller 13F-formulär till Securities Exchange Commission (SEC). Dessa institut innehar totalt 81,783,749 aktier. Största aktieägare inkluderar Capital International Investors, TAIAX - American Funds Tax-Aware Conservative Growth and Income Portfolio Class A, Envestnet Asset Management Inc, LPL Financial LLC, Capital Group Private Client Services, Inc., Advance Capital Management, Inc., Raymond James Financial Inc, Commonwealth Equity Services, Llc, Cetera Investment Advisers, and Morgan Stanley .
Capital Group Dividend Growers ETF (ARCA:CGDG) Institutionell ägarstruktur visar institutioners och fonders nuvarande positioner i företaget, samt de senaste förändringarna i positionernas storlek. Större aktieägare kan vara enskilda investerare, fonder, hedgefonder eller institutioner. Bilaga 13D visar att investeraren äger (eller ägde) mer än 5% av företaget och avser (eller avsåg) att aktivt eftersträva en förändring av affärsstrategin. Schedule 13G indikerar en passiv investering på över 5%.
The share price as of September 11, 2025 is 34,85 / share. Previously, on September 12, 2024, the share price was 30,14 / share. This represents an increase of 15,63% over that period.
Fondsentimentets poäng
Fondsentimentet poängen(fka Ägarackumulation-poäng) visar vilka aktier som är mest köpta av fonder. Det är resultatet av en sofistikerad kvantitativ flerfaktormodell som identifierar företag med de högsta nivåerna av institutionell ackumulering. Poängsättningsmodellen använder en kombination av den totala ökningen av redovisade ägare, förändringarna i portföljallokeringarna för dessa ägare och andra mått. Siffran sträcker sig från 0 till 100, där högre siffror indikerar en högre nivå av ackumulering i förhållande till sina konkurrenter, och 50 är genomsnittet.
Uppdateringsfrekvens: Dagligen
Se Ownership Explorer, som innehåller en lista över de högst rankade företagen.
Institutionell sälj/köp-kvot
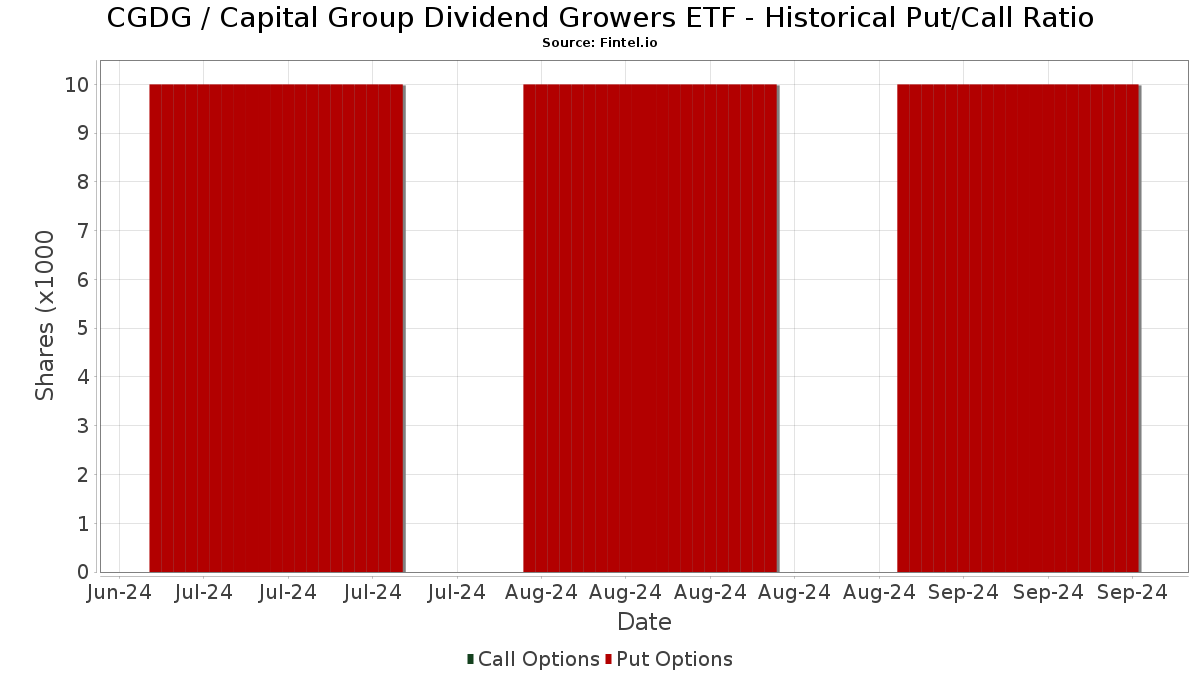
Förutom att rapportera vanliga eget kapital- och skuldemissioner måste institutioner med mer än 100MM tillgångar under förvaltning också avslöja sina innehav av sälj- och köpoptioner. Eftersom säljoptioner i allmänhet indikerar ett negativt sentiment och köpoptioner indikerar ett positivt sentiment, kan vi få en uppfattning om det övergripande institutionella sentimentet genom att plotta förhållandet mellan säljoptioner och köpoptioner. Diagrammet till höger visar det historiska förhållandet mellan sälj- och köpoptioner för detta instrument.
Genom att använda sälj/köp-kvoten som en indikator på aktieägarnas sentiment undviker man en av de största bristerna med att använda det totala institutionella ägandet, nämligen att en betydande del av de förvaltade tillgångarna investeras passivt för att följa index. Passivt förvaltade fonder köper vanligtvis inte optioner, så indikatorn för sälj/köp-kvoten ger en bättre bild av stämningen i aktivt förvaltade fonder.
13F- och NPORT-arkiveringar
Detaljer om 13F-arkiveringar är gratis. Detaljer om NP-arkiveringar kräver ett premiummedlemskap. Gröna rader indikerar nya positioner. Röda rader indikerar stängda positioner. Klicka på länk symbolen för att se hela transaktionshistoriken.
Uppgradera
för att låsa upp premiumdata och exportera till Excel ![]() .
.
| Fil Datum | Källa | Investerare | Typ | Genomsnittligt pris (beräknat) |
Aktier | Δ Aktier (%) |
Rapporterat värde (1000 USD) |
Δ Värde (%) |
Portföljallokering (%) |
|
|---|---|---|---|---|---|---|---|---|---|---|
| 2025-08-11 | 13F | Synergy Investment Management, LLC | 0 | −100,00 | 0 | |||||
| 2025-08-05 | 13F | Plante Moran Financial Advisors, LLC | 0 | −100,00 | 0 | |||||
| 2025-07-22 | 13F | Merit Financial Group, LLC | 143 342 | 142,33 | 4 821 | 163,82 | ||||
| 2025-07-29 | 13F | Signature Estate & Investment Advisors Llc | 13 835 | 1,79 | 465 | 10,98 | ||||
| 2025-08-14 | 13F | UBS Group AG | 653 158 | 104,59 | 21 966 | 122,66 | ||||
| 2025-07-11 | 13F | Bond & Devick Financial Network, Inc. | 8 237 | 0,00 | 277 | 9,06 | ||||
| 2025-07-14 | 13F | Sweeney & Michel, Llc | 270 271 | 1,24 | 9 135 | 22,13 | ||||
| 2025-08-08 | 13F | Gts Securities Llc | 33 748 | 86,20 | 1 135 | 102,50 | ||||
| 2025-08-11 | 13F | Private Advisor Group, LLC | 514 938 | 69,55 | 17 317 | 84,54 | ||||
| 2025-07-22 | 13F | Gutierrez Wealth Advisory, LLC | 9 197 | 309 | ||||||
| 2025-07-29 | 13F | Balboa Wealth Partners | 7 095 | 239 | ||||||
| 2025-05-12 | 13F | Fmr Llc | 0 | −100,00 | 0 | |||||
| 2025-08-12 | 13F | Lodestone Wealth Management LLC | 12 737 | 24,35 | 428 | 35,44 | ||||
| 2025-07-24 | 13F | Stonebridge Financial Group, LLC | 0 | −100,00 | 0 | |||||
| 2025-07-29 | 13F | Private Trust Co Na | 12 129 | 0,00 | 408 | 8,82 | ||||
| 2025-05-14 | 13F | Huntington National Bank | 4 | |||||||
| 2025-05-02 | 13F | Capital A Wealth Management, LLC | 889 | 6,85 | 27 | 12,50 | ||||
| 2025-08-12 | 13F | Summit Global Investments | 8 194 | 0 | ||||||
| 2025-08-11 | 13F | Principal Securities, Inc. | 44 240 | 41,51 | 1 488 | 60,58 | ||||
| 2025-08-14 | 13F | Wells Fargo & Company/mn | 145 814 | 89 356,44 | 4 904 | 97 960,00 | ||||
| 2025-08-12 | 13F | Jpmorgan Chase & Co | 2 522 | −77,14 | 85 | −75,29 | ||||
| 2025-07-28 | 13F | Sagespring Wealth Partners, Llc | 42 715 | 18,91 | 1 437 | 29,49 | ||||
| 2025-07-22 | 13F | Wealthcare Advisory Partners LLC | 7 993 | 269 | ||||||
| 2025-07-16 | 13F | Strategic Investment Solutions, Inc. /IL | 1 648 | 10,75 | 55 | 22,22 | ||||
| 2025-07-29 | 13F | Koshinski Asset Management, Inc. | 45 061 | 5,68 | 1 515 | 15,03 | ||||
| 2025-08-04 | 13F | Mesirow Financial Investment Management, Inc. | 17 887 | 602 | ||||||
| 2025-08-13 | 13F | Bare Financial Services, Inc | 7 598 | 256 | ||||||
| 2025-08-14 | 13F | GWM Advisors LLC | 42 545 | 45,67 | 1 431 | 58,54 | ||||
| 2025-07-22 | 13F | DAVENPORT & Co LLC | 7 043 | 237 | ||||||
| 2025-08-14 | 13F | Wiley Bros.-aintree Capital, Llc | 208 554 | 80,59 | 7 051 | 96,30 | ||||
| 2025-07-29 | 13F | International Assets Investment Management, Llc | 13 433 | 0,49 | 452 | 9,20 | ||||
| 2025-08-14 | 13F | IHT Wealth Management, LLC | 10 777 | 362 | ||||||
| 2025-04-23 | 13F | Mascagni Wealth Management, Inc. | 0 | −100,00 | 0 | −100,00 | ||||
| 2025-07-25 | 13F | Atria Wealth Solutions, Inc. | 51 816 | −56,25 | 1 754 | −52,27 | ||||
| 2025-08-14 | 13F | Clg Llc | 19 378 | 14,77 | 652 | 24,95 | ||||
| 2025-08-08 | 13F | Kingsview Wealth Management, LLC | 27 711 | 7,64 | 932 | 17,11 | ||||
| 2025-08-14 | 13F | Great Valley Advisor Group, Inc. | 13 743 | 56,94 | 462 | 71,11 | ||||
| 2025-08-14 | 13F | Mpwm Advisory Solutions, Llc | 262 | 9 | ||||||
| 2025-08-08 | 13F | CWS Financial Advisors, LLC | 43 405 | 68,45 | 1 460 | 83,29 | ||||
| 2025-08-14 | 13F | Benjamin Edwards Inc | 486 169 | 57,03 | 16 350 | 70,91 | ||||
| 2025-08-13 | 13F | Baird Financial Group, Inc. | 158 126 | 2,74 | 5 318 | 11,82 | ||||
| 2025-07-21 | 13F | Patriot Financial Group Insurance Agency, LLC | 22 995 | 1,10 | 773 | 10,11 | ||||
| 2025-07-24 | 13F | IFP Advisors, Inc | 11 237 | 92,84 | 378 | 109,44 | ||||
| 2025-08-13 | 13F | First Trust Advisors Lp | 11 060 | 372 | ||||||
| 2025-08-12 | 13F | Steward Partners Investment Advisory, Llc | 70 702 | 46,96 | 2 378 | 59,96 | ||||
| 2025-07-08 | 13F | Advance Capital Management, Inc. | 2 669 679 | 89 781 | ||||||
| 2025-07-29 | 13F | Latitude Advisors, LLC | 20 414 | 17,93 | 687 | 28,46 | ||||
| 2025-08-04 | 13F | Flagship Harbor Advisors, Llc | 24 207 | 814 | ||||||
| 2025-08-29 | 13F | Centaurus Financial, Inc. | 6 331 | 11,28 | 0 | |||||
| 2025-08-14 | 13F | Royal Bank Of Canada | 1 546 267 | 24,96 | 52 001 | 36,00 | ||||
| 2025-08-12 | 13F | Titleist Asset Management, Llc | 10 431 | 2,64 | 351 | 11,46 | ||||
| 2025-08-12 | 13F | Putnam Fl Investment Management Co | 32 129 | −18,73 | 1 081 | −11,55 | ||||
| 2025-06-26 | NP | TAIAX - American Funds Tax-Aware Conservative Growth and Income Portfolio Class A This fund is a listed as child fund of Capital World Investors and if that institution has disclosed ownership in this security, then these positions will not be double counted when calculating total shares and total value | 17 291 935 | −1,74 | 541 238 | 0,12 | ||||
| 2025-08-12 | 13F | Coldstream Capital Management Inc | 0 | −100,00 | 0 | |||||
| 2025-08-13 | 13F | Continuum Advisory, LLC | 12 692 | 5,15 | 427 | 14,52 | ||||
| 2025-08-14 | 13F | Susquehanna International Group, Llp | 695 783 | 23 399 | ||||||
| 2025-07-10 | 13F | Wealth Enhancement Advisory Services, Llc | 123 280 | 15,60 | 4 185 | 27,01 | ||||
| 2025-08-12 | 13F | J.w. Cole Advisors, Inc. | 16 014 | 13,15 | 539 | 23,11 | ||||
| 2025-08-08 | 13F | Security Financial Services, INC. | 11 804 | 397 | ||||||
| 2025-07-24 | 13F | MSH Capital Advisors LLC | 8 511 | 286 | ||||||
| 2025-08-08 | 13F | Cetera Investment Advisers | 1 758 205 | 12,83 | 59 128 | 22,80 | ||||
| 2025-08-07 | 13F | Allworth Financial LP | 5 854 | 295,54 | 197 | 335,56 | ||||
| 2025-08-26 | 13F | Nautilus Advisors LLC | 52 276 | 13,04 | 1 758 | 23,02 | ||||
| 2025-08-04 | 13F | Spire Wealth Management | 270 | 0,37 | 9 | 12,50 | ||||
| 2025-07-11 | 13F | Lincoln Capital LLC | 15 331 | 7,17 | 516 | 19,21 | ||||
| 2025-08-15 | 13F | Captrust Financial Advisors | 182 093 | 9,56 | 6 124 | 19,24 | ||||
| 2025-08-14 | 13F | Old Mission Capital Llc | 30 714 | 1 033 | ||||||
| 2025-07-21 | 13F | Ameritas Advisory Services, LLC | 93 496 | −25,68 | 3 144 | −17,91 | ||||
| 2025-07-22 | 13F | Berger Financial Group, Inc | 12 751 | 44,88 | 429 | 57,93 | ||||
| 2025-08-14 | 13F | Sei Investments Co | 255 957 | 2 931,95 | 8 608 | 3 210,38 | ||||
| 2025-08-06 | 13F | Prospera Financial Services Inc | 13 693 | 59,42 | 460 | 73,58 | ||||
| 2025-07-11 | 13F | Farther Finance Advisors, LLC | 4 100 | 138 | ||||||
| 2025-08-06 | 13F | Founders Financial Securities Llc | 109 074 | 26,36 | 3 668 | 36,81 | ||||
| 2025-08-18 | 13F | Geneos Wealth Management Inc. | 31 450 | 98,39 | 1 058 | 116,16 | ||||
| 2025-08-15 | 13F | Equitable Holdings, Inc. | 50 201 | 115,06 | 1 688 | 134,12 | ||||
| 2025-07-16 | 13F | Swisher Financial Concepts, Inc. | 160 846 | 20,90 | 5 409 | 31,57 | ||||
| 2025-08-13 | 13F | Capital Analysts, Inc. | 1 619 | 0,43 | 0 | |||||
| 2025-07-17 | 13F | Janney Montgomery Scott LLC | 196 500 | 26,27 | 7 | 50,00 | ||||
| 2025-08-13 | 13F | Capital Group Private Client Services, Inc. | 4 078 770 | 34,42 | 137 169 | 46,30 | ||||
| 2025-07-17 | 13F | LifeGoal Wealth Advisors | 49 243 | −28,11 | 1 656 | −22,47 | ||||
| 2025-07-30 | 13F | Strategic Blueprint, LLC | 18 231 | 613 | ||||||
| 2025-08-12 | 13F | Gladstone Institutional Advisory LLC | 42 597 | 35,87 | 1 433 | 47,93 | ||||
| 2025-08-14 | 13F | Integrated Wealth Concepts LLC | 85 522 | 97,35 | 2 876 | 114,79 | ||||
| 2025-07-31 | 13F | Cambridge Investment Research Advisors, Inc. | 820 477 | 35,73 | 28 | 50,00 | ||||
| 2025-05-14 | 13F | Oarsman Capital, Inc. | 0 | −100,00 | 0 | −100,00 | ||||
| 2025-07-14 | 13F | Ai Financial Services Llc | 26 532 | 8,84 | 892 | 18,46 | ||||
| 2025-08-06 | 13F | Vestmark Advisory Solutions, Inc. | 655 048 | 105,86 | 22 029 | 124,05 | ||||
| 2025-07-14 | 13F | U.S. Capital Wealth Advisors, LLC | 131 366 | 17,45 | 4 418 | 27,81 | ||||
| 2025-08-13 | 13F | Aspire Growth Partners LLC | 23 811 | 0,00 | 801 | 5,96 | ||||
| 2025-08-13 | 13F | Cary Street Partners Financial Llc | 281 161 | 2 262,10 | 9 455 | 2 476,29 | ||||
| 2025-08-14 | 13F | Gerber Kawasaki Wealth & Investment Management | 24 245 | 815 | ||||||
| 2025-07-23 | 13F | Trueblood Wealth Management, LLC | 47 444 | 12,68 | 1 596 | 22,60 | ||||
| 2025-08-12 | 13F | LPL Financial LLC | 5 565 635 | 103,35 | 187 172 | 121,31 | ||||
| 2025-07-25 | 13F | Concurrent Investment Advisors, LLC | 178 946 | 5,67 | 6 018 | 15,00 | ||||
| 2025-07-16 | 13F | ORG Partners LLC | 12 486 | 914,30 | 421 | 1 007,89 | ||||
| 2025-08-12 | 13F | Global Retirement Partners, LLC | 2 805 | 807,77 | 94 | 944,44 | ||||
| 2025-08-14 | 13F | Raymond James Financial Inc | 2 652 387 | 46,33 | 89 200 | 59,26 | ||||
| 2025-07-29 | 13F | Stephens Inc /ar/ | 8 875 | 298 | ||||||
| 2025-08-14 | 13F | Jane Street Group, Llc | 381 723 | 5,94 | 12 837 | 15,31 | ||||
| 2025-08-08 | 13F | Larson Financial Group LLC | 3 650 | 0,00 | 123 | 8,93 | ||||
| 2025-05-09 | 13F | Pnc Financial Services Group, Inc. | 0 | −100,00 | 0 | |||||
| 2025-08-12 | 13F | Proequities, Inc. | 0 | 0 | ||||||
| 2025-04-16 | 13F | New Century Financial Group, LLC | 0 | −100,00 | 0 | −100,00 | ||||
| 2025-08-08 | 13F | Sittner & Nelson, Llc | 1 010 | 34 | ||||||
| 2025-07-09 | 13F | WealthCare Investment Partners, LLC | 139 089 | −5,40 | 4 722 | 7,61 | ||||
| 2025-07-31 | 13F | Moloney Securities Asset Management, LLC | 19 329 | 119,50 | 650 | 138,97 | ||||
| 2025-07-24 | 13F | Us Bancorp \de\ | 75 531 | 6,65 | 2 540 | 16,09 | ||||
| 2025-09-04 | 13F/A | Advisor Group Holdings, Inc. | 668 976 | 66,84 | 22 382 | 80,61 | ||||
| 2025-07-30 | 13F | BlueChip Wealth Advisors LLC | 132 024 | 9,18 | 4 440 | 18,82 | ||||
| 2025-08-08 | 13F | New England Capital Financial Advisors LLC | 0 | −100,00 | 0 | |||||
| 2025-07-17 | 13F | Venture Visionary Partners LLC | 18 934 | 169,45 | 637 | 193,09 | ||||
| 2025-07-22 | 13F | Simplicity Wealth,LLC | 37 886 | 122,56 | 1 274 | 142,21 | ||||
| 2025-07-23 | 13F | Seamount Financial Group Inc | 57 185 | 26,77 | 1 923 | 38,05 | ||||
| 2025-08-12 | 13F | TCP Asset Management, LLC | 6 026 | 203 | ||||||
| 2025-07-30 | 13F | Onyx Bridge Wealth Group LLC | 285 341 | 9 604 | ||||||
| 2025-07-25 | 13F | Apollon Wealth Management, LLC | 43 291 | 1 456 | ||||||
| 2025-07-09 | 13F | Dynamic Advisor Solutions LLC | 49 093 | −10,79 | 1 651 | −2,88 | ||||
| 2025-08-14 | 13F | Main Street Financial Solutions, LLC | 15 063 | 507 | ||||||
| 2025-07-09 | 13F | Massmutual Trust Co Fsb/adv | 4 | 0,00 | 0 | |||||
| 2025-08-15 | 13F | Morgan Stanley | 1 752 454 | 73,70 | 58 935 | 89,05 | ||||
| 2025-07-24 | 13F | MFA Wealth Services | 32 469 | 1 092 | ||||||
| 2025-08-15 | 13F | Kestra Advisory Services, LLC | 207 794 | 102,45 | 6 988 | 120,37 | ||||
| 2025-08-04 | 13F | Atria Investments Llc | 0 | −100,00 | 0 | |||||
| 2025-08-06 | 13F | First Horizon Advisors, Inc. | 748 | 21,23 | 25 | 31,58 | ||||
| 2025-08-12 | 13F | SRS Capital Advisors, Inc. | 763 | 19,22 | 26 | 31,58 | ||||
| 2025-08-14 | 13F | Citadel Advisors Llc | 165 054 | 1 070,76 | 5 551 | 1 175,86 | ||||
| 2025-08-13 | 13F | VestGen Advisors, LLC | 272 907 | −1,09 | 9 178 | 7,65 | ||||
| 2025-08-15 | 13F | Lantern Wealth Advisors, LLC | 8 752 | 294 | ||||||
| 2025-07-28 | 13F | Harbour Investments, Inc. | 170 062 | 68,45 | 5 719 | 83,36 | ||||
| 2025-07-15 | 13F | Hartmann Taylor Wealth Management, LLC | 7 000 | 235 | ||||||
| 2025-07-11 | 13F | Trinity Wealth Management, LLC | 10 484 | 353 | ||||||
| 2025-07-24 | 13F | NavPoint Financial, Inc. | 45 253 | 452,74 | 1 522 | 503,57 | ||||
| 2025-07-22 | 13F | Oak Hill Wealth Advisors, Llc | 59 577 | 34,71 | 2 012 | 47,22 | ||||
| 2025-07-11 | 13F | LongView Wealth Management | 70 579 | 32,94 | 2 374 | 44,70 | ||||
| 2025-08-11 | 13F | Rothschild Investment Llc | 536 824 | 8,06 | 18 053 | 17,61 | ||||
| 2025-07-17 | 13F | Tempus Wealth Planning, LLC | 82 695 | 3,46 | 2 781 | 12,64 | ||||
| 2025-05-16 | 13F/A | Kestra Investment Management, LLC | 0 | −100,00 | 0 | |||||
| 2025-07-25 | 13F | LRI Investments, LLC | 22 000 | 740 | ||||||
| 2025-08-13 | 13F | Russell Investments Group, Ltd. | 78 | 3 | ||||||
| 2025-07-23 | 13F | Valmark Advisers, Inc. | 562 974 | 5,84 | 18 933 | 15,19 | ||||
| 2025-07-28 | 13F | RFG Advisory, LLC | 32 251 | 135,87 | 1 085 | 156,87 | ||||
| 2025-08-07 | 13F | Kestra Private Wealth Services, Llc | 22 786 | 766 | ||||||
| 2025-08-11 | 13F | HighTower Advisors, LLC | 50 282 | 13,41 | 1 691 | 23,45 | ||||
| 2025-08-07 | 13F | PFG Advisors | 22 023 | 14,95 | 741 | 25,00 | ||||
| 2025-08-05 | 13F | Westside Investment Management, Inc. | 11 850 | 351,43 | 399 | 391,36 | ||||
| 2025-07-14 | 13F | Armstrong Advisory Group, Inc | 0 | −100,00 | 0 | |||||
| 2025-07-30 | 13F | Cullen/frost Bankers, Inc. | 126 457 | 30,57 | 4 253 | 42,11 | ||||
| 2025-08-14 | 13F | Comerica Bank | 64 536 | 29,02 | 2 170 | 40,45 | ||||
| 2025-08-19 | 13F | Advisory Services Network, LLC | 22 850 | 760 | ||||||
| 2025-05-12 | 13F | Independent Advisor Alliance | 0 | −100,00 | 0 | |||||
| 2025-07-21 | 13F | Ameriflex Group, Inc. | 0 | −100,00 | 0 | |||||
| 2025-07-10 | 13F | Sovran Advisors, LLC | 51 662 | 213,43 | 1 745 | 250,91 | ||||
| 2025-08-01 | 13F | Envestnet Asset Management Inc | 5 842 721 | 17,89 | 196 491 | 28,30 | ||||
| 2025-08-13 | 13F | Capital International Investors | 17 350 853 | −0,01 | 583 509 | 8,83 | ||||
| 2025-08-27 | 13F/A | Brinker Capital Investments, LLC | 138 630 | 0,83 | 4 662 | 9,75 | ||||
| 2025-08-14 | 13F | Mml Investors Services, Llc | 1 125 534 | 15,54 | 38 | 23,33 | ||||
| 2025-08-04 | 13F | Pensionmark Financial Group, Llc | 37 768 | 3,04 | 1 270 | 12,19 | ||||
| 2025-08-14 | 13F | Smartleaf Asset Management LLC | 389 677 | 6,64 | 13 132 | 16,12 | ||||
| 2025-08-04 | 13F | Creative Financial Designs Inc /adv | 5 824 | 2,05 | 196 | 10,80 | ||||
| 2025-08-14 | 13F | CoreCap Advisors, LLC | 0 | −100,00 | 0 | |||||
| 2025-07-08 | 13F | Nbc Securities, Inc. | 2 368 | 318,37 | 0 | |||||
| 2025-07-18 | 13F | QTR Family Wealth, LLC | 28 311 | 15,33 | 952 | 25,59 | ||||
| 2025-08-14 | 13F | Herold Advisors, Inc. | 8 752 | 294 | ||||||
| 2025-08-01 | 13F | Signature Wealth Management Group | 16 746 | −21,20 | 563 | −14,18 | ||||
| 2025-05-09 | 13F | Beta Wealth Group, Inc. | 0 | −100,00 | 0 | |||||
| 2025-05-15 | 13F/A | Orion Portfolio Solutions, LLC | 137 488 | 12,82 | 4 248 | 17,61 | ||||
| 2025-08-04 | 13F | Continental Investors Services, Inc. | 14 721 | −2,11 | 495 | 6,68 | ||||
| 2025-08-01 | 13F | Gwn Securities Inc. | 6 419 | −67,87 | 216 | −64,99 | ||||
| 2025-08-14 | 13F | Betterment LLC | 33 604 | 1 | ||||||
| 2025-08-04 | 13F | Assetmark, Inc | 282 713 | 1,96 | 9 508 | 10,97 | ||||
| 2025-08-01 | 13F | Rossby Financial, LCC | 61 | 2 | ||||||
| 2025-07-14 | 13F | AdvisorNet Financial, Inc | 1 313 | 483,56 | 44 | 633,33 | ||||
| 2025-07-14 | 13F | Sowell Financial Services LLC | 46 832 | 376,95 | 1 575 | 419,47 | ||||
| 2025-07-30 | 13F | Bleakley Financial Group, LLC | 158 235 | 324,84 | 5 321 | 362,70 | ||||
| 2025-07-16 | 13F/A | CX Institutional | 619 | 82,06 | 0 | |||||
| 2025-08-06 | 13F | Wedbush Securities Inc | 26 696 | −41,50 | 1 | −100,00 | ||||
| 2025-08-06 | 13F | Commonwealth Equity Services, Llc | 1 898 865 | 20,31 | 64 | 31,25 | ||||
| 2025-08-14 | 13F | Stifel Financial Corp | 451 044 | 10,65 | 15 171 | 20,44 | ||||
| 2025-07-25 | 13F | M.e. Allison & Co., Inc. | 17 705 | 1,49 | 595 | 10,39 | ||||
| 2025-07-29 | 13F | Stratos Wealth Partners, LTD. | 46 380 | 276,03 | 1 560 | 309,19 | ||||
| 2025-07-22 | 13F | Confluence Wealth Services, Inc. | 1 661 858 | 5,96 | 55 888 | 16,80 | ||||
| 2025-08-14 | 13F | Sunbelt Securities, Inc. | 2 300 | 0,00 | 68 | −4,23 | ||||
| 2025-07-18 | 13F | Truist Financial Corp | 175 407 | 9,18 | 5 899 | 18,82 | ||||
| 2025-07-24 | 13F | CarsonAllaria Wealth Management, Ltd. | 0 | −100,00 | 0 | |||||
| 2025-08-12 | 13F | Insigneo Advisory Services, Llc | 15 928 | 0,00 | 536 | 8,74 | ||||
| 2025-08-13 | 13F | Jones Financial Companies Lllp | 457 991 | 131,20 | 15 434 | 151,78 | ||||
| 2025-07-28 | 13F | Mutual Advisors, LLC | 28 495 | 19,90 | 976 | 32,83 | ||||
| 2025-08-13 | 13F | Gateway Wealth Partners, LLC | 25 959 | 50,13 | 873 | 63,48 | ||||
| 2025-08-12 | 13F | Entruity Wealth, LLC | 175 917 | 5,05 | 5 916 | 14,34 | ||||
| 2025-07-03 | 13F | Arvest Investments, Inc. | 1 330 | 0,00 | 45 | 7,32 | ||||
| 2025-08-04 | 13F | Mayflower Financial Advisors, LLC | 56 484 | 1,20 | 1 900 | 10,15 | ||||
| 2025-07-25 | 13F | Envestnet Portfolio Solutions, Inc. | 134 327 | −33,14 | 4 517 | −27,23 | ||||
| 2025-08-13 | 13F | Vermillion & White Wealth Management Group, LLC | 3 593 | 2,95 | 121 | 12,15 | ||||
| 2025-07-30 | 13F | D.a. Davidson & Co. | 126 867 | 519,50 | 4 267 | 575,00 | ||||
| 2025-08-14 | 13F | Mariner, LLC | 30 664 | 5,85 | 1 031 | 15,20 | ||||
| 2025-07-24 | 13F | Endeavor Private Wealth, Inc. | 65 325 | 24,19 | 2 212 | 35,48 | ||||
| 2025-08-12 | 13F | Jacobi Capital Management LLC | 46 572 | 4,23 | 1 566 | 13,48 | ||||
| 2025-07-25 | 13F | Cwm, Llc | 6 615 | 21,58 | 0 | |||||
| 2025-08-15 | 13F | First Heartland Consultants, Inc. | 14 141 | 476 | ||||||
| 2025-08-14 | 13F | D. E. Shaw & Co., Inc. | 19 491 | 46,58 | 655 | 59,76 | ||||
| 2025-07-18 | 13F | Vicus Capital | 10 327 | 347 | ||||||
| 2025-08-13 | 13F | Northwestern Mutual Wealth Management Co | 545 726 | 44,32 | 18 353 | 57,07 | ||||
| 2025-08-08 | 13F | Avantax Advisory Services, Inc. | 295 664 | 274,50 | 9 943 | 307,67 | ||||
| 2025-07-14 | 13F | Park Avenue Securities Llc | 19 933 | 12,20 | 1 | |||||
| 2025-08-14 | 13F | Snowden Capital Advisors LLC | 9 192 | 311 | ||||||
| 2025-08-13 | 13F | Flow Traders U.s. Llc | 84 753 | 3 | ||||||
| 2025-05-15 | 13F | Perennial Investment Advisors, LLC | 0 | −100,00 | 0 |