Grundläggande statistik
| Institutionella ägare | 134 total, 134 long only, 0 short only, 0 long/short - change of 4,65% MRQ |
| Genomsnittlig portföljallokering | 0.1246 % - change of 5,87% MRQ |
| Institutionella aktier (lång) | 7 030 847 (ex 13D/G) - change of 0,21MM shares 3,10% MRQ |
| Institutionellt värde (lång) | $ 249 064 USD ($1000) |
Institutionellt ägande och aktieägare
BlackRock Science and Technology Trust (US:BST) har 134 Institutionella ägare och aktieägare som har lämnat in 13D/G- eller 13F-formulär till Securities Exchange Commission (SEC). Dessa institut innehar totalt 7,030,847 aktier. Största aktieägare inkluderar Morgan Stanley, Raymond James Financial Inc, Ameriprise Financial Inc, Invesco Ltd., PCEF - Invesco CEF Income Composite ETF, Karpus Management, Inc., Royal Bank Of Canada, 1607 Capital Partners, LLC, LPL Financial LLC, and Wedbush Securities Inc .
BlackRock Science and Technology Trust (NYSE:BST) Institutionell ägarstruktur visar institutioners och fonders nuvarande positioner i företaget, samt de senaste förändringarna i positionernas storlek. Större aktieägare kan vara enskilda investerare, fonder, hedgefonder eller institutioner. Bilaga 13D visar att investeraren äger (eller ägde) mer än 5% av företaget och avser (eller avsåg) att aktivt eftersträva en förändring av affärsstrategin. Schedule 13G indikerar en passiv investering på över 5%.
The share price as of September 9, 2025 is 39,72 / share. Previously, on September 10, 2024, the share price was 33,56 / share. This represents an increase of 18,36% over that period.

Fondsentimentets poäng
Fondsentimentet poängen(fka Ägarackumulation-poäng) visar vilka aktier som är mest köpta av fonder. Det är resultatet av en sofistikerad kvantitativ flerfaktormodell som identifierar företag med de högsta nivåerna av institutionell ackumulering. Poängsättningsmodellen använder en kombination av den totala ökningen av redovisade ägare, förändringarna i portföljallokeringarna för dessa ägare och andra mått. Siffran sträcker sig från 0 till 100, där högre siffror indikerar en högre nivå av ackumulering i förhållande till sina konkurrenter, och 50 är genomsnittet.
Uppdateringsfrekvens: Dagligen
Se Ownership Explorer, som innehåller en lista över de högst rankade företagen.
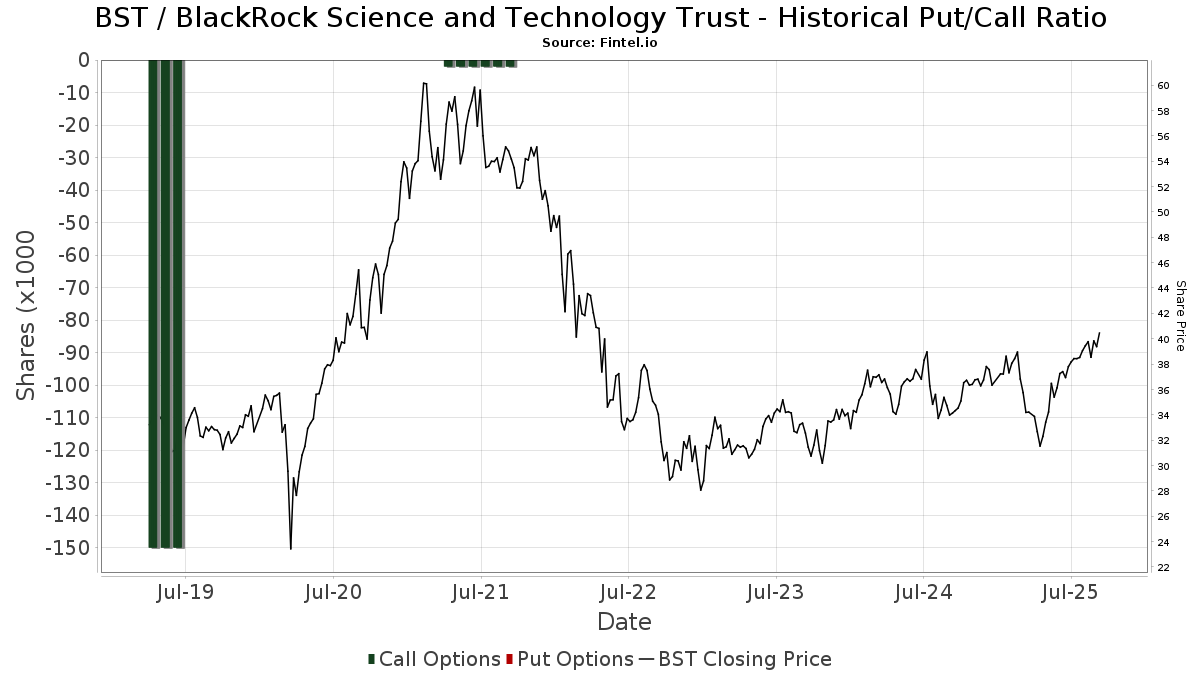
Institutionell sälj/köp-kvot
Förutom att rapportera vanliga eget kapital- och skuldemissioner måste institutioner med mer än 100MM tillgångar under förvaltning också avslöja sina innehav av sälj- och köpoptioner. Eftersom säljoptioner i allmänhet indikerar ett negativt sentiment och köpoptioner indikerar ett positivt sentiment, kan vi få en uppfattning om det övergripande institutionella sentimentet genom att plotta förhållandet mellan säljoptioner och köpoptioner. Diagrammet till höger visar det historiska förhållandet mellan sälj- och köpoptioner för detta instrument.
Genom att använda sälj/köp-kvoten som en indikator på aktieägarnas sentiment undviker man en av de största bristerna med att använda det totala institutionella ägandet, nämligen att en betydande del av de förvaltade tillgångarna investeras passivt för att följa index. Passivt förvaltade fonder köper vanligtvis inte optioner, så indikatorn för sälj/köp-kvoten ger en bättre bild av stämningen i aktivt förvaltade fonder.
13F- och NPORT-arkiveringar
Detaljer om 13F-arkiveringar är gratis. Detaljer om NP-arkiveringar kräver ett premiummedlemskap. Gröna rader indikerar nya positioner. Röda rader indikerar stängda positioner. Klicka på länk symbolen för att se hela transaktionshistoriken.
Uppgradera
för att låsa upp premiumdata och exportera till Excel ![]() .
.
| Fil Datum | Källa | Investerare | Typ | Genomsnittligt pris (beräknat) |
Aktier | Δ Aktier (%) |
Rapporterat värde (1000 USD) |
Δ Värde (%) |
Portföljallokering (%) |
|
|---|---|---|---|---|---|---|---|---|---|---|
| 2025-07-08 | 13F | Parallel Advisors, LLC | 721 | 8,26 | 28 | 28,57 | ||||
| 2025-09-04 | 13F/A | Advisor Group Holdings, Inc. | 148 258 | 9,57 | 5 659 | 26,77 | ||||
| 2025-07-10 | 13F | Focus Financial Network, Inc. | 15 773 | 9,37 | 602 | 26,74 | ||||
| 2025-08-05 | 13F | Westside Investment Management, Inc. | 700 | 0,00 | 27 | 13,04 | ||||
| 2025-08-04 | 13F | Creative Financial Designs Inc /adv | 313 | 0,00 | 12 | 10,00 | ||||
| 2025-08-14 | 13F | Federation des caisses Desjardins du Quebec | 970 | 0,00 | 37 | 15,63 | ||||
| 2025-08-14 | 13F | Stifel Financial Corp | 59 465 | 8,80 | 2 270 | 25,85 | ||||
| 2025-07-18 | 13F | Consolidated Portfolio Review Corp | 6 901 | −1,16 | 263 | 14,35 | ||||
| 2025-08-13 | 13F | Capital Analysts, Inc. | 660 | 0,00 | 0 | |||||
| 2025-08-14 | 13F | Goldman Sachs Group Inc | 8 347 | 35,79 | 319 | 57,43 | ||||
| 2025-08-14 | 13F | Royal Bank Of Canada | 296 112 | −0,24 | 11 303 | 15,44 | ||||
| 2025-05-13 | 13F | NINE MASTS CAPITAL Ltd | 0 | −100,00 | 0 | |||||
| 2025-08-12 | 13F | LPL Financial LLC | 260 467 | 4,24 | 9 942 | 20,61 | ||||
| 2025-08-08 | 13F | Larson Financial Group LLC | 1 115 | 0,00 | 43 | 16,67 | ||||
| 2025-08-14 | 13F | Comerica Bank | 2 330 | 8,47 | 89 | 25,71 | ||||
| 2025-08-08 | 13F | Calamos Advisors LLC | 8 586 | 1,11 | 328 | 16,79 | ||||
| 2025-07-25 | 13F | Cwm, Llc | 3 336 | −2,54 | 0 | |||||
| 2025-08-05 | 13F | EPG Wealth Management LLC | 0 | −100,00 | 0 | |||||
| 2025-08-14 | 13F | Hilltop Holdings Inc. | 14 988 | 5,39 | 572 | 21,96 | ||||
| 2025-05-15 | 13F | Parvin Asset Management, LLC | 0 | −100,00 | 0 | |||||
| 2025-08-12 | 13F | Jpmorgan Chase & Co | 3 859 | 36,55 | 147 | 58,06 | ||||
| 2025-07-22 | 13F | Kessler Investment Group, LLC | 7 | 0,00 | 0 | |||||
| 2025-08-08 | 13F | Cetera Investment Advisers | 49 871 | 3,68 | 1 904 | 19,99 | ||||
| 2025-08-04 | 13F | Spire Wealth Management | 180 | −79,82 | 7 | −79,31 | ||||
| 2025-08-12 | 13F | Global Retirement Partners, LLC | 1 096 | 0,00 | 42 | 2,50 | ||||
| 2025-07-11 | 13F | Farther Finance Advisors, LLC | 9 | 0,00 | 0 | |||||
| 2025-07-24 | 13F | JNBA Financial Advisors | 359 | 0,00 | 14 | 18,18 | ||||
| 2025-08-07 | 13F | Mosaic Financial Group, Llc | 0 | −100,00 | 0 | |||||
| 2025-08-04 | 13F | Arkadios Wealth Advisors | 7 297 | −10,40 | 279 | 3,73 | ||||
| 2025-07-10 | 13F | Stolper Co | 18 390 | 4,78 | 1 | |||||
| 2025-08-27 | NP | RYMSX - Guggenheim Multi-Hedge Strategies Fund Class P | 13 | −91,28 | 0 | −100,00 | ||||
| 2025-07-07 | 13F | Investors Research Corp | 250 | 10 | ||||||
| 2025-07-31 | 13F | Cambridge Investment Research Advisors, Inc. | 46 043 | −28,85 | 2 | −50,00 | ||||
| 2025-07-16 | 13F | Perigon Wealth Management, LLC | 6 826 | −11,42 | 261 | 2,36 | ||||
| 2025-07-17 | 13F | Janney Montgomery Scott LLC | 148 438 | 0,41 | 6 | 25,00 | ||||
| 2025-08-14 | 13F | Ameriprise Financial Inc | 434 074 | −2,22 | 16 576 | 13,19 | ||||
| 2025-08-14 | 13F | Great Valley Advisor Group, Inc. | 9 980 | 0,00 | 381 | 15,50 | ||||
| 2025-05-12 | 13F | Fmr Llc | 0 | −100,00 | 0 | |||||
| 2025-08-14 | 13F | UBS Group AG | 123 252 | 7,50 | 4 705 | 24,38 | ||||
| 2025-08-27 | NP | RYDEX VARIABLE TRUST - Multi-Hedge Strategies Fund Variable Annuity | 22 | −78,85 | 1 | −100,00 | ||||
| 2025-07-28 | 13F | BRYN MAWR TRUST Co | 2 150 | 0,00 | 82 | 17,14 | ||||
| 2025-08-12 | 13F | J.w. Cole Advisors, Inc. | 32 451 | 13,47 | 1 239 | 31,28 | ||||
| 2025-08-15 | 13F | Kestra Advisory Services, LLC | 21 646 | 3,90 | 826 | 20,23 | ||||
| 2025-05-16 | 13F | Arete Wealth Advisors, LLC | 0 | −100,00 | 0 | |||||
| 2025-07-18 | 13F | TruNorth Capital Management, LLC | 100 | 2,04 | 4 | 0,00 | ||||
| 2025-08-06 | 13F | Prospera Financial Services Inc | 14 685 | 0,44 | 561 | 16,18 | ||||
| 2025-08-14 | 13F | Balyasny Asset Management Llc | 37 096 | 1 416 | ||||||
| 2025-07-08 | 13F | Next Level Private LLC | 9 521 | 1,31 | 363 | 17,10 | ||||
| 2025-08-01 | 13F | Boyd Watterson Asset Management Llc/oh | 96 | 0,00 | 4 | 0,00 | ||||
| 2025-07-31 | 13F | Oppenheimer & Co Inc | 44 407 | 3,72 | 1 695 | 20,04 | ||||
| 2025-08-14 | 13F/A | Rockefeller Capital Management L.P. | 10 133 | 0,66 | 387 | 16,27 | ||||
| 2025-07-08 | 13F | Nbc Securities, Inc. | 16 431 | −0,02 | 1 | |||||
| 2025-08-05 | 13F | Huntington National Bank | 80 | 15,94 | ||||||
| 2025-07-18 | 13F | Truist Financial Corp | 32 373 | 8,09 | 1 236 | 25,00 | ||||
| 2025-08-19 | 13F | National Asset Management, Inc. | 9 834 | 15,68 | 375 | 20,97 | ||||
| 2025-08-06 | 13F | Wedbush Securities Inc | 220 815 | −8,97 | 8 | 0,00 | ||||
| 2025-08-04 | 13F | Bay Colony Advisory Group, Inc d/b/a Bay Colony Advisors | 8 221 | 2,57 | 314 | 16,79 | ||||
| 2025-08-14 | 13F | Jane Street Group, Llc | 10 777 | −48,48 | 411 | −40,43 | ||||
| 2025-08-14 | 13F | Polar Asset Management Partners Inc. | 14 730 | 1,47 | 562 | 17,57 | ||||
| 2025-07-14 | 13F | AdvisorNet Financial, Inc | 1 363 | 83,69 | 52 | 116,67 | ||||
| 2025-08-05 | 13F | Claro Advisors LLC | 8 594 | 1,17 | 328 | 17,14 | ||||
| 2025-08-12 | 13F | NFP Retirement, Inc. | 58 527 | −1,91 | 2 234 | 13,47 | ||||
| 2025-07-25 | 13F | Atria Wealth Solutions, Inc. | 12 482 | 477 | ||||||
| 2025-07-14 | 13F | Armstrong Advisory Group, Inc | 352 | 13 | ||||||
| 2025-07-18 | 13F | Trust Co Of Vermont | 1 500 | 0,00 | 57 | 16,33 | ||||
| 2025-08-01 | 13F | Envestnet Asset Management Inc | 27 410 | 2,53 | 1 046 | 18,73 | ||||
| 2025-07-29 | 13F | International Assets Investment Management, Llc | 13 652 | 2,32 | 521 | 18,41 | ||||
| 2025-08-07 | 13F | Readystate Asset Management Lp | 8 971 | 342 | ||||||
| 2025-08-13 | 13F | Northwestern Mutual Wealth Management Co | 7 210 | 11,80 | 275 | 29,72 | ||||
| 2025-07-25 | NP | FCEF - First Trust CEF Income Opportunity ETF This fund is a listed as child fund of First Trust Advisors Lp and if that institution has disclosed ownership in this security, then these positions will not be double counted when calculating total shares and total value | 35 204 | 10,38 | 1 284 | 10,32 | ||||
| 2025-07-14 | 13F | UMA Financial Services, Inc. | 307 | 0,00 | 12 | 10,00 | ||||
| 2025-08-08 | 13F | Kingsview Wealth Management, LLC | 24 453 | 0,00 | 933 | 15,76 | ||||
| 2025-08-12 | 13F | Walled Lake Planning & Wealth Management, Llc | 8 591 | 2,10 | 328 | 18,05 | ||||
| 2025-08-12 | 13F | Virtu Financial LLC | 0 | −100,00 | 0 | |||||
| 2025-07-21 | 13F | Future Financial Wealth Managment LLC | 14 000 | 0,00 | 534 | 15,84 | ||||
| 2025-07-09 | 13F | Mirador Capital Partners LP | 7 597 | 0,73 | 290 | 16,53 | ||||
| 2025-08-13 | 13F | First Trust Advisors Lp | 70 663 | −0,80 | 2 697 | 14,81 | ||||
| 2025-07-23 | 13F | Abel Hall, LLC | 13 000 | 496 | ||||||
| 2025-07-29 | 13F | Stephens Inc /ar/ | 16 485 | 3,13 | 629 | 19,35 | ||||
| 2025-08-19 | 13F | Newbridge Financial Services Group, Inc. | 68 399 | 2 611 | ||||||
| 2025-04-29 | 13F | Hm Payson & Co | 600 | 0,00 | 20 | −9,52 | ||||
| 2025-08-08 | 13F | Capital Investment Advisory Services, LLC | 6 447 | 6,00 | 246 | 23,00 | ||||
| 2025-06-27 | NP | Calamos ETF Trust - Calamos CEF Income & Arbitrage ETF | 7 812 | −34,79 | 261 | −42,38 | ||||
| 2025-08-14 | 13F | Monetary Management Group Inc | 445 | 0,00 | 17 | 14,29 | ||||
| 2025-08-13 | 13F | Level Four Advisory Services, Llc | 5 776 | −17,69 | 220 | −4,76 | ||||
| 2025-08-12 | 13F | Steward Partners Investment Advisory, Llc | 169 148 | −0,34 | 6 456 | 15,31 | ||||
| 2025-07-31 | 13F | Anchor Capital Management Group Inc | 18 000 | 0,00 | 687 | 15,85 | ||||
| 2025-08-13 | 13F | Invesco Ltd. | 432 215 | −12,41 | 16 498 | 1,34 | ||||
| 2025-07-16 | 13F | ORG Partners LLC | 1 033 | −26,42 | 39 | −17,02 | ||||
| 2025-07-28 | 13F | SFG Wealth Management, LLC. | 20 552 | 0,00 | 784 | 15,63 | ||||
| 2025-07-28 | 13F | Mission Hills Financial Advisory, LLC | 13 402 | 512 | ||||||
| 2025-07-24 | 13F | Aurora Private Wealth, Inc. | 8 808 | 1,46 | 0 | |||||
| 2025-08-14 | 13F | MGB Wealth Management, LLC | 0 | −100,00 | 0 | |||||
| 2025-09-09 | 13F | NWF Advisory Services Inc. | 76 735 | 2,31 | 2 929 | 18,35 | ||||
| 2025-08-12 | 13F | MAI Capital Management | 1 162 | 0,17 | 44 | 15,79 | ||||
| 2025-06-26 | NP | ATCAX - Anchor Risk Managed Credit Strategies Fund Advisor Class Shares | 18 000 | 0,00 | 656 | 0,00 | ||||
| 2025-07-25 | 13F | Apollon Wealth Management, LLC | 17 980 | 20,24 | 686 | 39,15 | ||||
| 2025-08-06 | 13F | New Millennium Group LLC | 1 | 0 | ||||||
| 2025-08-14 | 13F | Karpus Management, Inc. | 322 983 | 7,39 | 12 328 | 24,25 | ||||
| 2025-07-15 | 13F | Wealth Effects Llc | 14 685 | −14,42 | 561 | −1,06 | ||||
| 2025-08-14 | 13F | Raymond James Financial Inc | 1 045 902 | 2,38 | 39 922 | 18,46 | ||||
| 2025-08-14 | 13F | Herold Advisors, Inc. | 6 233 | 1,65 | 238 | 17,33 | ||||
| 2025-07-24 | 13F | Ronald Blue Trust, Inc. | 100 | 4 | ||||||
| 2025-08-14 | 13F | 1607 Capital Partners, LLC | 284 950 | −8,54 | 10 877 | 5,82 | ||||
| 2025-07-24 | 13F | Jfs Wealth Advisors, Llc | 383 | 0,00 | 15 | 16,67 | ||||
| 2025-08-07 | 13F | Vista Investment Partners Ii, Llc | 6 762 | 0,43 | 258 | 16,22 | ||||
| 2025-05-16 | 13F | Coordinated Financial Services, Inc./CO | 0 | −100,00 | 0 | |||||
| 2025-08-11 | 13F | Principal Securities, Inc. | 2 074 | 12,90 | 79 | 17,91 | ||||
| 2025-08-14 | 13F | Sunbelt Securities, Inc. | 11 435 | 97,16 | 418 | 118,85 | ||||
| 2025-08-07 | 13F | Allworth Financial LP | 7 | 16,67 | 0 | |||||
| 2025-08-08 | 13F | Pnc Financial Services Group, Inc. | 7 840 | −33,50 | 299 | −22,94 | ||||
| 2025-08-05 | 13F | Shaker Financial Services, LLC | 36 014 | 313,15 | 1 375 | 378,75 | ||||
| 2025-08-11 | 13F | Tidemark, LLC | 42 | 0,00 | 2 | 0,00 | ||||
| 2025-08-22 | NP | Cornerstone Strategic Value Fund Inc | 59 383 | 5,85 | 2 267 | 22,49 | ||||
| 2025-08-05 | 13F | Scarborough Advisors, LLC | 259 | 10 | ||||||
| 2025-08-11 | 13F | Elequin Capital Lp | 13 024 | 2 059,87 | 497 | 2 515,79 | ||||
| 2025-08-04 | 13F | Pensionmark Financial Group, Llc | 5 367 | 205 | ||||||
| 2025-07-28 | NP | PCEF - Invesco CEF Income Composite ETF This fund is a listed as child fund of Invesco Ltd. and if that institution has disclosed ownership in this security, then these positions will not be double counted when calculating total shares and total value | 418 145 | −5,67 | 15 246 | −5,70 | ||||
| 2025-07-09 | 13F | David J Yvars Group | 28 045 | 0,57 | 1 071 | 16,03 | ||||
| 2025-08-14 | 13F | GWM Advisors LLC | 820 | 1,61 | 31 | 19,23 | ||||
| 2025-08-12 | 13F | Proequities, Inc. | 0 | 0 | ||||||
| 2025-08-06 | 13F | Commonwealth Equity Services, Llc | 39 897 | −1,40 | 2 | 0,00 | ||||
| 2025-08-13 | 13F | EverSource Wealth Advisors, LLC | 710 | 0,00 | 27 | 17,39 | ||||
| 2025-08-12 | 13F | BlackRock, Inc. | 0 | −100,00 | 0 | |||||
| 2025-08-12 | 13F | Park Square Financial Group, LLC | 44 | 0,00 | 2 | 0,00 | ||||
| 2025-05-06 | 13F | Venturi Wealth Management, LLC | 0 | −100,00 | 0 | |||||
| 2025-08-04 | 13F | Wolverine Asset Management Llc | 13 153 | 502 | ||||||
| 2025-08-13 | 13F | Smith, Moore & Co. | 15 173 | 0,33 | 579 | 16,27 | ||||
| 2025-08-14 | 13F | Wells Fargo & Company/mn | 67 218 | 242,04 | 2 566 | 295,83 | ||||
| 2025-04-21 | 13F | Nelson, Van Denburg & Campbell Wealth Management Group, LLC | 0 | −100,00 | 0 | |||||
| 2025-08-13 | 13F | Keystone Financial Group | 6 734 | 0,00 | 257 | 15,77 | ||||
| 2025-08-04 | 13F | Daymark Wealth Partners, Llc | 5 975 | 228 | ||||||
| 2025-08-14 | 13F | Atomi Financial Group, Inc. | 11 765 | −9,33 | 449 | 4,91 | ||||
| 2025-08-22 | NP | Cornerstone Total Return Fund Inc | 28 142 | 0,00 | 1 074 | 15,73 | ||||
| 2025-08-08 | 13F | Cornerstone Advisors, LLC | 87 525 | 3,90 | 3 341 | 20,19 | ||||
| 2025-08-08 | 13F | Symphony Financial Services, Inc. | 6 311 | −0,71 | 241 | 14,83 | ||||
| 2025-07-01 | 13F | Harbor Investment Advisory, Llc | 3 163 | −9,40 | 121 | 4,35 | ||||
| 2025-07-30 | 13F | D.a. Davidson & Co. | 15 340 | 23,35 | 586 | 42,68 | ||||
| 2025-07-24 | 13F | Us Bancorp \de\ | 0 | −100,00 | 0 | |||||
| 2025-08-14 | 13F | Wealth Preservation Advisors, LLC | 0 | −100,00 | 0 | |||||
| 2025-07-28 | 13F | Mutual Advisors, LLC | 14 245 | 5,40 | 555 | 22,84 | ||||
| 2025-08-14 | 13F | Colony Group, LLC | 0 | −100,00 | 0 | |||||
| 2025-08-14 | 13F | Ambassador Advisors, LLC | 8 673 | 0,91 | 331 | 16,96 | ||||
| 2025-08-15 | 13F | Morgan Stanley | 1 281 194 | −1,47 | 48 903 | 14,00 | ||||
| 2025-08-14 | 13F | Bank Of America Corp /de/ | 192 302 | 1,32 | 7 340 | 17,23 | ||||
| 2025-07-28 | 13F | Harbour Investments, Inc. | 1 455 | 0,00 | 56 | 14,58 | ||||
| 2025-08-11 | 13F | HighTower Advisors, LLC | 35 413 | 1,49 | 1 352 | 17,38 | ||||
| 2025-08-12 | 13F | Boreal Capital Management LLC | 600 | 23 | ||||||
| 2025-08-14 | 13F | IHT Wealth Management, LLC | 0 | −100,00 | 0 | |||||
| 2025-08-15 | 13F | Captrust Financial Advisors | 5 856 | 224 | ||||||
| 2025-05-14 | 13F | Van Hulzen Asset Management, LLC | 0 | −100,00 | 0 | −100,00 | ||||
| 2025-08-14 | 13F | Mercer Global Advisors Inc /adv | 7 449 | 12,74 | 284 | 30,88 | ||||
| 2025-08-14 | 13F | Wiley Bros.-aintree Capital, Llc | 10 056 | 0,26 | 384 | 14,33 |