Grundläggande statistik
| Institutionella ägare | 104 total, 104 long only, 0 short only, 0 long/short - change of −4,59% MRQ |
| Genomsnittlig portföljallokering | 0.2391 % - change of −1,50% MRQ |
| Institutionella aktier (lång) | 3 964 121 (ex 13D/G) - change of −0,36MM shares −8,24% MRQ |
| Institutionellt värde (lång) | $ 132 385 USD ($1000) |
Institutionellt ägande och aktieägare
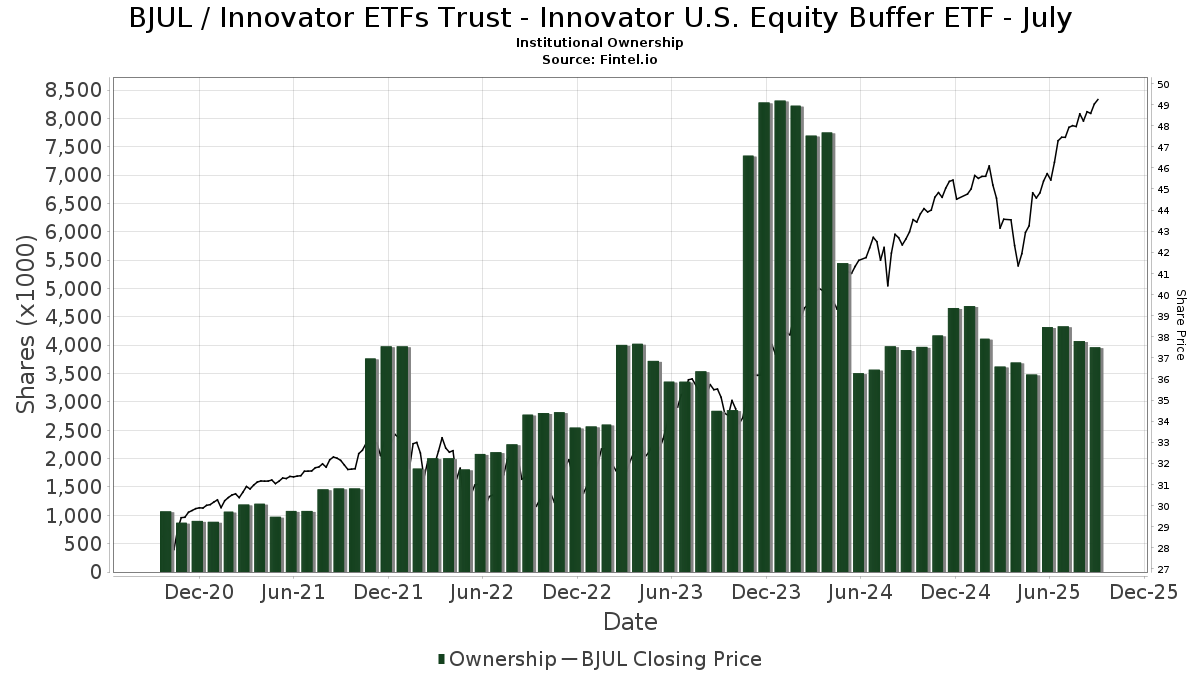
Innovator ETFs Trust - Innovator U.S. Equity Buffer ETF - July (US:BJUL) har 104 Institutionella ägare och aktieägare som har lämnat in 13D/G- eller 13F-formulär till Securities Exchange Commission (SEC). Dessa institut innehar totalt 3,964,121 aktier. Största aktieägare inkluderar Commonwealth Equity Services, Llc, Innovator ETFs Trust - Innovator Laddered Allocation Buffer ETF, Penserra Capital Management LLC, Integral Investment Advisors, Inc., Advisor Group Holdings, Inc., HighTower Advisors, LLC, Cerity Partners LLC, Rothschild Investment Llc, Cetera Investment Advisers, and Jane Street Group, Llc .
Innovator ETFs Trust - Innovator U.S. Equity Buffer ETF - July (BATS:BJUL) Institutionell ägarstruktur visar institutioners och fonders nuvarande positioner i företaget, samt de senaste förändringarna i positionernas storlek. Större aktieägare kan vara enskilda investerare, fonder, hedgefonder eller institutioner. Bilaga 13D visar att investeraren äger (eller ägde) mer än 5% av företaget och avser (eller avsåg) att aktivt eftersträva en förändring av affärsstrategin. Schedule 13G indikerar en passiv investering på över 5%.
The share price as of September 18, 2025 is 49,41 / share. Previously, on September 19, 2024, the share price was 43,43 / share. This represents an increase of 13,77% over that period.
Fondsentimentets poäng
Fondsentimentet poängen(fka Ägarackumulation-poäng) visar vilka aktier som är mest köpta av fonder. Det är resultatet av en sofistikerad kvantitativ flerfaktormodell som identifierar företag med de högsta nivåerna av institutionell ackumulering. Poängsättningsmodellen använder en kombination av den totala ökningen av redovisade ägare, förändringarna i portföljallokeringarna för dessa ägare och andra mått. Siffran sträcker sig från 0 till 100, där högre siffror indikerar en högre nivå av ackumulering i förhållande till sina konkurrenter, och 50 är genomsnittet.
Uppdateringsfrekvens: Dagligen
Se Ownership Explorer, som innehåller en lista över de högst rankade företagen.
Institutionell sälj/köp-kvot
Förutom att rapportera vanliga eget kapital- och skuldemissioner måste institutioner med mer än 100MM tillgångar under förvaltning också avslöja sina innehav av sälj- och köpoptioner. Eftersom säljoptioner i allmänhet indikerar ett negativt sentiment och köpoptioner indikerar ett positivt sentiment, kan vi få en uppfattning om det övergripande institutionella sentimentet genom att plotta förhållandet mellan säljoptioner och köpoptioner. Diagrammet till höger visar det historiska förhållandet mellan sälj- och köpoptioner för detta instrument.
Genom att använda sälj/köp-kvoten som en indikator på aktieägarnas sentiment undviker man en av de största bristerna med att använda det totala institutionella ägandet, nämligen att en betydande del av de förvaltade tillgångarna investeras passivt för att följa index. Passivt förvaltade fonder köper vanligtvis inte optioner, så indikatorn för sälj/köp-kvoten ger en bättre bild av stämningen i aktivt förvaltade fonder.
13F- och NPORT-arkiveringar
Detaljer om 13F-arkiveringar är gratis. Detaljer om NP-arkiveringar kräver ett premiummedlemskap. Gröna rader indikerar nya positioner. Röda rader indikerar stängda positioner. Klicka på länk symbolen för att se hela transaktionshistoriken.
Uppgradera
för att låsa upp premiumdata och exportera till Excel ![]() .
.
| Fil Datum | Källa | Investerare | Typ | Genomsnittligt pris (beräknat) |
Aktier | Δ Aktier (%) |
Rapporterat värde (1000 USD) |
Δ Värde (%) |
Portföljallokering (%) |
|
|---|---|---|---|---|---|---|---|---|---|---|
| 2025-04-18 | 13F | Global Trust Asset Management, LLC | 0 | −100,00 | 0 | |||||
| 2025-07-28 | 13F | WealthPLAN Partners, LLC | 0 | −100,00 | 0 | |||||
| 2025-08-14 | 13F | Citadel Advisors Llc | 20 598 | 971 | ||||||
| 2025-07-14 | 13F | Buska Wealth Management, LLC | 6 039 | −20,05 | 285 | −12,88 | ||||
| 2025-07-22 | 13F | Siligmueller & Norvid Wealth Advisors LLC | 10 149 | 0,00 | 482 | 9,82 | ||||
| 2025-07-30 | 13F | Brookstone Capital Management | 7 608 | −15,19 | 359 | −7,49 | ||||
| 2025-05-05 | 13F | PCA Investment Advisory Services Inc. | 0 | −100,00 | 0 | |||||
| 2025-07-14 | 13F | CRA Financial Services, LLC | 10 215 | 35,30 | 481 | 48,00 | ||||
| 2025-08-13 | 13F | EverSource Wealth Advisors, LLC | 7 225 | −1,65 | 341 | 7,26 | ||||
| 2025-07-21 | 13F | Seros Financial, LLC | 6 763 | 0,00 | 319 | 8,90 | ||||
| 2025-08-14 | 13F | CoreCap Advisors, LLC | 13 184 | −5,19 | 621 | 3,50 | ||||
| 2025-08-15 | 13F | Morgan Stanley | 2 057 | 0,00 | 97 | 9,09 | ||||
| 2025-08-12 | 13F | Jpmorgan Chase & Co | 0 | −100,00 | 0 | |||||
| 2025-07-07 | 13F | Schulz Wealth, LTD. | 5 125 | 0,00 | 242 | 9,05 | ||||
| 2025-08-12 | 13F | LPL Financial LLC | 39 654 | 39,61 | 1 869 | 52,37 | ||||
| 2025-07-23 | 13F | Motiv8 Investments LLC | 55 276 | 3,43 | 2 605 | 12,92 | ||||
| 2025-08-01 | 13F | FSA Advisors, Inc. | 39 212 | −4,48 | 1 848 | 4,29 | ||||
| 2025-04-02 | 13F | Marcum Wealth, LLC | 23 971 | −84,64 | 1 035 | −85,13 | ||||
| 2025-08-07 | 13F | Allworth Financial LP | 498 | 0,00 | 23 | 9,52 | ||||
| 2025-07-22 | 13F | Berkshire Money Management, Inc. | 37 381 | 1,71 | 1 762 | 11,03 | ||||
| 2025-07-14 | 13F | AdvisorNet Financial, Inc | 160 | 8 | ||||||
| 2025-07-29 | 13F | Wingate Wealth Advisors, Inc. | 7 690 | 0,00 | 362 | 9,04 | ||||
| 2025-07-31 | 13F | Whipplewood Advisors, LLC | 935 | 4,70 | 44 | 10,00 | ||||
| 2025-07-15 | 13F | Armis Advisers, LLC | 28 302 | 1,67 | 1 334 | 10,99 | ||||
| 2025-08-01 | 13F | Corrado Advisors, Llc | 7 670 | 361 | ||||||
| 2025-08-01 | 13F | Integral Investment Advisors, Inc. | 262 318 | −0,63 | 12 363 | 8,48 | ||||
| 2025-08-11 | 13F | Blue Bell Private Wealth Management, Llc | 52 472 | −0,41 | 2 473 | 8,75 | ||||
| 2025-07-22 | 13F | D.B. Root & Company, LLC | 5 892 | 3,46 | 278 | 13,06 | ||||
| 2025-08-12 | 13F | Change Path, LLC | 7 459 | −0,51 | 352 | 8,67 | ||||
| 2025-08-14 | 13F | Sunbelt Securities, Inc. | 2 815 | 39,70 | 125 | 43,68 | ||||
| 2025-08-11 | 13F | Rothschild Investment Llc | 94 600 | 5,35 | 4 458 | 14,99 | ||||
| 2025-08-12 | 13F | SRS Capital Advisors, Inc. | 11 503 | −9,73 | 542 | −1,45 | ||||
| 2025-08-11 | 13F | Bellwether Advisors, LLC | 75 522 | 0,00 | 3 559 | 9,17 | ||||
| 2025-05-09 | 13F | Atria Wealth Solutions, Inc. | 0 | −100,00 | 0 | |||||
| 2025-08-14 | 13F | Royal Bank Of Canada | 420 | 0,00 | 20 | 11,11 | ||||
| 2025-08-07 | 13F | PFG Advisors | 4 658 | −25,75 | 220 | −18,89 | ||||
| 2025-04-22 | 13F | Castleview Partners, Llc | 0 | −100,00 | 0 | |||||
| 2025-08-08 | 13F | Comprehensive Financial Planning, Inc./PA | 6 724 | 4,26 | 317 | 13,67 | ||||
| 2025-08-05 | 13F | Sigma Planning Corp | 13 644 | −15,21 | 643 | −7,35 | ||||
| 2025-08-14 | 13F | Mml Investors Services, Llc | 24 048 | −4,39 | 1 | 0,00 | ||||
| 2025-07-24 | 13F | Us Bancorp \de\ | 875 | 0,00 | 41 | 10,81 | ||||
| 2025-08-14 | 13F | Jane Street Group, Llc | 77 324 | 3 644 | ||||||
| 2025-07-22 | 13F | Beacon Financial Advisory LLC | 0 | −100,00 | 0 | |||||
| 2025-08-14 | 13F | Old Mission Capital Llc | 19 081 | 899 | ||||||
| 2025-05-09 | 13F | Goldman Sachs Group Inc | 0 | −100,00 | 0 | |||||
| 2025-08-14 | 13F | Snowden Capital Advisors LLC | 45 250 | −9,37 | 2 133 | −1,07 | ||||
| 2025-08-15 | 13F | Kestra Advisory Services, LLC | 53 379 | 62,31 | 2 516 | 77,24 | ||||
| 2025-07-03 | 13F | City Center Advisors, LLC | 11 456 | −6,40 | 540 | 2,08 | ||||
| 2025-08-04 | 13F | Spire Wealth Management | 32 387 | 0,01 | 1 526 | 9,16 | ||||
| 2025-08-06 | 13F | Penserra Capital Management LLC | 374 394 | −6,43 | 18 | 0,00 | ||||
| 2025-07-28 | 13F | Harbour Investments, Inc. | 12 762 | −7,54 | 601 | 1,01 | ||||
| 2025-08-12 | 13F | Proequities, Inc. | 0 | 0 | ||||||
| 2025-08-13 | 13F | Cresset Asset Management, LLC | 16 395 | 0,00 | 773 | 9,19 | ||||
| 2025-08-29 | 13F | Evolution Wealth Management Inc. | 2 930 | 138 | ||||||
| 2025-07-21 | 13F | DHJJ Financial Advisors, Ltd. | 21 368 | 5,75 | 1 007 | 15,48 | ||||
| 2025-07-22 | 13F | My Personal CFO, LLC | 60 420 | 4,14 | 2 848 | 13,65 | ||||
| 2025-08-06 | 13F | AE Wealth Management LLC | 3 759 | −5,98 | 177 | 2,91 | ||||
| 2025-08-14 | 13F | First Commonwealth Financial Corp /pa/ | 9 633 | −25,61 | 454 | −18,78 | ||||
| 2025-08-12 | 13F | Tradition Wealth Management, LLC | 5 690 | −5,81 | 268 | 3,08 | ||||
| 2025-08-14 | 13F | Raymond James Financial Inc | 42 375 | 21,51 | 1 997 | 32,69 | ||||
| 2025-07-21 | 13F | Triad Wealth Partners, LLC | 4 679 | 0,00 | 221 | 8,91 | ||||
| 2025-07-30 | 13F | IMG Wealth Management, Inc. | 0 | −100,00 | 0 | |||||
| 2025-08-14 | 13F/A | Barclays Plc | 2 457 | 1 548,99 | 0 | |||||
| 2025-05-09 | 13F | Evolution Wealth Advisors, LLC | 0 | −100,00 | 0 | |||||
| 2025-07-10 | 13F | Three Seasons Wealth, LLC | 5 420 | 0,00 | 255 | 8,97 | ||||
| 2025-08-13 | 13F | Beacon Pointe Advisors, LLC | 18 688 | 8,47 | 881 | 18,44 | ||||
| 2025-08-15 | 13F | Chapman Financial Group, Llc | 20 495 | −9,10 | 966 | −3,88 | ||||
| 2025-05-14 | 13F | Valtinson Bruner Financial Planning LLC | 0 | −100,00 | 0 | |||||
| 2025-08-06 | 13F | Commonwealth Equity Services, Llc | 587 144 | 4,15 | 28 | 12,50 | ||||
| 2025-08-14 | 13F | UBS Group AG | 8 371 | −2,29 | 395 | 6,78 | ||||
| 2025-07-31 | 13F | Orion Capital Management LLC | 3 000 | 0,00 | 141 | 9,30 | ||||
| 2025-08-14 | 13F | Financial Network Wealth Advisors LLC | 563 | 0,00 | 27 | 8,33 | ||||
| 2025-08-06 | 13F | Vantage Financial Partners, LLC | 7 489 | −3,89 | 353 | 4,76 | ||||
| 2025-07-17 | 13F | Janney Montgomery Scott LLC | 58 927 | 5,30 | 3 | 0,00 | ||||
| 2025-08-12 | 13F | Steward Partners Investment Advisory, Llc | 5 101 | 0,00 | 240 | 9,09 | ||||
| 2025-08-04 | 13F | Creative Financial Designs Inc /adv | 500 | 0,00 | 24 | 9,52 | ||||
| 2025-08-19 | 13F | National Asset Management, Inc. | 0 | −100,00 | 0 | |||||
| 2025-07-28 | 13F | RFG Advisory, LLC | 0 | −100,00 | 0 | |||||
| 2025-07-14 | 13F | Southland Equity Partners LLC | 6 522 | 0,00 | 307 | 9,25 | ||||
| 2025-07-24 | 13F | IFP Advisors, Inc | 3 028 | −6,43 | 143 | 2,16 | ||||
| 2025-08-08 | 13F | Larson Financial Group LLC | 461 | 0,00 | 22 | 10,53 | ||||
| 2025-08-11 | 13F | HighTower Advisors, LLC | 173 845 | −0,06 | 8 193 | 9,09 | ||||
| 2025-08-12 | 13F | Wood Tarver Financial Group, LLC | 878 | −10,95 | 0 | −100,00 | ||||
| 2025-08-13 | 13F | Cerity Partners LLC | 149 856 | 7,63 | 7 063 | 17,48 | ||||
| 2025-07-28 | 13F | WealthPlan Investment Management, LLC | 28 636 | −84,61 | 1 350 | −83,21 | ||||
| 2025-07-15 | 13F | BCS Wealth Management | 18 001 | −10,55 | 1 | |||||
| 2025-07-15 | 13F | Retirement Income Solutions, Inc | 5 368 | 0,00 | 253 | 9,09 | ||||
| 2025-08-08 | 13F | Cetera Investment Advisers | 82 097 | −6,74 | 3 869 | 1,82 | ||||
| 2025-07-31 | 13F | Cambridge Investment Research Advisors, Inc. | 52 719 | 6,27 | 2 | 0,00 | ||||
| 2025-07-16 | 13F | Kathmere Capital Management, LLC | 12 193 | −0,59 | 575 | 8,51 | ||||
| 2025-08-13 | 13F | BCJ Capital Management, LLC | 6 061 | −2,56 | 286 | 6,34 | ||||
| 2025-08-08 | 13F | Emerald Investment Partners, Llc | 478 | 0,00 | 23 | 10,00 | ||||
| 2025-07-10 | 13F | Wealth Enhancement Advisory Services, Llc | 26 604 | 1 263 | ||||||
| 2025-07-11 | 13F | Farther Finance Advisors, LLC | 11 065 | 0,00 | 521 | 9,00 | ||||
| 2025-07-10 | 13F | Secure Asset Management, LLC | 12 665 | −0,51 | 597 | 8,56 | ||||
| 2025-05-14 | 13F | Heritage Wealth Partners, LLC | 0 | −100,00 | 0 | |||||
| 2025-08-11 | 13F | Principal Securities, Inc. | 25 062 | −0,38 | 1 181 | 5,45 | ||||
| 2025-08-07 | 13F | Resources Investment Advisors, LLC. | 6 795 | −17,28 | 320 | −9,60 | ||||
| 2025-07-30 | 13F | Strategic Blueprint, LLC | 24 671 | −6,50 | 1 163 | 2,02 | ||||
| 2025-04-14 | 13F | Daymark Wealth Partners, Llc | 0 | −100,00 | 0 | |||||
| 2025-08-04 | 13F | 4J Wealth Management LLC | 5 750 | 0,00 | 271 | 8,87 | ||||
| 2025-06-24 | NP | Innovator ETFs Trust - Innovator Laddered Allocation Buffer ETF | 398 538 | 3,49 | 17 113 | −2,25 | ||||
| 2025-08-14 | 13F | Acas, Llc | 7 040 | 1,44 | 342 | 14,05 | ||||
| 2025-07-11 | 13F | Lantz Financial LLC | 37 134 | 0,20 | 1 750 | 9,38 | ||||
| 2025-07-28 | 13F | Cornerstone Wealth Group, LLC | 24 847 | 0,00 | 1 171 | 9,24 | ||||
| 2025-08-08 | 13F | Capital Investment Advisory Services, LLC | 950 | 0,00 | 45 | 7,32 | ||||
| 2025-08-12 | 13F | Archer Investment Corp | 248 | 0,00 | 12 | 10,00 | ||||
| 2025-08-13 | 13F | Wealthquest Corp | 44 157 | −12,25 | 2 081 | −4,19 | ||||
| 2025-07-14 | 13F | Sowell Financial Services LLC | 0 | −100,00 | 0 | |||||
| 2025-08-14 | 13F | Susquehanna International Group, Llp | 0 | −100,00 | 0 | |||||
| 2025-08-29 | 13F | Centaurus Financial, Inc. | 0 | −100,00 | 0 | |||||
| 2025-08-05 | 13F | BCGM Wealth Management, LLC | 21 452 | 0,00 | 1 011 | 9,18 | ||||
| 2025-05-14 | 13F | Delta Investment Management, LLC | 0 | −100,00 | 0 | |||||
| 2025-09-04 | 13F/A | Advisor Group Holdings, Inc. | 195 209 | 8,62 | 9 200 | 18,56 | ||||
| 2025-08-11 | 13F | Outlook Wealth Advisors, LLC | 11 957 | 0,00 | 564 | 9,11 | ||||
| 2025-08-13 | 13F | SageView Advisory Group, LLC | 14 147 | 680 | ||||||
| 2025-08-19 | 13F | Advisory Services Network, LLC | 12 417 | 65,14 | 595 | 83,33 | ||||
| 2025-08-14 | 13F | Glen Eagle Advisors, LLC | 2 385 | 0,00 | 112 | 9,80 | ||||
| 2025-08-01 | 13F | Envestnet Asset Management Inc | 47 514 | −15,63 | 2 239 | −7,90 | ||||
| 2025-08-15 | 13F | Captrust Financial Advisors | 0 | −100,00 | 0 | |||||
| 2025-07-18 | 13F | Truist Financial Corp | 0 | −100,00 | 0 | |||||
| 2025-07-24 | 13F | Blair William & Co/il | 27 916 | −1,50 | 1 316 | 7,52 | ||||
| 2025-08-01 | 13F | Gwn Securities Inc. | 6 240 | 9,26 | 294 | 19,51 | ||||
| 2025-07-29 | 13F | Stratos Wealth Advisors, LLC | 22 664 | 0,00 | 1 068 | 9,20 | ||||
| 2025-08-12 | 13F | O'shaughnessy Asset Management, Llc | 291 | 0,00 | 14 | 8,33 | ||||
| 2025-07-09 | 13F | Fragasso Group Inc. | 32 161 | 0,00 | 1 516 | 9,15 | ||||
| 2025-08-13 | 13F | Continuum Advisory, LLC | 0 | −100,00 | 0 |