Grundläggande statistik
| Institutionella ägare | 112 total, 112 long only, 0 short only, 0 long/short - change of 2,75% MRQ |
| Genomsnittlig portföljallokering | 0.2978 % - change of −5,83% MRQ |
| Institutionella aktier (lång) | 5 222 891 (ex 13D/G) - change of 0,28MM shares 5,61% MRQ |
| Institutionellt värde (lång) | $ 200 324 USD ($1000) |
Institutionellt ägande och aktieägare
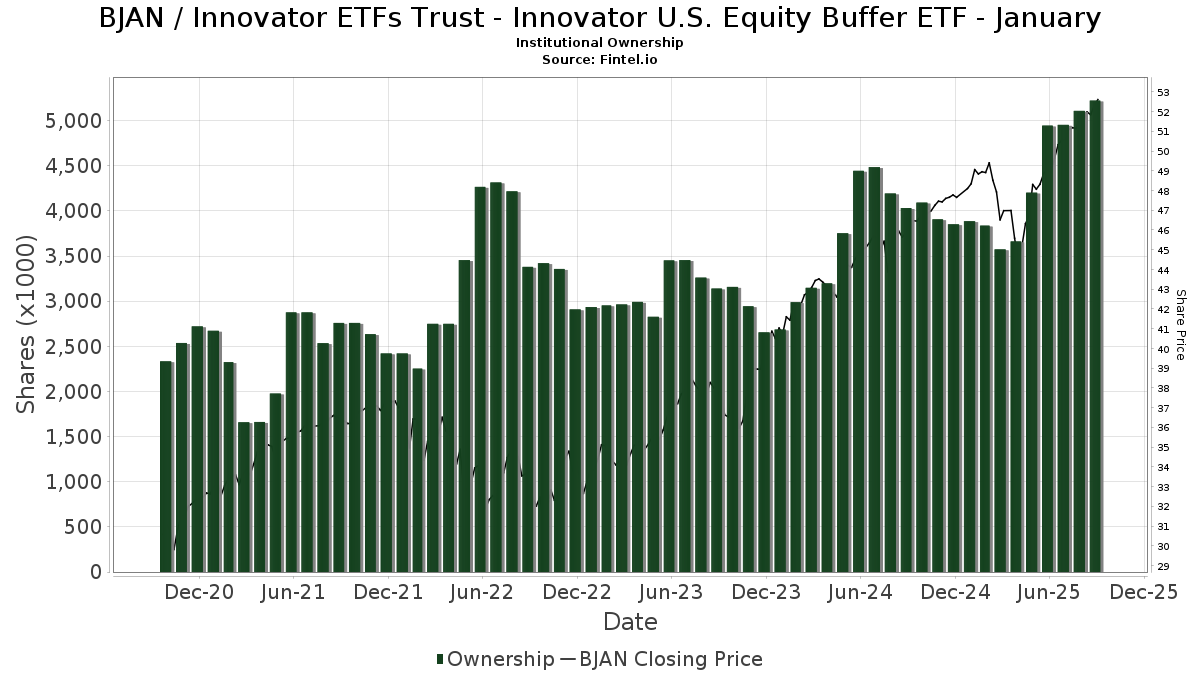
Innovator ETFs Trust - Innovator U.S. Equity Buffer ETF - January (US:BJAN) har 112 Institutionella ägare och aktieägare som har lämnat in 13D/G- eller 13F-formulär till Securities Exchange Commission (SEC). Dessa institut innehar totalt 5,222,891 aktier. Största aktieägare inkluderar Commonwealth Equity Services, Llc, Brookstone Capital Management, Innovator ETFs Trust - Innovator Laddered Allocation Buffer ETF, Penserra Capital Management LLC, Integral Investment Advisors, Inc., Wealth Enhancement Advisory Services, Llc, HighTower Advisors, LLC, Marcum Wealth, LLC, Cetera Investment Advisers, and U.S. Capital Wealth Advisors, LLC .
Innovator ETFs Trust - Innovator U.S. Equity Buffer ETF - January (BATS:BJAN) Institutionell ägarstruktur visar institutioners och fonders nuvarande positioner i företaget, samt de senaste förändringarna i positionernas storlek. Större aktieägare kan vara enskilda investerare, fonder, hedgefonder eller institutioner. Bilaga 13D visar att investeraren äger (eller ägde) mer än 5% av företaget och avser (eller avsåg) att aktivt eftersträva en förändring av affärsstrategin. Schedule 13G indikerar en passiv investering på över 5%.
The share price as of September 15, 2025 is 52,66 / share. Previously, on September 16, 2024, the share price was 46,16 / share. This represents an increase of 14,08% over that period.
Fondsentimentets poäng
Fondsentimentet poängen(fka Ägarackumulation-poäng) visar vilka aktier som är mest köpta av fonder. Det är resultatet av en sofistikerad kvantitativ flerfaktormodell som identifierar företag med de högsta nivåerna av institutionell ackumulering. Poängsättningsmodellen använder en kombination av den totala ökningen av redovisade ägare, förändringarna i portföljallokeringarna för dessa ägare och andra mått. Siffran sträcker sig från 0 till 100, där högre siffror indikerar en högre nivå av ackumulering i förhållande till sina konkurrenter, och 50 är genomsnittet.
Uppdateringsfrekvens: Dagligen
Se Ownership Explorer, som innehåller en lista över de högst rankade företagen.
Institutionell sälj/köp-kvot
Förutom att rapportera vanliga eget kapital- och skuldemissioner måste institutioner med mer än 100MM tillgångar under förvaltning också avslöja sina innehav av sälj- och köpoptioner. Eftersom säljoptioner i allmänhet indikerar ett negativt sentiment och köpoptioner indikerar ett positivt sentiment, kan vi få en uppfattning om det övergripande institutionella sentimentet genom att plotta förhållandet mellan säljoptioner och köpoptioner. Diagrammet till höger visar det historiska förhållandet mellan sälj- och köpoptioner för detta instrument.
Genom att använda sälj/köp-kvoten som en indikator på aktieägarnas sentiment undviker man en av de största bristerna med att använda det totala institutionella ägandet, nämligen att en betydande del av de förvaltade tillgångarna investeras passivt för att följa index. Passivt förvaltade fonder köper vanligtvis inte optioner, så indikatorn för sälj/köp-kvoten ger en bättre bild av stämningen i aktivt förvaltade fonder.
13F- och NPORT-arkiveringar
Detaljer om 13F-arkiveringar är gratis. Detaljer om NP-arkiveringar kräver ett premiummedlemskap. Gröna rader indikerar nya positioner. Röda rader indikerar stängda positioner. Klicka på länk symbolen för att se hela transaktionshistoriken.
Uppgradera
för att låsa upp premiumdata och exportera till Excel ![]() .
.
| Fil Datum | Källa | Investerare | Typ | Genomsnittligt pris (beräknat) |
Aktier | Δ Aktier (%) |
Rapporterat värde (1000 USD) |
Δ Värde (%) |
Portföljallokering (%) |
|
|---|---|---|---|---|---|---|---|---|---|---|
| 2025-07-07 | 13F | Schulz Wealth, LTD. | 32 130 | 0,00 | 1 614 | 7,68 | ||||
| 2025-08-08 | 13F | Larson Financial Group LLC | 68 | 0,00 | 3 | 0,00 | ||||
| 2025-08-06 | 13F | Penserra Capital Management LLC | 347 381 | −7,59 | 17 | 0,00 | ||||
| 2025-07-15 | 13F | Armis Advisers, LLC | 26 225 | 1,50 | 1 317 | 9,39 | ||||
| 2025-07-30 | 13F | Brookstone Capital Management | 512 656 | 5,76 | 25 748 | 13,90 | ||||
| 2025-08-14 | 13F | CoreCap Advisors, LLC | 28 937 | −3,15 | 1 453 | 4,31 | ||||
| 2025-07-28 | 13F | Mutual Advisors, LLC | 3 926 | 201 | ||||||
| 2025-08-13 | 13F | Continuum Advisory, LLC | 0 | −100,00 | 0 | |||||
| 2025-08-14 | 13F | Susquehanna International Group, Llp | 0 | −100,00 | 0 | |||||
| 2025-07-28 | 13F | Harbour Investments, Inc. | 10 265 | −0,11 | 516 | 7,52 | ||||
| 2025-07-23 | 13F | Motiv8 Investments LLC | 51 349 | 3,12 | 2 579 | 11,02 | ||||
| 2025-08-12 | 13F | LPL Financial LLC | 99 374 | 12,51 | 4 991 | 21,20 | ||||
| 2025-07-31 | 13F | Whipplewood Advisors, LLC | 1 180 | 138,38 | 59 | 7,27 | ||||
| 2025-04-02 | 13F | Marcum Wealth, LLC | 157 366 | 357,71 | 7 338 | 345,27 | ||||
| 2025-07-14 | 13F | AdvisorNet Financial, Inc | 9 775 | 1 727,10 | 491 | 1 941,67 | ||||
| 2025-08-08 | 13F | Collaborative Wealth Managment Inc. | 13 025 | 0,00 | 654 | 7,74 | ||||
| 2025-05-12 | 13F | Jpmorgan Chase & Co | 0 | −100,00 | 0 | |||||
| 2025-08-04 | 13F | Spire Wealth Management | 16 470 | −1,61 | 827 | 6,03 | ||||
| 2025-08-01 | 13F | Envestnet Asset Management Inc | 75 523 | −3,16 | 3 793 | 4,32 | ||||
| 2025-07-22 | 13F | Berkshire Money Management, Inc. | 23 582 | 0,00 | 1 184 | 7,73 | ||||
| 2025-08-01 | 13F | FSA Advisors, Inc. | 39 806 | 0,25 | 1 999 | 8,00 | ||||
| 2025-08-01 | 13F | Integral Investment Advisors, Inc. | 248 975 | 0,01 | 12 505 | 7,71 | ||||
| 2025-07-30 | 13F | Onyx Bridge Wealth Group LLC | 94 354 | −29,53 | 4 739 | −24,11 | ||||
| 2025-08-07 | 13F | Allworth Financial LP | 2 121 | 0,00 | 107 | 9,28 | ||||
| 2025-08-13 | 13F | BCJ Capital Management, LLC | 8 411 | −10,63 | 422 | −3,65 | ||||
| 2025-08-11 | 13F | Annis Gardner Whiting Capital Advisors, LLC | 8 200 | 0,00 | 412 | 7,59 | ||||
| 2025-08-11 | 13F | Blue Bell Private Wealth Management, Llc | 47 114 | −0,79 | 2 366 | 6,87 | ||||
| 2025-08-12 | 13F | Steward Partners Investment Advisory, Llc | 97 227 | 0,84 | 4 883 | 8,61 | ||||
| 2025-08-14 | 13F | Sunbelt Securities, Inc. | 18 865 | 905 | ||||||
| 2025-08-11 | 13F | Bellwether Advisors, LLC | 38 481 | 0,00 | 1 933 | 7,69 | ||||
| 2025-08-07 | 13F/A | Joseph Group Capital Management | 2 296 | 0,00 | 115 | 7,48 | ||||
| 2025-04-18 | 13F | Global Trust Asset Management, LLC | 0 | −100,00 | 0 | |||||
| 2025-07-29 | 13F | Chicago Partners Investment Group LLC | 12 186 | 0,00 | 623 | 9,31 | ||||
| 2025-08-14 | 13F | Old Mission Capital Llc | 15 828 | 30,15 | 795 | 40,04 | ||||
| 2025-08-12 | 13F | SRS Capital Advisors, Inc. | 11 943 | −0,46 | 600 | 7,16 | ||||
| 2025-08-14 | 13F | Snowden Capital Advisors LLC | 12 055 | 0,00 | 605 | 7,65 | ||||
| 2025-07-24 | 13F | Us Bancorp \de\ | 506 | 0,00 | 25 | 8,70 | ||||
| 2025-08-05 | 13F | Sigma Planning Corp | 10 565 | −7,23 | 531 | −0,19 | ||||
| 2025-08-14 | 13F | Citadel Advisors Llc | 16 769 | 842 | ||||||
| 2025-08-06 | 13F | Valtinson Bruner Financial Planning LLC | 12 944 | 5,61 | 650 | 13,84 | ||||
| 2025-08-15 | 13F | Kestra Advisory Services, LLC | 49 816 | −0,72 | 2 502 | 6,97 | ||||
| 2025-08-14 | 13F | Main Street Financial Solutions, LLC | 4 330 | 0,00 | 217 | 7,96 | ||||
| 2025-07-10 | 13F | Oliver Lagore Vanvalin Investment Group | 5 565 | 76,44 | 260 | 71,52 | ||||
| 2025-07-31 | 13F | Opes Wealth Management LLC | 56 408 | 2,57 | 2 833 | 10,49 | ||||
| 2025-07-03 | 13F | City Center Advisors, LLC | 10 558 | −6,43 | 530 | 0,76 | ||||
| 2025-08-12 | 13F | Proequities, Inc. | 0 | 0 | ||||||
| 2025-08-11 | 13F | Outlook Wealth Advisors, LLC | 5 269 | −13,44 | 265 | −6,71 | ||||
| 2025-08-12 | 13F | Waterloo Capital, L.P. | 8 015 | 0,00 | 403 | 7,77 | ||||
| 2025-08-13 | 13F | SageView Advisory Group, LLC | 4 475 | 0,00 | 230 | 10,10 | ||||
| 2025-04-16 | 13F | Seros Financial, LLC | 0 | −100,00 | 0 | |||||
| 2025-07-11 | 13F | Cypress Financial Planning Llc | 6 428 | −7,92 | 323 | −0,92 | ||||
| 2025-07-24 | 13F | IFP Advisors, Inc | 4 007 | 36,11 | 201 | 46,72 | ||||
| 2025-08-14 | 13F/A | Barclays Plc | 1 454 | 4 746,67 | 0 | |||||
| 2025-08-14 | 13F | Raymond James Financial Inc | 50 650 | −13,75 | 2 544 | −7,12 | ||||
| 2025-07-21 | 13F | DHJJ Financial Advisors, Ltd. | 63 844 | −0,83 | 3 207 | 6,80 | ||||
| 2025-07-14 | 13F | Lewis Asset Management, LLC | 6 154 | 1,27 | 309 | 9,19 | ||||
| 2025-08-06 | 13F | AE Wealth Management LLC | 1 866 | −27,02 | 94 | −21,85 | ||||
| 2025-07-17 | 13F | Janney Montgomery Scott LLC | 101 425 | 3,59 | 5 | 25,00 | ||||
| 2025-07-18 | 13F | Truist Financial Corp | 46 991 | 0,00 | 2 360 | 7,71 | ||||
| 2025-08-06 | 13F | Vantage Financial Partners, LLC | 6 274 | −2,56 | 315 | 5,00 | ||||
| 2025-07-22 | 13F | My Personal CFO, LLC | 46 463 | −0,07 | 2 334 | 7,61 | ||||
| 2025-08-13 | 13F | Beacon Pointe Advisors, LLC | 13 667 | −3,24 | 686 | 4,26 | ||||
| 2025-07-14 | 13F | Chris Bulman Inc | 9 487 | −0,45 | 476 | 7,21 | ||||
| 2025-08-15 | 13F | Chapman Financial Group, Llc | 1 000 | 0,00 | 50 | 6,38 | ||||
| 2025-08-06 | 13F | Commonwealth Equity Services, Llc | 654 965 | 19,04 | 33 | 28,00 | ||||
| 2025-07-16 | 13F | Crown Wealth Group, LLC | 89 145 | −0,49 | 4 477 | 7,18 | ||||
| 2025-07-31 | 13F | Orion Capital Management LLC | 9 960 | 0,00 | 500 | 7,76 | ||||
| 2025-08-13 | 13F | Cerity Partners LLC | 55 073 | 4,74 | 2 766 | 12,85 | ||||
| 2025-07-10 | 13F | Wealth Enhancement Advisory Services, Llc | 170 092 | 950,21 | 8 604 | 1 039,60 | ||||
| 2025-08-12 | 13F | Wood Tarver Financial Group, LLC | 4 026 | 0,00 | 0 | −100,00 | ||||
| 2025-07-11 | 13F | Lantz Financial LLC | 22 510 | −0,66 | 1 131 | 7,01 | ||||
| 2025-08-11 | 13F | HighTower Advisors, LLC | 164 560 | −0,27 | 8 265 | 7,41 | ||||
| 2025-08-13 | 13F | Townsquare Capital Llc | 11 978 | −27,89 | 602 | −22,35 | ||||
| 2025-04-11 | 13F | Kfg Wealth Management, Llc | 0 | −100,00 | 0 | |||||
| 2025-07-15 | 13F | BCS Wealth Management | 7 300 | −9,51 | 0 | |||||
| 2025-08-08 | 13F | Cetera Investment Advisers | 147 806 | −2,43 | 7 424 | 5,08 | ||||
| 2025-08-14 | 13F | Mml Investors Services, Llc | 27 091 | −2,45 | 1 | 0,00 | ||||
| 2025-08-19 | 13F | Cape Investment Advisory, Inc. | 100 | 0,00 | 5 | 25,00 | ||||
| 2025-07-10 | 13F | Focus Financial Network, Inc. | 15 638 | −0,18 | 785 | 7,53 | ||||
| 2025-07-15 | 13F | Retirement Income Solutions, Inc | 6 757 | 0,00 | 339 | 7,62 | ||||
| 2025-07-28 | 13F | RFG Advisory, LLC | 4 743 | −49,05 | 238 | −45,16 | ||||
| 2025-08-12 | 13F | Bedel Financial Consulting, Inc. | 6 420 | −3,23 | 322 | 4,55 | ||||
| 2025-08-29 | 13F | Centaurus Financial, Inc. | 7 511 | −70,50 | 0 | −100,00 | ||||
| 2025-07-16 | 13F | Kathmere Capital Management, LLC | 6 174 | −15,15 | 310 | −8,55 | ||||
| 2025-07-22 | 13F | Beacon Financial Advisory LLC | 6 367 | 0,00 | 320 | 7,77 | ||||
| 2025-07-31 | 13F | Pinnacle Wealth Management Group, Inc. | 6 150 | 0,00 | 309 | 7,69 | ||||
| 2025-08-06 | 13F | Maltin Wealth Management, Inc. | 83 628 | 12,38 | 4 200 | 21,04 | ||||
| 2025-08-15 | 13F | Morgan Stanley | 5 241 | 0,00 | 263 | 7,79 | ||||
| 2025-07-14 | 13F | U.S. Capital Wealth Advisors, LLC | 131 161 | 3,74 | 6 588 | 11,74 | ||||
| 2025-07-30 | 13F | Strategic Blueprint, LLC | 36 134 | 14,88 | 1 815 | 23,74 | ||||
| 2025-08-07 | 13F | Resources Investment Advisors, LLC. | 11 461 | −11,44 | 576 | −4,64 | ||||
| 2025-08-04 | 13F | Arkadios Wealth Advisors | 17 145 | 2,36 | 861 | 10,24 | ||||
| 2025-08-12 | 13F | Change Path, LLC | 8 584 | −0,54 | 431 | 7,21 | ||||
| 2025-08-04 | 13F | Pensionmark Financial Group, Llc | 4 050 | 203 | ||||||
| 2025-08-01 | 13F | PCA Investment Advisory Services Inc. | 10 211 | 0,00 | 513 | 7,56 | ||||
| 2025-08-13 | 13F | M Holdings Securities, Inc. | 13 404 | 31,00 | 1 | |||||
| 2025-07-21 | 13F | Ameritas Advisory Services, LLC | 1 130 | 57 | ||||||
| 2025-07-22 | 13F | Macroview Investment Management Llc | 27 250 | −0,67 | 1 369 | 6,96 | ||||
| 2025-08-05 | 13F | BCGM Wealth Management, LLC | 6 925 | 0,00 | 348 | 7,76 | ||||
| 2025-08-12 | 13F | Weaver Consulting Group | 19 248 | 303,95 | 967 | 335,14 | ||||
| 2025-06-24 | NP | Innovator ETFs Trust - Innovator Laddered Allocation Buffer ETF | 369 781 | 2,21 | 17 128 | −3,10 | ||||
| 2025-08-11 | 13F | Principal Securities, Inc. | 1 867 | 48,76 | 94 | 55,00 | ||||
| 2025-08-19 | 13F | Advisory Services Network, LLC | 16 050 | 0,00 | 820 | 9,49 | ||||
| 2025-07-07 | 13F | Dominguez Wealth Management Solutions, Inc. | 5 892 | 0,00 | 296 | 7,66 | ||||
| 2025-08-01 | 13F | Stuart Chaussee & Associates, Inc. | 113 130 | 0,83 | 5 682 | 8,58 | ||||
| 2025-07-08 | 13F | Gradient Investments LLC | 27 875 | 1 400 | ||||||
| 2025-07-10 | 13F | Secure Asset Management, LLC | 6 345 | 0,00 | 319 | 7,80 | ||||
| 2025-08-12 | 13F | Archer Investment Corp | 248 | 0,00 | 12 | 9,09 | ||||
| 2025-08-08 | 13F | Firestone Capital Management | 13 388 | −0,68 | 672 | 7,01 | ||||
| 2025-07-28 | 13F | Sagespring Wealth Partners, Llc | 5 690 | 0,00 | 286 | 7,55 | ||||
| 2025-05-16 | 13F | Coppell Advisory Solutions LLC | 0 | −100,00 | 0 | |||||
| 2025-08-15 | 13F | Captrust Financial Advisors | 11 061 | 0,00 | 556 | 7,77 | ||||
| 2025-07-29 | 13F | Stratos Wealth Advisors, LLC | 13 566 | 0,00 | 681 | 7,75 | ||||
| 2025-05-07 | 13F | First Heartland Consultants, Inc. | 0 | −100,00 | 0 | |||||
| 2025-07-22 | 13F | Diligent Investors, LLC | 6 146 | 0,00 | 309 | 7,69 | ||||
| 2025-08-01 | 13F | Gwn Securities Inc. | 4 525 | −88,31 | 228 | −87,80 | ||||
| 2025-07-14 | 13F | CRA Financial Services, LLC | 9 949 | −5,10 | 500 | 2,25 | ||||
| 2025-08-12 | 13F | O'shaughnessy Asset Management, Llc | 1 913 | −36,55 | 96 | −31,43 | ||||
| 2025-07-31 | 13F | Cambridge Investment Research Advisors, Inc. | 30 556 | −4,55 | 2 | 0,00 | ||||
| 2025-08-14 | 13F | First Commonwealth Financial Corp /pa/ | 42 694 | −0,33 | 2 144 | 7,36 | ||||
| 2025-09-04 | 13F/A | Advisor Group Holdings, Inc. | 130 253 | 16,16 | 6 541 | 25,11 |