Grundläggande statistik
| Institutionella ägare | 125 total, 122 long only, 0 short only, 3 long/short - change of −1,57% MRQ |
| Genomsnittlig portföljallokering | 0.2899 % - change of 63,07% MRQ |
| Institutionella aktier (lång) | 3 025 016 (ex 13D/G) - change of −0,16MM shares −4,89% MRQ |
| Institutionellt värde (lång) | $ 223 809 USD ($1000) |
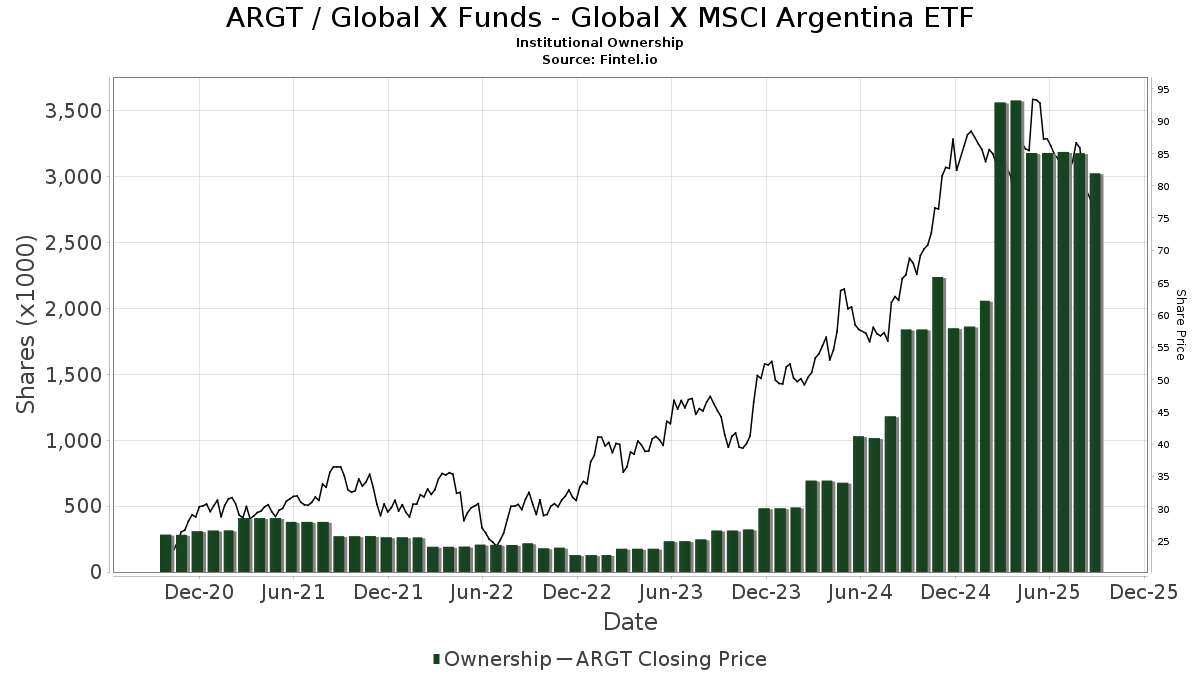
Institutionellt ägande och aktieägare
Global X Funds - Global X MSCI Argentina ETF (US:ARGT) har 125 Institutionella ägare och aktieägare som har lämnat in 13D/G- eller 13F-formulär till Securities Exchange Commission (SEC). Dessa institut innehar totalt 3,025,016 aktier. Största aktieägare inkluderar Bank Julius Baer & Co. Ltd, Zurich, Duquesne Family Office LLC, Marshall Wace, Llp, Breakout Capital Partners, LP, LPL Financial LLC, Morgan Stanley, Bank Of America Corp /de/, Susquehanna International Group, Llp, Activest Wealth Management, and Moran Wealth Management, LLC .
Global X Funds - Global X MSCI Argentina ETF (ARCA:ARGT) Institutionell ägarstruktur visar institutioners och fonders nuvarande positioner i företaget, samt de senaste förändringarna i positionernas storlek. Större aktieägare kan vara enskilda investerare, fonder, hedgefonder eller institutioner. Bilaga 13D visar att investeraren äger (eller ägde) mer än 5% av företaget och avser (eller avsåg) att aktivt eftersträva en förändring av affärsstrategin. Schedule 13G indikerar en passiv investering på över 5%.
The share price as of September 8, 2025 is 71,38 / share. Previously, on September 9, 2024, the share price was 65,69 / share. This represents an increase of 8,66% over that period.
Fondsentimentets poäng
Fondsentimentet poängen(fka Ägarackumulation-poäng) visar vilka aktier som är mest köpta av fonder. Det är resultatet av en sofistikerad kvantitativ flerfaktormodell som identifierar företag med de högsta nivåerna av institutionell ackumulering. Poängsättningsmodellen använder en kombination av den totala ökningen av redovisade ägare, förändringarna i portföljallokeringarna för dessa ägare och andra mått. Siffran sträcker sig från 0 till 100, där högre siffror indikerar en högre nivå av ackumulering i förhållande till sina konkurrenter, och 50 är genomsnittet.
Uppdateringsfrekvens: Dagligen
Se Ownership Explorer, som innehåller en lista över de högst rankade företagen.
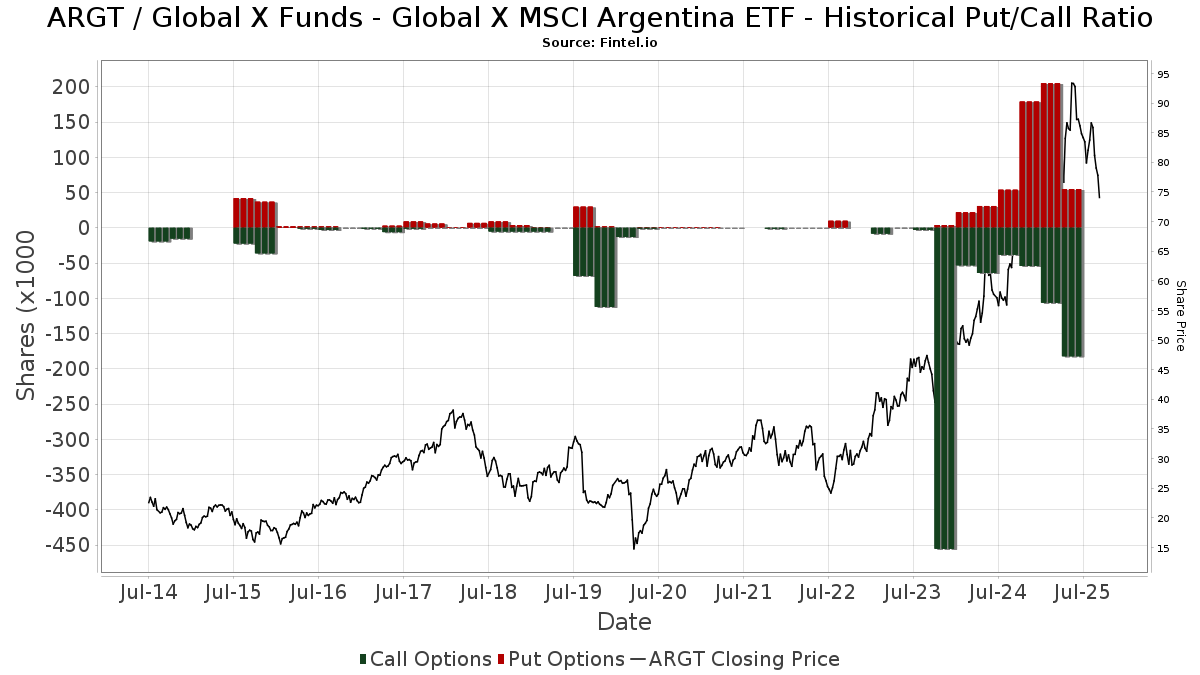
Institutionell sälj/köp-kvot
Förutom att rapportera vanliga eget kapital- och skuldemissioner måste institutioner med mer än 100MM tillgångar under förvaltning också avslöja sina innehav av sälj- och köpoptioner. Eftersom säljoptioner i allmänhet indikerar ett negativt sentiment och köpoptioner indikerar ett positivt sentiment, kan vi få en uppfattning om det övergripande institutionella sentimentet genom att plotta förhållandet mellan säljoptioner och köpoptioner. Diagrammet till höger visar det historiska förhållandet mellan sälj- och köpoptioner för detta instrument.
Genom att använda sälj/köp-kvoten som en indikator på aktieägarnas sentiment undviker man en av de största bristerna med att använda det totala institutionella ägandet, nämligen att en betydande del av de förvaltade tillgångarna investeras passivt för att följa index. Passivt förvaltade fonder köper vanligtvis inte optioner, så indikatorn för sälj/köp-kvoten ger en bättre bild av stämningen i aktivt förvaltade fonder.
13F- och NPORT-arkiveringar
Detaljer om 13F-arkiveringar är gratis. Detaljer om NP-arkiveringar kräver ett premiummedlemskap. Gröna rader indikerar nya positioner. Röda rader indikerar stängda positioner. Klicka på länk symbolen för att se hela transaktionshistoriken.
Uppgradera
för att låsa upp premiumdata och exportera till Excel ![]() .
.
| Fil Datum | Källa | Investerare | Typ | Genomsnittligt pris (beräknat) |
Aktier | Δ Aktier (%) |
Rapporterat värde (1000 USD) |
Δ Värde (%) |
Portföljallokering (%) |
|
|---|---|---|---|---|---|---|---|---|---|---|
| 2025-07-31 | 13F | Leavell Investment Management, Inc. | 4 361 | 370 | ||||||
| 2025-08-08 | 13F | Pnc Financial Services Group, Inc. | 200 | −74,03 | 17 | −5,88 | ||||
| 2025-08-14 | 13F | Qube Research & Technologies Ltd | 63 461 | 95,14 | 5 377 | 104,76 | ||||
| 2025-08-14 | 13F | Millennium Management Llc | 3 732 | −78,50 | 316 | −77,46 | ||||
| 2025-08-19 | 13F | Advisory Services Network, LLC | 3 450 | 33,46 | 285 | 37,02 | ||||
| 2025-07-29 | 13F | Activest Wealth Management | 96 240 | 1,13 | 8 154 | 6,09 | ||||
| 2025-08-15 | 13F | Duquesne Family Office LLC | 267 700 | −39,68 | 23 | −37,14 | ||||
| 2025-07-29 | 13F | Stratos Wealth Partners, LTD. | 2 491 | 0,00 | 211 | 4,98 | ||||
| 2025-05-12 | 13F | Citigroup Inc | 0 | −100,00 | 0 | |||||
| 2025-08-14 | 13F | LMR Partners LLP | 0 | −100,00 | 0 | |||||
| 2025-07-28 | 13F | Moran Wealth Management, LLC | 82 007 | 2,06 | 6 948 | 7,07 | ||||
| 2025-08-11 | 13F | Private Advisor Group, LLC | 29 330 | 18,92 | 2 485 | 24,75 | ||||
| 2025-08-12 | 13F | Jpmorgan Chase & Co | 55 419 | 39,99 | 4 696 | 46,86 | ||||
| 2025-05-12 | 13F | Founders Financial Securities Llc | 0 | −100,00 | 0 | |||||
| 2025-08-18 | 13F | Wolverine Trading, Llc | Call | 0 | −100,00 | 0 | ||||
| 2025-07-30 | 13F | Loring Wolcott & Coolidge Fiduciary Advisors Llp/ma | 4 645 | 394 | ||||||
| 2025-08-14 | 13F | Kite Lake Capital Management (uk) Llp | 40 000 | 0,00 | 3 389 | 4,92 | ||||
| 2025-08-14 | 13F | Barometer Capital Management Inc. | 5 300 | 253,33 | 449 | 271,07 | ||||
| 2025-08-04 | 13F | Bay Colony Advisory Group, Inc d/b/a Bay Colony Advisors | 0 | −100,00 | 0 | −100,00 | ||||
| 2025-04-30 | 13F | BCJ Capital Management, LLC | 0 | −100,00 | 0 | |||||
| 2025-07-30 | 13F | Cavalier Investments, LLC | 22 781 | −1,98 | 1 930 | 2,82 | ||||
| 2025-07-31 | 13F | Cambridge Investment Research Advisors, Inc. | 18 799 | 34,17 | 2 | 0,00 | ||||
| 2025-07-10 | 13F | Contravisory Investment Management, Inc. | 5 697 | 483 | ||||||
| 2025-08-14 | 13F | Intrepid Family Office Llc | 15 000 | 50,00 | 1 271 | 57,37 | ||||
| 2025-08-14 | 13F | Ameriprise Financial Inc | 40 723 | 1,72 | 3 450 | 6,71 | ||||
| 2025-05-14 | 13F | Absolute Gestao de Investimentos Ltda. | 0 | −100,00 | 0 | |||||
| 2025-08-15 | 13F | Harvest Fund Management Co., Ltd | 0 | −100,00 | 0 | |||||
| 2025-07-15 | 13F | SJS Investment Consulting Inc. | 21 | −12,50 | 2 | 0,00 | ||||
| 2025-08-15 | 13F | Tower Research Capital LLC (TRC) | 621 | 918,03 | 53 | 2 500,00 | ||||
| 2025-08-14 | 13F | Royal Bank Of Canada | 19 753 | 29,78 | 1 673 | 36,13 | ||||
| 2025-05-13 | 13F | Waratah Capital Advisors Ltd. | 0 | −100,00 | 0 | |||||
| 2025-05-14 | 13F | CI Private Wealth, LLC | 0 | −100,00 | 0 | |||||
| 2025-08-19 | 13F | National Asset Management, Inc. | 3 085 | 261 | ||||||
| 2025-08-05 | 13F | Carolinas Wealth Consulting Llc | 0 | −100,00 | 0 | −100,00 | ||||
| 2025-07-11 | 13F | Grove Bank & Trust | 25 | 2 | ||||||
| 2025-07-29 | 13F | Primoris Wealth Advisors, Llc | 0 | −100,00 | 0 | |||||
| 2025-08-05 | 13F | Simplex Trading, Llc | 0 | −100,00 | 0 | |||||
| 2025-08-06 | 13F | Commonwealth Equity Services, Llc | 13 078 | 18,28 | 1 | |||||
| 2025-08-13 | 13F | Berbice Capital Management LLC | 300 | 0,00 | 25 | 4,17 | ||||
| 2025-08-05 | 13F | Bank Of Montreal /can/ | 383 | −64,00 | 33 | −62,35 | ||||
| 2025-07-10 | 13F | Wealth Enhancement Advisory Services, Llc | 3 652 | −20,87 | 310 | −16,67 | ||||
| 2025-08-06 | 13F | Csenge Advisory Group | 20 802 | 0,35 | 1 877 | 5,57 | ||||
| 2025-08-11 | 13F | HighTower Advisors, LLC | 7 560 | −29,12 | 641 | −25,67 | ||||
| 2025-07-22 | 13F | DAVENPORT & Co LLC | 3 667 | 6,63 | 311 | 11,91 | ||||
| 2025-07-22 | 13F | Kercheville Advisors, LLC | 4 000 | −42,86 | 339 | −40,18 | ||||
| 2025-08-01 | 13F | Belvedere Trading LLC | 21 033 | 2,46 | 1 782 | 7,48 | ||||
| 2025-08-01 | 13F | Belvedere Trading LLC | Call | 15 800 | 295,00 | 1 339 | 314,24 | |||
| 2025-05-07 | 13F | Chandler Asset Management, Inc. | 0 | −100,00 | 0 | |||||
| 2025-08-01 | 13F | Belvedere Trading LLC | Put | 13 000 | 2 066,67 | 1 101 | 2 193,75 | |||
| 2025-08-14 | 13F | Two Sigma Securities, Llc | 7 131 | 604 | ||||||
| 2025-07-31 | 13F | Glass Jacobson Investment Advisors llc | 0 | −100,00 | 0 | |||||
| 2025-08-11 | 13F | TD Waterhouse Canada Inc. | 303 | −96,12 | 25 | −96,07 | ||||
| 2025-08-05 | 13F | Verity Asset Management, Inc. | 0 | −100,00 | 0 | |||||
| 2025-08-14 | 13F | Bank Of America Corp /de/ | 151 933 | 0,60 | 12 873 | 5,53 | ||||
| 2025-08-14 | 13F/A | Bank Julius Baer & Co. Ltd, Zurich | 284 421 | 13,57 | 24 099 | 5,41 | ||||
| 2025-07-29 | 13F | Fundamentun, Llc | 39 434 | 38,59 | 3 341 | 45,39 | ||||
| 2025-08-14 | 13F | DZ BANK AG Deutsche Zentral Genossenschafts Bank, Frankfurt am Main | 5 900 | 0,00 | 500 | 4,83 | ||||
| 2025-05-15 | 13F | Integrated Wealth Concepts LLC | 0 | −100,00 | 0 | |||||
| 2025-08-13 | 13F | Basso Capital Management, L.p. | 25 | −99,43 | 2 | −99,43 | ||||
| 2025-07-28 | 13F | Harbour Investments, Inc. | 50 | 0,00 | 4 | 0,00 | ||||
| 2025-08-14 | 13F | Schonfeld Strategic Advisors LLC | 0 | −100,00 | 0 | |||||
| 2025-08-13 | 13F | Coco Enterprises, LLC | 20 102 | 11,57 | 1 703 | 34,52 | ||||
| 2025-08-14 | 13F | Hrt Financial Lp | 7 501 | 35,06 | 1 | |||||
| 2025-07-28 | NP | AGOX - Adaptive Growth Opportunities ETF | 22 741 | −3,07 | 2 052 | 5,61 | ||||
| 2025-08-08 | 13F | Smithfield Trust Co | 237 | 0,00 | 0 | |||||
| 2025-03-25 | NP | FEDERATED CORE TRUST - Emerging Markets Core Fund This fund is a listed as child fund of Federated Hermes, Inc. and if that institution has disclosed ownership in this security, then these positions will not be double counted when calculating total shares and total value | 12 524 | 1 083 | ||||||
| 2025-08-12 | 13F | Proequities, Inc. | 0 | 0 | ||||||
| 2025-08-08 | 13F | Cetera Investment Advisers | 7 366 | −29,44 | 624 | −25,98 | ||||
| 2025-07-24 | 13F | Capital Advisors, Ltd. LLC | 581 | 0,00 | 0 | |||||
| 2025-08-14 | 13F | Banco BTG Pactual S.A. | 0 | −100,00 | 0 | |||||
| 2025-07-07 | 13F | Roxbury Financial LLC | 35 | 0,00 | 3 | 0,00 | ||||
| 2025-07-28 | 13F | Copia Wealth Management | 0 | −100,00 | 0 | |||||
| 2025-08-14 | 13F | FIL Ltd | 612 | 4,79 | 53 | 10,64 | ||||
| 2025-08-06 | 13F | AE Wealth Management LLC | 171 | 14 | ||||||
| 2025-08-14 | 13F | Stifel Financial Corp | 15 059 | −0,49 | 1 276 | 4,34 | ||||
| 2025-08-14 | 13F | Militia Capital Partners, LP | 0 | −100,00 | 0 | |||||
| 2025-08-01 | 13F | Envestnet Asset Management Inc | 0 | −100,00 | 0 | |||||
| 2025-08-14 | 13F | Gordian Capital Singapore Pte Ltd | 1 900 | −57,78 | 161 | −57,22 | ||||
| 2025-08-12 | 13F | Trexquant Investment LP | 2 838 | −7,32 | 240 | −2,83 | ||||
| 2025-07-24 | 13F | Blair William & Co/il | 25 | 0,00 | 2 | 0,00 | ||||
| 2025-08-12 | 13F | Global Retirement Partners, LLC | 71 | 0,00 | 6 | 20,00 | ||||
| 2025-08-13 | 13F | Global Endowment Management, LP | 12 000 | 0,00 | 1 017 | 4,85 | ||||
| 2025-08-18 | 13F | Geneos Wealth Management Inc. | 485 | −95,65 | 41 | −95,45 | ||||
| 2025-05-15 | 13F | Hilltop Holdings Inc. | 0 | −100,00 | 0 | |||||
| 2025-05-15 | 13F | Southpoint Capital Advisors LP | 0 | −100,00 | 0 | |||||
| 2025-07-07 | 13F | Park Edge Advisors, LLC | 6 844 | 21,09 | 580 | 26,97 | ||||
| 2025-07-16 | 13F | ORG Partners LLC | 20 | 0,00 | 2 | 0,00 | ||||
| 2025-08-14 | 13F | D. E. Shaw & Co., Inc. | 55 854 | 42,49 | 4 733 | 49,46 | ||||
| 2025-08-13 | 13F | Renaissance Technologies Llc | 17 239 | 1 461 | ||||||
| 2025-08-18 | 13F/A | National Bank Of Canada /fi/ | 210 | 2 000,00 | 18 | |||||
| 2025-04-17 | 13F | Good Life Advisors, LLC | 0 | −100,00 | 0 | |||||
| 2025-08-08 | 13F | Itau Unibanco Holding S.A. | 16 282 | 1 380 | ||||||
| 2025-08-14 | 13F | Private Wealth Advisors, LLC | 26 581 | 2 252 | ||||||
| 2025-08-14 | 13F | UBS Group AG | 7 094 | −64,71 | 601 | −62,97 | ||||
| 2025-07-24 | 13F | Us Bancorp \de\ | 5 590 | 0,00 | 474 | 4,88 | ||||
| 2025-08-06 | 13F | Prospera Financial Services Inc | 0 | −100,00 | 0 | −100,00 | ||||
| 2025-08-08 | 13F | Gts Securities Llc | 2 955 | 250 | ||||||
| 2025-08-12 | 13F | LPL Financial LLC | 171 520 | 1,11 | 14 533 | 6,07 | ||||
| 2025-07-14 | 13F | Sowell Financial Services LLC | 12 373 | −0,98 | 1 048 | 3,87 | ||||
| 2025-07-29 | 13F | Stratos Wealth Advisors, LLC | 2 745 | −82,05 | 233 | −81,20 | ||||
| 2025-08-14 | 13F | Atomi Financial Group, Inc. | 0 | −100,00 | 0 | |||||
| 2025-08-11 | 13F | Strategic Wealth Partners, Ltd. | 531 | 45 | ||||||
| 2025-08-14 | 13F | Nwi Management Lp | 8 900 | 0,00 | 1 | |||||
| 2025-08-13 | 13F | Marshall Wace, Llp | 230 361 | 1 074,11 | 19 518 | 1 132,20 | ||||
| 2025-08-14 | 13F | Old Mission Capital Llc | 59 212 | −23,18 | 5 017 | −19,41 | ||||
| 2025-08-07 | 13F | Allworth Financial LP | 300 | 25 | ||||||
| 2025-07-14 | 13F | Legacy Capital Group California, Inc. | 5 642 | 478 | ||||||
| 2025-08-13 | 13F | VestGen Advisors, LLC | 0 | −100,00 | 0 | |||||
| 2025-08-14 | 13F | Breakout Capital Partners, LP | 192 800 | 16 336 | ||||||
| 2025-08-13 | 13F | Twin Peaks Wealth Advisors, LLC | 30 | 3 | ||||||
| 2025-05-13 | 13F | M Holdings Securities, Inc. | 0 | −100,00 | 0 | |||||
| 2025-05-15 | 13F | Fundsmith Investment Services Ltd. | 0 | −100,00 | 0 | −100,00 | ||||
| 2025-08-13 | 13F | Walleye Capital LLC | 0 | −100,00 | 0 | |||||
| 2025-05-06 | 13F | Financial & Tax Architects, LLC | 0 | −100,00 | 0 | |||||
| 2025-08-04 | 13F | Creative Financial Designs Inc /adv | 3 149 | −1,04 | 267 | 3,91 | ||||
| 2025-08-12 | 13F | SRS Capital Advisors, Inc. | 2 | −60,00 | 0 | |||||
| 2025-08-14 | 13F | CoreCap Advisors, LLC | 35 908 | 10,10 | 3 042 | 15,49 | ||||
| 2025-08-14 | 13F | Toroso Investments, LLC | 25 808 | 5,26 | 2 187 | 10,40 | ||||
| 2025-08-19 | 13F | Slocum, Gordon & Co LLP | 0 | −100,00 | 0 | |||||
| 2025-08-08 | 13F | City Of London Investment Management Co Ltd | 34 400 | 14,67 | 2 915 | 20,26 | ||||
| 2025-09-04 | 13F/A | Advisor Group Holdings, Inc. | 5 236 | −30,90 | 444 | −27,50 | ||||
| 2025-07-30 | 13F | Crewe Advisors LLC | 63 | 0,00 | 5 | 0,00 | ||||
| 2025-07-23 | 13F | MADDEN SECURITIES Corp | 3 000 | 0,00 | 254 | 4,96 | ||||
| 2025-08-14 | 13F | Citadel Advisors Llc | Call | 44 500 | 28,61 | 3 770 | 34,93 | |||
| 2025-08-14 | 13F | Fmr Llc | 1 591 | 0,00 | 137 | 6,25 | ||||
| 2025-05-16 | 13F | Cape Investment Advisory, Inc. | 0 | −100,00 | 0 | −100,00 | ||||
| 2025-07-09 | 13F | Client First Investment Management LLC | 0 | −100,00 | 0 | −100,00 | ||||
| 2025-08-14 | 13F | Raymond James Financial Inc | 10 283 | −97,43 | 871 | −97,30 | ||||
| 2025-07-10 | 13F | Family Legacy Financial Solutions, LLC | 60 | 5 | ||||||
| 2025-08-14 | 13F | Comerica Bank | 268 | 0,00 | 23 | 4,76 | ||||
| 2025-08-15 | 13F | Morgan Stanley | 163 931 | 27,92 | 13 890 | 34,18 | ||||
| 2025-05-15 | 13F | Polymer Capital Management (HK) LTD | 0 | −100,00 | 0 | |||||
| 2025-07-22 | 13F | Miracle Mile Advisors, LLC | 0 | −100,00 | 0 | |||||
| 2025-07-30 | NP | ENDW - Cambria Endowment Style ETF | 318 | 29 | ||||||
| 2025-04-22 | 13F | Channing Global Advisors, Llc | 0 | −100,00 | 0 | |||||
| 2025-08-07 | 13F | Laffer Investments | 2 571 | 218 | ||||||
| 2025-08-14 | 13F | Schonfeld Strategic Advisors LLC | Put | 0 | −100,00 | 0 | ||||
| 2025-07-11 | 13F | Farther Finance Advisors, LLC | 33 | 0,00 | 3 | 0,00 | ||||
| 2025-08-11 | 13F | Rothschild Investment Llc | 200 | 0,00 | 17 | 0,00 | ||||
| 2025-08-12 | 13F | Steward Partners Investment Advisory, Llc | 1 091 | 60,68 | 92 | 70,37 | ||||
| 2025-08-14 | 13F | Citadel Advisors Llc | 45 224 | −57,36 | 3 832 | −55,27 | ||||
| 2025-08-14 | 13F | Jane Street Group, Llc | 76 170 | 48,94 | 6 454 | 56,25 | ||||
| 2025-08-14 | 13F | CIBC World Markets Inc. | 3 568 | 16,60 | 302 | 22,27 | ||||
| 2025-08-14 | 13F | Citadel Advisors Llc | Put | 31 000 | −29,22 | 2 627 | −25,76 | |||
| 2025-08-08 | 13F | Glaxis Capital Management, LLC | 30 000 | 2 542 | ||||||
| 2025-07-15 | 13F | Optima Capital Llc | 7 327 | 11,27 | 621 | 16,95 | ||||
| 2025-08-11 | 13F | Principal Securities, Inc. | 249 | −21,94 | 21 | −19,23 | ||||
| 2025-08-14 | 13F | Susquehanna International Group, Llp | Put | 11 400 | −89,71 | 966 | −89,22 | |||
| 2025-07-14 | 13F | Ridgewood Investments LLC | 600 | 0,00 | 51 | 4,17 | ||||
| 2025-08-14 | 13F | Susquehanna International Group, Llp | 66 625 | −22,31 | 5 645 | −18,50 | ||||
| 2025-04-14 | 13F | Wedmont Private Capital | 0 | −100,00 | 0 | |||||
| 2025-08-14 | 13F | Riggs Asset Managment Co. Inc. | 1 309 | 1 977,78 | 111 | 2 100,00 | ||||
| 2025-08-13 | 13F | Colonial Trust Co / SC | 0 | −100,00 | 0 | |||||
| 2025-08-13 | 13F | Federated Hermes, Inc. | 0 | −100,00 | 0 | |||||
| 2025-08-11 | 13F | Parametrica Management Ltd | 5 400 | 0,00 | 458 | 4,82 | ||||
| 2025-04-29 | 13F | Pensionmark Financial Group, Llc | 0 | −100,00 | 0 | |||||
| 2025-07-30 | 13F | Whittier Trust Co | 2 477 | 0,00 | 210 | 4,50 | ||||
| 2025-04-24 | 13F | Wright Fund Managment, LLC | 0 | −100,00 | 0 | |||||
| 2025-08-14 | 13F | Susquehanna International Group, Llp | Call | 121 900 | 104,19 | 10 329 | 114,23 | |||
| 2025-08-14 | 13F | Group One Trading, L.p. | 1 681 | 740,50 | 142 | 787,50 | ||||
| 2025-08-14 | 13F | Aprio Wealth Management, LLC | 6 000 | 3,00 | 508 | 8,09 | ||||
| 2025-08-14 | 13F | Bnp Paribas Arbitrage, Sa | 3 206 | −19,99 | 272 | −16,10 | ||||
| 2025-04-22 | 13F | Jfs Wealth Advisors, Llc | 0 | −100,00 | 0 | |||||
| 2025-08-07 | 13F | Encompass More Asset Management | 19 892 | 1 685 | ||||||
| 2025-07-10 | 13F | Rfg Holdings, Inc. | 27 755 | 2,16 | 2 352 | 7,16 | ||||
| 2025-08-13 | 13F | Northwestern Mutual Wealth Management Co | 0 | −100,00 | 0 | |||||
| 2025-08-13 | 13F | Flow Traders U.s. Llc | 69 866 | 6 | ||||||
| 2025-08-14 | 13F | Wells Fargo & Company/mn | 296 | −99,64 | 25 | −99,62 | ||||
| 2025-07-23 | 13F | Clear Creek Financial Management, LLC | 19 453 | 15,46 | 1 648 | 21,18 | ||||
| 2025-08-13 | 13F | Capital Analysts, Inc. | 0 | −100,00 | 0 | |||||
| 2025-08-14 | 13F | Blue Capital, Inc. | 0 | −100,00 | 0 | |||||
| 2025-08-13 | 13F | StoneX Group Inc. | 0 | −100,00 | 0 | −100,00 | ||||
| 2025-07-30 | 13F | Brookstone Capital Management | 6 223 | 1,63 | 527 | 6,68 | ||||
| 2025-07-24 | 13F | Verde Servicos Internacionais S.A. | 0 | −100,00 | 0 | |||||
| 2025-08-14 | 13F | Federation des caisses Desjardins du Quebec | 280 | 24 | ||||||
| 2025-07-09 | 13F | Fiduciary Alliance LLC | 23 420 | 28,53 | 1 984 | 34,87 | ||||
| 2025-08-13 | 13F | EverSource Wealth Advisors, LLC | 2 | 0 | ||||||
| 2025-07-29 | 13F | Private Trust Co Na | 399 | 0,00 | 34 | 3,13 | ||||
| 2025-08-04 | 13F | Spire Wealth Management | 4 593 | 83,57 | 418 | 106,93 | ||||
| 2025-07-01 | 13F | Harbor Investment Advisory, Llc | 250 | −83,33 | 21 | −82,64 | ||||
| 2025-08-14 | 13F | Banque Transatlantique SA | 0 | −100,00 | 0 | |||||
| 2025-06-27 | NP | GIAX - Nicholas Global Equity and Income ETF | 24 519 | −4,80 | 2 101 | −5,66 | ||||
| 2025-08-15 | 13F | Kestra Advisory Services, LLC | 0 | −100,00 | 0 | |||||
| 2025-08-14 | 13F | Sona Asset Management (us) Llc | 27 000 | −28,00 | 2 288 | −24,47 | ||||
| 2025-05-12 | 13F | Independent Advisor Alliance | 0 | −100,00 | 0 |