Grundläggande statistik
| Institutionella ägare | 140 total, 140 long only, 0 short only, 0 long/short - change of −4,73% MRQ |
| Genomsnittlig portföljallokering | 0.2963 % - change of −8,71% MRQ |
| Institutionella aktier (lång) | 4 155 147 (ex 13D/G) - change of −0,41MM shares −8,89% MRQ |
| Institutionellt värde (lång) | $ 450 666 USD ($1000) |
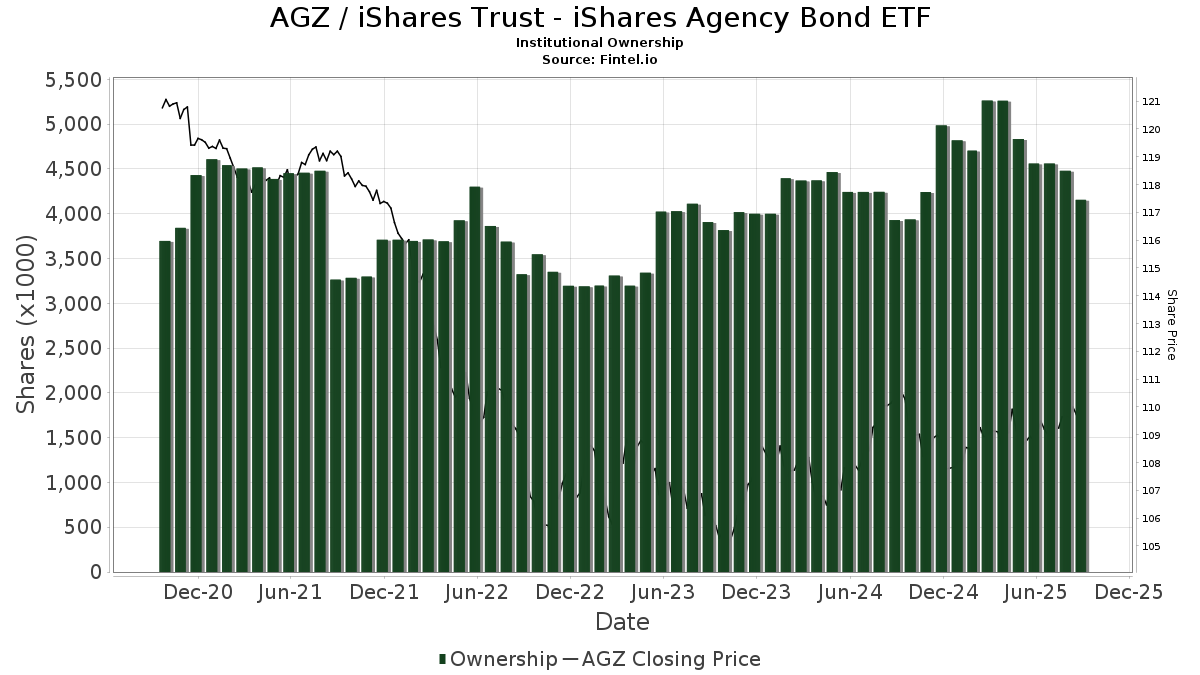
Institutionellt ägande och aktieägare
iShares Trust - iShares Agency Bond ETF (US:AGZ) har 140 Institutionella ägare och aktieägare som har lämnat in 13D/G- eller 13F-formulär till Securities Exchange Commission (SEC). Dessa institut innehar totalt 4,155,147 aktier. Största aktieägare inkluderar HighTower Advisors, LLC, Stifel Financial Corp, Raymond James Financial Inc, Bank of New York Mellon Corp, Ambassador Advisors, LLC, Syon Capital Llc, Bailard, Inc., Mason & Associates Inc, Mill Creek Capital Advisors, LLC, and Envestnet Asset Management Inc .
iShares Trust - iShares Agency Bond ETF (ARCA:AGZ) Institutionell ägarstruktur visar institutioners och fonders nuvarande positioner i företaget, samt de senaste förändringarna i positionernas storlek. Större aktieägare kan vara enskilda investerare, fonder, hedgefonder eller institutioner. Bilaga 13D visar att investeraren äger (eller ägde) mer än 5% av företaget och avser (eller avsåg) att aktivt eftersträva en förändring av affärsstrategin. Schedule 13G indikerar en passiv investering på över 5%.
The share price as of September 12, 2025 is 110,26 / share. Previously, on September 16, 2024, the share price was 110,79 / share. This represents a decline of 0,47% over that period.
Fondsentimentets poäng
Fondsentimentet poängen(fka Ägarackumulation-poäng) visar vilka aktier som är mest köpta av fonder. Det är resultatet av en sofistikerad kvantitativ flerfaktormodell som identifierar företag med de högsta nivåerna av institutionell ackumulering. Poängsättningsmodellen använder en kombination av den totala ökningen av redovisade ägare, förändringarna i portföljallokeringarna för dessa ägare och andra mått. Siffran sträcker sig från 0 till 100, där högre siffror indikerar en högre nivå av ackumulering i förhållande till sina konkurrenter, och 50 är genomsnittet.
Uppdateringsfrekvens: Dagligen
Se Ownership Explorer, som innehåller en lista över de högst rankade företagen.
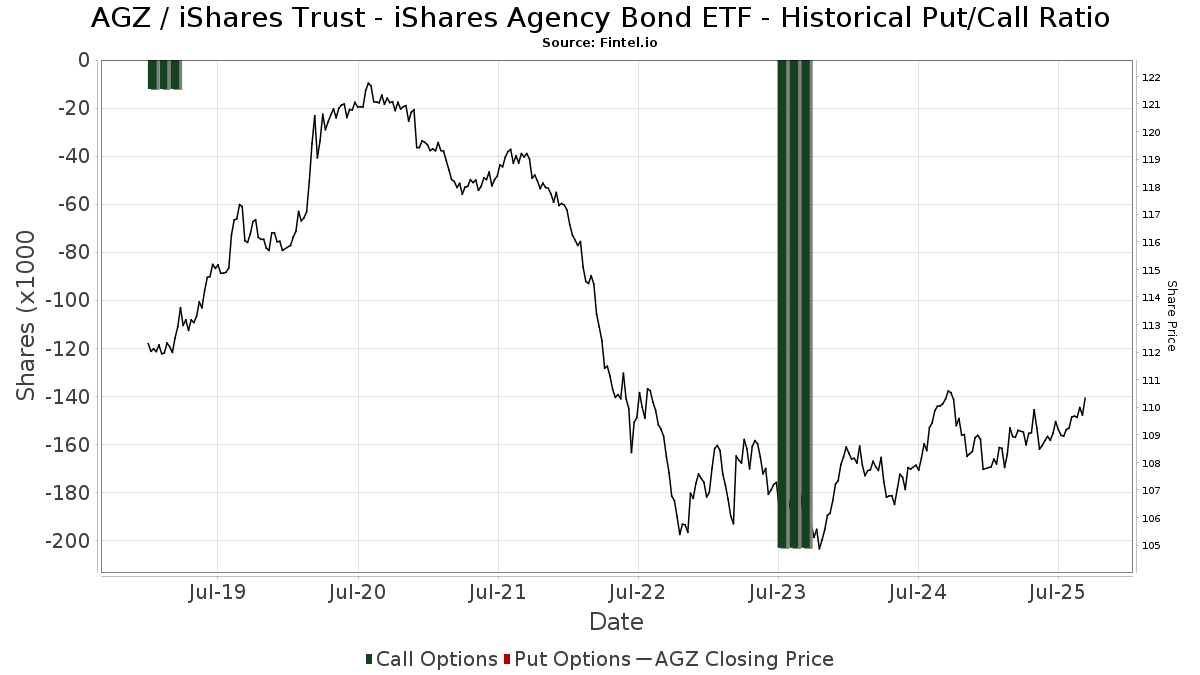
Institutionell sälj/köp-kvot
Förutom att rapportera vanliga eget kapital- och skuldemissioner måste institutioner med mer än 100MM tillgångar under förvaltning också avslöja sina innehav av sälj- och köpoptioner. Eftersom säljoptioner i allmänhet indikerar ett negativt sentiment och köpoptioner indikerar ett positivt sentiment, kan vi få en uppfattning om det övergripande institutionella sentimentet genom att plotta förhållandet mellan säljoptioner och köpoptioner. Diagrammet till höger visar det historiska förhållandet mellan sälj- och köpoptioner för detta instrument.
Genom att använda sälj/köp-kvoten som en indikator på aktieägarnas sentiment undviker man en av de största bristerna med att använda det totala institutionella ägandet, nämligen att en betydande del av de förvaltade tillgångarna investeras passivt för att följa index. Passivt förvaltade fonder köper vanligtvis inte optioner, så indikatorn för sälj/köp-kvoten ger en bättre bild av stämningen i aktivt förvaltade fonder.
13F- och NPORT-arkiveringar
Detaljer om 13F-arkiveringar är gratis. Detaljer om NP-arkiveringar kräver ett premiummedlemskap. Gröna rader indikerar nya positioner. Röda rader indikerar stängda positioner. Klicka på länk symbolen för att se hela transaktionshistoriken.
Uppgradera
för att låsa upp premiumdata och exportera till Excel ![]() .
.
| Fil Datum | Källa | Investerare | Typ | Genomsnittligt pris (beräknat) |
Aktier | Δ Aktier (%) |
Rapporterat värde (1000 USD) |
Δ Värde (%) |
Portföljallokering (%) |
|
|---|---|---|---|---|---|---|---|---|---|---|
| 2025-08-14 | 13F | Colony Group, LLC | 3 068 | 337 | ||||||
| 2025-07-28 | 13F | Harbour Investments, Inc. | 0 | −100,00 | 0 | |||||
| 2025-07-31 | 13F | Cambridge Investment Research Advisors, Inc. | 4 821 | −1,33 | 1 | |||||
| 2025-07-22 | 13F | Checchi Capital Advisers, LLC | 4 164 | −26,99 | 457 | −26,92 | ||||
| 2025-08-13 | 13F | Kayne Anderson Rudnick Investment Management Llc | 2 | 0,00 | 0 | |||||
| 2025-08-14 | 13F | GWM Advisors LLC | 5 746 | 0,00 | 630 | 0,32 | ||||
| 2025-08-14 | 13F | Evercore Wealth Management, LLC | 2 885 | 0,00 | 316 | 0,32 | ||||
| 2025-08-14 | 13F | Sequent Planning LLC | 2 881 | 316 | ||||||
| 2025-08-13 | 13F | Cerity Partners LLC | 12 813 | 1 406 | ||||||
| 2025-08-07 | 13F | Efficient Advisors, LLC | 0 | −100,00 | 0 | |||||
| 2025-08-08 | 13F | Pnc Financial Services Group, Inc. | 32 649 | −1,73 | 3 582 | −1,51 | ||||
| 2025-08-18 | 13F/A | National Bank Of Canada /fi/ | 200 | −33,33 | 22 | −34,37 | ||||
| 2025-08-14 | 13F | Raymond James Financial Inc | 288 709 | 0,26 | 31 671 | 0,50 | ||||
| 2025-08-12 | 13F | CIBC Private Wealth Group, LLC | 555 | 0,00 | 61 | 0,00 | ||||
| 2025-08-14 | 13F | Financial Advisory Service, Inc. | 5 | 0,00 | 1 | |||||
| 2025-07-22 | 13F | Coastal Investment Advisors, Inc. | 0 | −100,00 | 0 | |||||
| 2025-07-31 | 13F | Glass Jacobson Investment Advisors llc | 9 396 | 2,26 | 1 031 | 3,94 | ||||
| 2025-08-11 | 13F | Vista Cima Wealth Management LLC | 17 339 | −1,12 | 1 902 | −0,89 | ||||
| 2025-08-08 | 13F | Avantax Advisory Services, Inc. | 33 319 | 15,45 | 3 655 | 15,74 | ||||
| 2025-08-12 | 13F | Argent Trust Co | 2 254 | 0,00 | 247 | 0,41 | ||||
| 2025-08-12 | 13F | Archer Investment Corp | 51 | 2,00 | 6 | 0,00 | ||||
| 2025-04-30 | 13F | POM Investment Strategies, LLC | 0 | −100,00 | 0 | |||||
| 2025-08-08 | 13F | United Asset Strategies, Inc. | 3 331 | −24,71 | 365 | −24,59 | ||||
| 2025-08-12 | 13F | BlackRock, Inc. | 0 | −100,00 | 0 | |||||
| 2025-07-29 | 13F | Private Trust Co Na | 3 993 | 3,55 | 438 | 3,79 | ||||
| 2025-08-04 | 13F | Bristlecone Advisors, LLC | 0 | −100,00 | 0 | |||||
| 2025-07-28 | 13F | Acorn Financial Advisory Services Inc /adv | 2 382 | −0,79 | 261 | −0,38 | ||||
| 2025-07-31 | 13F | Jackson Hole Capital Partners, LLC | 98 | 0,00 | 11 | 0,00 | ||||
| 2025-08-08 | 13F | Citizens Financial Group Inc/ri | 6 698 | 29,16 | 735 | 29,45 | ||||
| 2025-05-14 | 13F | PKS Advisory Services, LLC | 0 | −100,00 | 0 | |||||
| 2025-07-21 | 13F | Pacific Financial Group Inc | 2 405 | −3,06 | 264 | −2,95 | ||||
| 2025-08-11 | 13F | Principal Securities, Inc. | 11 | −97,77 | 1 | −98,11 | ||||
| 2025-05-16 | 13F | Jones Financial Companies Lllp | 0 | −100,00 | 0 | |||||
| 2025-07-31 | 13F | Sharper & Granite LLC | 10 838 | −1,18 | 1 183 | −1,42 | ||||
| 2025-08-01 | 13F | Advisory Alpha, LLC | 0 | −100,00 | 0 | |||||
| 2025-07-15 | 13F | FLP Wealth Management, LLC | 0 | −100,00 | 0 | |||||
| 2025-05-14 | 13F | Dorsey & Whitney Trust CO LLC | 0 | −100,00 | 0 | |||||
| 2025-07-30 | 13F | Bogart Wealth, LLC | 66 | −50,38 | 7 | −50,00 | ||||
| 2025-08-14 | 13F | Citadel Advisors Llc | 60 004 | 69,15 | 6 582 | 69,55 | ||||
| 2025-07-17 | 13F | Clean Yield Group | 746 | 14,42 | 82 | 14,08 | ||||
| 2025-08-14 | 13F | Wiley Bros.-aintree Capital, Llc | 0 | −100,00 | 0 | |||||
| 2025-08-08 | 13F/A | Ignite Planners, LLC | 8 899 | 7,51 | 970 | 7,18 | ||||
| 2025-08-14 | 13F | Mariner, LLC | 2 324 | −1,57 | 255 | −1,55 | ||||
| 2025-04-29 | 13F | Hm Payson & Co | 26 730 | 15,99 | 2 925 | 17,56 | ||||
| 2025-07-15 | 13F | Signet Financial Management, Llc | 58 085 | −6,76 | 6 372 | −6,54 | ||||
| 2025-07-17 | 13F | Park Place Capital Corp | 3 461 | −11,03 | 378 | −11,06 | ||||
| 2025-04-16 | 13F | NorthCrest Asset Manangement, LLC | 0 | −100,00 | 0 | |||||
| 2025-07-31 | 13F | Asset Management One Co., Ltd. | 103 184 | −5,40 | 11 319 | −5,18 | ||||
| 2025-08-14 | 13F | CoreCap Advisors, LLC | 1 | 0,00 | 0 | |||||
| 2025-08-12 | 13F | Founders Financial Alliance, LLC | 98 | 0,00 | 11 | 0,00 | ||||
| 2025-07-17 | 13F | Montis Financial, LLC | 9 368 | −31,85 | 1 028 | −31,72 | ||||
| 2025-08-12 | 13F | Ameritas Investment Partners, Inc. | 65 | 0,00 | 7 | 0,00 | ||||
| 2025-07-30 | 13F | Capstone Triton Financial Group, LLC | 15 113 | −8,40 | 1 658 | −6,96 | ||||
| 2025-07-24 | 13F | Us Bancorp \de\ | 39 082 | −5,91 | 4 287 | −5,68 | ||||
| 2025-05-14 | 13F | Northwestern Mutual Wealth Management Co | 0 | −100,00 | 0 | |||||
| 2025-04-25 | 13F | New Wave Wealth Advisors Llc | 0 | −100,00 | 0 | |||||
| 2025-08-14 | 13F | Syon Capital Llc | 187 866 | 20 609 | ||||||
| 2025-04-17 | 13F | Dynamic Advisor Solutions LLC | 0 | −100,00 | 0 | |||||
| 2025-08-14 | 13F | Glen Eagle Advisors, LLC | 1 | 0,00 | 0 | |||||
| 2025-06-23 | NP | IYLD - iShares Morningstar Multi-Asset Income ETF | 53 553 | −0,68 | 5 886 | 0,43 | ||||
| 2025-07-29 | 13F | Liberty Square Wealth Partners Llc | 5 173 | 0,00 | 567 | 0,18 | ||||
| 2025-08-05 | 13F | Huntington National Bank | 108 | 0,93 | ||||||
| 2025-05-13 | 13F | Bokf, Na | 0 | −100,00 | 0 | |||||
| 2025-08-14 | 13F | Smartleaf Asset Management LLC | 5 552 | 2,72 | 608 | 3,05 | ||||
| 2025-08-11 | 13F | Wbi Investments, Inc. | 32 636 | −6,65 | 3 580 | −6,43 | ||||
| 2025-07-31 | 13F | CVA Family Office, LLC | 29 051 | −0,07 | 3 187 | 0,16 | ||||
| 2025-08-12 | 13F | Proequities, Inc. | 0 | 0 | ||||||
| 2025-07-08 | 13F | Legacy Private Trust Co. | 2 350 | 258 | ||||||
| 2025-08-14 | 13F | Toroso Investments, LLC | 20 485 | 113,70 | 2 240 | 114,26 | ||||
| 2025-07-09 | 13F | Goelzer Investment Management, Inc. | 10 245 | −0,73 | 1 124 | −0,53 | ||||
| 2025-08-08 | 13F | Gts Securities Llc | 0 | −100,00 | 0 | |||||
| 2025-05-07 | 13F | Pin Oak Investment Advisors Inc | 0 | −100,00 | 0 | |||||
| 2025-08-06 | 13F | AE Wealth Management LLC | 184 | −9,80 | 20 | −9,09 | ||||
| 2025-05-12 | 13F | Commons Capital, Llc | 0 | −100,00 | 0 | |||||
| 2025-08-11 | 13F | Private Advisor Group, LLC | 12 448 | 0,34 | 1 366 | 0,59 | ||||
| 2025-07-24 | 13F | Shayne & Co., Llc | 3 035 | 0,00 | 333 | 0,00 | ||||
| 2025-08-19 | 13F | Advisory Services Network, LLC | 0 | −100,00 | 0 | |||||
| 2025-08-14 | 13F | Bank Of America Corp /de/ | 75 517 | −5,81 | 8 284 | −5,58 | ||||
| 2025-07-21 | 13F | Impact Investors, Inc | 52 408 | −19,02 | 5 749 | −18,82 | ||||
| 2025-08-12 | 13F | Global Retirement Partners, LLC | 2 600 | 316,67 | 285 | 325,37 | ||||
| 2025-07-22 | 13F | Red Tortoise LLC | 10 | −78,72 | 1 | −80,00 | ||||
| 2025-08-08 | 13F | Bailard, Inc. | 127 218 | 1,83 | 13 956 | 2,08 | ||||
| 2025-08-12 | 13F | DiMeo Schneider & Associates, L.L.C. | 12 801 | −0,24 | 1 404 | 0,00 | ||||
| 2025-07-17 | 13F | Smith, Salley & Associates | 19 689 | 0,53 | 2 160 | 0,75 | ||||
| 2025-08-12 | 13F | MAI Capital Management | 35 | −52,70 | 4 | −62,50 | ||||
| 2025-07-15 | 13F | CHB Investment Group, LLC | 29 015 | −0,05 | 3 | 0,00 | ||||
| 2025-08-12 | 13F | Deutsche Bank Ag\ | 226 | 25 | ||||||
| 2025-07-25 | 13F | LRI Investments, LLC | 85 | 0,00 | 9 | 0,00 | ||||
| 2025-08-12 | 13F | Jpmorgan Chase & Co | 7 393 | −4,09 | 811 | −3,80 | ||||
| 2025-07-10 | 13F | Focus Financial Network, Inc. | 19 163 | −6,14 | 2 102 | −5,91 | ||||
| 2025-07-18 | 13F | RKL Wealth Management LLC | 78 396 | −1,65 | 8 600 | −1,41 | ||||
| 2025-08-05 | 13F | Prosperity Wealth Management, Inc. | 0 | −100,00 | 0 | |||||
| 2025-08-06 | 13F | Moors & Cabot, Inc. | 8 129 | 7,02 | 892 | 7,22 | ||||
| 2025-08-07 | 13F | Shared Vision Wealth Group LLC | 2 328 | 1,84 | 254 | 1,60 | ||||
| 2025-08-27 | NP | RYDEX VARIABLE TRUST - Multi-Hedge Strategies Fund Variable Annuity | 0 | −100,00 | 0 | |||||
| 2025-08-27 | NP | RYMSX - Guggenheim Multi-Hedge Strategies Fund Class P | 0 | −100,00 | 0 | |||||
| 2025-08-14 | 13F | Royal Bank Of Canada | 3 692 | −61,97 | 405 | −61,90 | ||||
| 2025-07-21 | 13F | Mirae Asset Global Investments Co., Ltd. | 16 390 | −46,24 | 1 798 | −46,08 | ||||
| 2025-08-12 | 13F | Jaffetilchin Investment Partners, LLC | 21 002 | 11,57 | 2 304 | 11,80 | ||||
| 2025-07-30 | 13F | Rehmann Capital Advisory Group | 9 371 | −6,34 | 1 028 | −6,03 | ||||
| 2025-08-01 | 13F | Ashton Thomas Private Wealth, LLC | 5 672 | −7,86 | 622 | −7,58 | ||||
| 2025-09-04 | 13F/A | Advisor Group Holdings, Inc. | 4 626 | 158,15 | 508 | 159,18 | ||||
| 2025-05-12 | 13F | Providence First Trust Co | 0 | −100,00 | 0 | |||||
| 2025-07-14 | 13F | Narus Financial Partners, LLC | 4 117 | −16,51 | 452 | −16,33 | ||||
| 2025-08-13 | 13F | Baird Financial Group, Inc. | 4 414 | 0,78 | 484 | 1,04 | ||||
| 2025-08-08 | 13F | Cetera Investment Advisers | 3 744 | −79,38 | 411 | −79,36 | ||||
| 2025-08-13 | 13F | Great Diamond Partners, LLC | 78 255 | 0,35 | 8 585 | 0,59 | ||||
| 2025-08-07 | 13F | Hennion & Walsh Asset Management, Inc. | 36 552 | 3,01 | 4 010 | 3,24 | ||||
| 2025-08-15 | 13F | Kestra Advisory Services, LLC | 0 | −100,00 | 0 | |||||
| 2025-07-23 | 13F | Fluent Financial, LLC | 33 900 | 32,41 | 3 719 | 32,74 | ||||
| 2025-05-15 | 13F | Pathstone Holdings, LLC | 0 | −100,00 | 0 | |||||
| 2025-07-23 | 13F | Detalus Advisors, LLC | 1 975 | −3,09 | 217 | −3,14 | ||||
| 2025-08-13 | 13F | Guggenheim Capital Llc | 14 180 | −19,12 | 1 556 | −18,93 | ||||
| 2025-08-05 | 13F | Cambiar Investors Llc | 7 941 | −4,57 | 871 | −4,29 | ||||
| 2025-07-03 | 13F | Fiduciary Financial Group, Llc | 2 425 | 0,00 | 265 | 0,76 | ||||
| 2025-07-30 | 13F | Whittier Trust Co | 441 | 0,00 | 48 | 0,00 | ||||
| 2025-08-26 | 13F/A | Thrivent Financial For Lutherans | 2 456 | −0,20 | 0 | |||||
| 2025-08-04 | 13F | Keybank National Association/oh | 94 451 | −2,18 | 10 361 | −1,95 | ||||
| 2025-05-12 | 13F | Eagle Global Advisors Llc | 0 | −100,00 | 0 | |||||
| 2025-07-17 | 13F | Nelson, Van Denburg & Campbell Wealth Management Group, LLC | 2 829 | −3,68 | 310 | −3,43 | ||||
| 2025-07-21 | 13F | Ameritas Advisory Services, LLC | 239 | 26 | ||||||
| 2025-07-23 | 13F | Columbus Macro, LLC | 0 | −100,00 | 0 | |||||
| 2025-08-08 | 13F | Renasant Bank | 3 018 | −12,45 | 331 | −12,20 | ||||
| 2025-08-14 | 13F | Wells Fargo & Company/mn | 116 486 | −16,84 | 12 778 | −16,64 | ||||
| 2025-08-12 | 13F | J.w. Cole Advisors, Inc. | 8 245 | 2,00 | 904 | 2,26 | ||||
| 2025-07-03 | 13F | Arvest Investments, Inc. | 102 995 | −0,64 | 11 299 | −0,41 | ||||
| 2025-08-12 | 13F | LPL Financial LLC | 34 140 | −18,44 | 3 745 | −18,25 | ||||
| 2025-08-14 | 13F | Jane Street Group, Llc | 58 563 | 71,73 | 6 424 | 72,13 | ||||
| 2025-08-08 | 13F | Hartland & Co., LLC | 380 | 42 | ||||||
| 2025-07-25 | 13F | Hazlett, Burt & Watson, Inc. | 41 | 0,00 | 0 | |||||
| 2025-08-11 | 13F | HighTower Advisors, LLC | 401 789 | 3,15 | 44 076 | 3,40 | ||||
| 2025-08-04 | 13F | Assetmark, Inc | 134 | 21,82 | 15 | 16,67 | ||||
| 2025-07-16 | 13F | Novem Group | 3 988 | 9,53 | 437 | 9,80 | ||||
| 2025-08-12 | 13F | Fortis Capital Management LLC | 9 943 | −56,81 | 1 091 | −56,73 | ||||
| 2025-08-05 | 13F | Bank of New York Mellon Corp | 194 732 | 8,74 | 21 362 | 9,00 | ||||
| 2025-08-08 | 13F | Capital Investment Advisory Services, LLC | 1 121 | 0,00 | 123 | 0,00 | ||||
| 2025-07-14 | 13F | Toth Financial Advisory Corp | 150 | 0,00 | 16 | 0,00 | ||||
| 2025-08-04 | 13F | Creative Financial Designs Inc /adv | 10 896 | −13,79 | 1 195 | −13,59 | ||||
| 2025-08-07 | 13F | Allworth Financial LP | 1 | 0,00 | 0 | |||||
| 2025-07-29 | NP | HFND - Unlimited HFND Multi-Strategy Return Tracker ETF | 17 484 | 13,36 | 1 908 | 12,97 | ||||
| 2025-04-22 | 13F/A | NorthRock Partners, LLC | 0 | −100,00 | 0 | −100,00 | ||||
| 2025-08-14 | 13F | Ameriprise Financial Inc | 53 779 | 146,03 | 5 900 | 146,61 | ||||
| 2025-08-11 | 13F | TRUE Private Wealth Advisors | 24 569 | −93,93 | 2 695 | −93,92 | ||||
| 2025-08-14 | 13F | Stifel Financial Corp | 369 770 | −0,96 | 40 565 | −0,72 | ||||
| 2025-08-01 | 13F | Fort Vancouver Investment Management, LLC | 192 | 0,00 | 21 | 0,00 | ||||
| 2025-07-16 | 13F | Maridea Wealth Management LLC | 6 353 | −24,79 | 697 | −24,68 | ||||
| 2025-08-01 | 13F | James Investment Research Inc | 14 016 | −1,66 | 1 538 | −1,41 | ||||
| 2025-08-01 | 13F | Envestnet Asset Management Inc | 119 834 | −11,25 | 13 146 | −11,04 | ||||
| 2025-08-04 | 13F | Arkadios Wealth Advisors | 2 417 | 9,32 | 265 | 9,96 | ||||
| 2025-08-14 | 13F | Ambassador Advisors, LLC | 194 717 | 5,93 | 21 360 | 6,18 | ||||
| 2025-07-31 | 13F | Mason & Associates Inc | 123 551 | −1,89 | 13 554 | −1,66 | ||||
| 2025-08-12 | 13F | Steward Partners Investment Advisory, Llc | 3 039 | 12,47 | 333 | 12,88 | ||||
| 2025-04-17 | 13F | Montecito Bank & Trust | 2 078 | 0,00 | 227 | 1,34 | ||||
| 2025-04-28 | 13F | Strategic Financial Concepts, LLC | 0 | −100,00 | 0 | −100,00 | ||||
| 2025-07-28 | 13F | BRYN MAWR TRUST Co | 350 | 0,00 | 38 | 0,00 | ||||
| 2025-08-14 | 13F | Susquehanna International Group, Llp | 19 175 | 31,04 | 2 103 | 31,36 | ||||
| 2025-07-30 | 13F | Insight Advisors, LLC/ PA | 12 977 | −0,08 | 1 424 | 0,14 | ||||
| 2025-07-16 | 13F | St Germain D J Co Inc | 475 | 0,00 | 52 | 1,96 | ||||
| 2025-05-15 | 13F | Creative Planning | 0 | −100,00 | 0 | |||||
| 2025-08-06 | 13F | Commonwealth Equity Services, Llc | 9 761 | −59,13 | 1 | −50,00 | ||||
| 2025-07-24 | 13F | IFP Advisors, Inc | 865 | 0,00 | 95 | 0,00 | ||||
| 2025-08-05 | 13F | Tiaa Trust, National Association | 2 103 | 0,00 | 231 | 0,00 | ||||
| 2025-08-14 | 13F | UBS Group AG | 77 154 | −6,09 | 8 464 | −5,87 | ||||
| 2025-04-28 | 13F | Mainstream Capital Management LLC | 0 | −100,00 | 0 | |||||
| 2025-08-13 | 13F | Measured Wealth Private Client Group, LLC | 6 581 | −34,31 | 722 | −34,22 | ||||
| 2025-07-10 | 13F | Sunflower Bank, N.A. | 23 035 | 0,00 | 2 527 | 0,24 | ||||
| 2025-08-18 | 13F | Geneos Wealth Management Inc. | 91 | 10 | ||||||
| 2025-08-11 | 13F | Mill Creek Capital Advisors, LLC | 122 417 | −22,57 | 13 429 | −22,38 | ||||
| 2025-08-12 | 13F | Wood Tarver Financial Group, LLC | 44 | 0,00 | 0 | −100,00 | ||||
| 2025-08-15 | 13F | CI Private Wealth, LLC | 1 825 | 200 | ||||||
| 2025-05-14 | 13F | Straightline Group Llc | 0 | −100,00 | 0 | |||||
| 2025-08-04 | 13F | Templeton & Phillips Capital Management, LLC | 1 008 | 0,00 | 111 | 0,00 | ||||
| 2025-08-15 | 13F | Morgan Stanley | 72 478 | 1,48 | 7 951 | 1,71 | ||||
| 2025-08-14 | 13F | Fmr Llc | 240 | 17,65 | 26 | 18,18 | ||||
| 2025-07-25 | 13F | Cwm, Llc | 47 | −81,92 | 0 | |||||
| 2025-08-14 | 13F | Comerica Bank | 1 997 | −22,87 | 219 | −22,61 | ||||
| 2025-05-05 | 13F | Transce3nd, LLC | 0 | −100,00 | 0 |