Grundläggande statistik
| Institutionella aktier (lång) | 28 150 905 (ex 13D/G) - change of 2,77MM shares 10,91% MRQ |
| Institutionellt värde (lång) | $ 70 434 USD ($1000) |
Institutionellt ägande och aktieägare
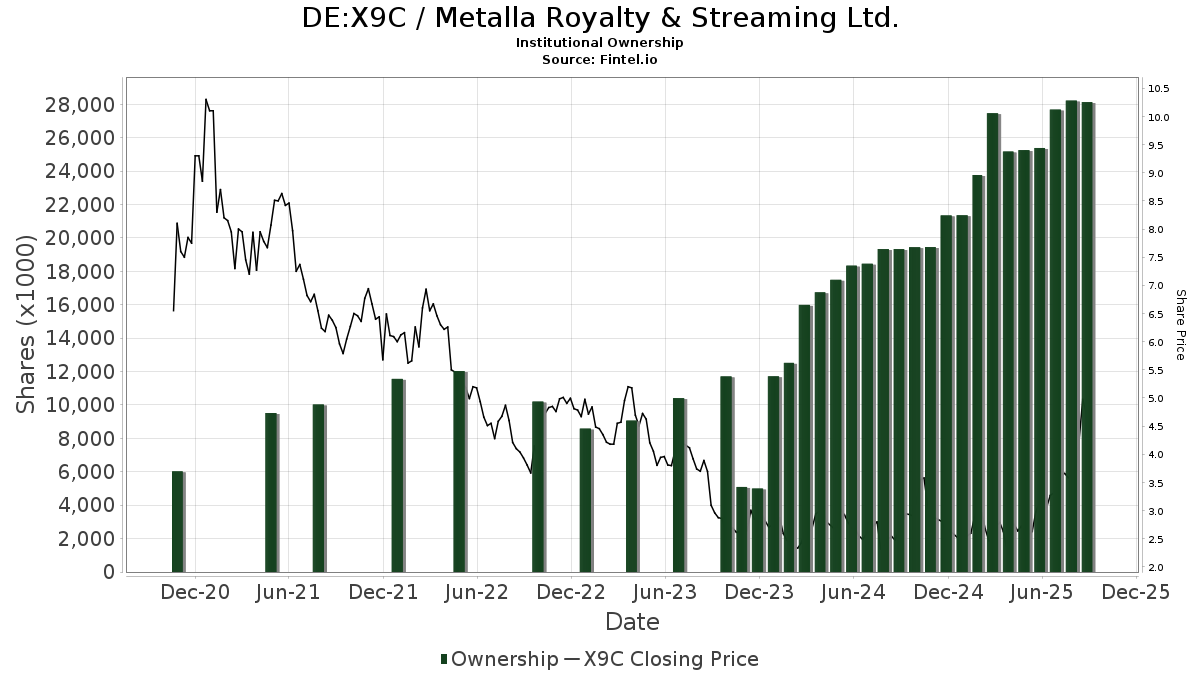
Metalla Royalty & Streaming Ltd. (DE:X9C) har 78 Institutionella ägare och aktieägare som har lämnat in 13D/G- eller 13F-formulär till Securities Exchange Commission (SEC). Dessa institut innehar totalt 28,150,905 aktier. Största aktieägare inkluderar Euro Pacific Asset Management, LLC, EPGFX - EuroPac Gold Fund Class A, ASA Gold & Precious Metals Ltd, Merk Investments LLC, Van Eck Associates Corp, GDXJ - VanEck Vectors Junior Gold Miners ETF, Fmr Llc, Citadel Advisors Llc, Sprott Inc., and FSDPX - Materials Portfolio .
Metalla Royalty & Streaming Ltd. (DB:X9C) Institutionell ägarstruktur visar institutioners och fonders nuvarande positioner i företaget, samt de senaste förändringarna i positionernas storlek. Större aktieägare kan vara enskilda investerare, fonder, hedgefonder eller institutioner. Bilaga 13D visar att investeraren äger (eller ägde) mer än 5% av företaget och avser (eller avsåg) att aktivt eftersträva en förändring av affärsstrategin. Schedule 13G indikerar en passiv investering på över 5%.
The share price as of September 8, 2025 is 4,76 / share. Previously, on September 9, 2024, the share price was 2,58 / share. This represents an increase of 84,33% over that period.
Fondsentimentets poäng
Fondsentimentet poängen(fka Ägarackumulation-poäng) visar vilka aktier som är mest köpta av fonder. Det är resultatet av en sofistikerad kvantitativ flerfaktormodell som identifierar företag med de högsta nivåerna av institutionell ackumulering. Poängsättningsmodellen använder en kombination av den totala ökningen av redovisade ägare, förändringarna i portföljallokeringarna för dessa ägare och andra mått. Siffran sträcker sig från 0 till 100, där högre siffror indikerar en högre nivå av ackumulering i förhållande till sina konkurrenter, och 50 är genomsnittet.
Uppdateringsfrekvens: Dagligen
Se Ownership Explorer, som innehåller en lista över de högst rankade företagen.
13F- och NPORT-arkiveringar
Detaljer om 13F-arkiveringar är gratis. Detaljer om NP-arkiveringar kräver ett premiummedlemskap. Gröna rader indikerar nya positioner. Röda rader indikerar stängda positioner. Klicka på länk symbolen för att se hela transaktionshistoriken.
Uppgradera
för att låsa upp premiumdata och exportera till Excel ![]() .
.
| Fil Datum | Källa | Investerare | Typ | Genomsnittligt pris (beräknat) |
Aktier | Δ Aktier (%) |
Rapporterat värde (1000 USD) |
Δ Värde (%) |
Portföljallokering (%) |
|
|---|---|---|---|---|---|---|---|---|---|---|
| 2025-08-14 | 13F | 683 Capital Management, LLC | 0 | −100,00 | 0 | |||||
| 2025-08-14 | 13F | Cubist Systematic Strategies, LLC | 36 483 | 66,08 | 140 | 125,81 | ||||
| 2025-08-12 | 13F | Boreal Capital Management LLC | 41 630 | 160 | ||||||
| 2025-08-12 | 13F | Tradition Wealth Management, LLC | 10 329 | 0,00 | 40 | 34,48 | ||||
| 2025-08-12 | 13F | XTX Topco Ltd | 88 710 | 203,42 | 341 | 309,64 | ||||
| 2025-08-11 | 13F | Sprott Inc. | 721 059 | −0,45 | 2 771 | 33,80 | ||||
| 2025-08-14 | 13F | Qube Research & Technologies Ltd | 54 343 | 209 | ||||||
| 2025-08-21 | NP | GDXJ - VanEck Vectors Junior Gold Miners ETF | 2 410 869 | −28,97 | 9 258 | −4,64 | ||||
| 2025-08-13 | 13F | Renaissance Technologies Llc | 281 800 | 37,13 | 1 082 | 84,33 | ||||
| 2025-08-14 | 13F | Sunbelt Securities, Inc. | 16 700 | 0,00 | 42 | −12,77 | ||||
| 2025-08-12 | 13F | Horizon Kinetics Asset Management Llc | 405 430 | 0,97 | 1 557 | 35,54 | ||||
| 2025-08-07 | 13F | Rathbone Brothers plc | 0 | −100,00 | 0 | |||||
| 2025-08-18 | 13F | Wolverine Trading, Llc | 10 091 | −25,70 | 38 | −5,00 | ||||
| 2025-08-14 | 13F | Hrt Financial Lp | 60 622 | 40,03 | 0 | |||||
| 2025-08-12 | 13F | Insigneo Advisory Services, Llc | 357 029 | 1 371 | ||||||
| 2025-04-21 | 13F | Nelson, Van Denburg & Campbell Wealth Management Group, LLC | 0 | −100,00 | 0 | |||||
| 2025-08-13 | 13F | Northern Trust Corp | 47 082 | 181 | ||||||
| 2025-08-14 | 13F | Van Eck Associates Corp | 2 756 190 | −25,79 | 11 | 0,00 | ||||
| 2025-07-29 | 13F | LB Partners LLC | 36 000 | 0,00 | 138 | 33,98 | ||||
| 2025-07-24 | 13F | Ronald Blue Trust, Inc. | 1 500 | 0,00 | 6 | 25,00 | ||||
| 2025-08-11 | 13F | TD Waterhouse Canada Inc. | 0 | −100,00 | 0 | |||||
| 2025-08-12 | 13F | Proequities, Inc. | 0 | 0 | ||||||
| 2025-04-24 | 13F | U S Global Investors Inc | 0 | −100,00 | 0 | |||||
| 2025-08-14 | 13F | Millennium Management Llc | 278 201 | 497,72 | 1 068 | 703,01 | ||||
| 2025-08-05 | 13F | Simplex Trading, Llc | 32 824 | 144,54 | 0 | |||||
| 2025-08-14 | 13F | Two Sigma Advisers, Lp | 153 800 | 200,98 | 591 | 304,11 | ||||
| 2025-07-24 | NP | FSDPX - Materials Portfolio This fund is a listed as child fund of Fmr Llc and if that institution has disclosed ownership in this security, then these positions will not be double counted when calculating total shares and total value | 648 100 | 10,96 | 2 092 | 30,26 | ||||
| 2025-08-12 | 13F | NWF Advisory Services Inc. | 20 100 | −4,07 | 58 | 9,62 | ||||
| 2025-07-15 | 13F | Northside Capital Management, LLC | 111 578 | 0,00 | 428 | 34,17 | ||||
| 2025-07-25 | 13F | Stonehage Fleming Financial Services Holdings Ltd | 20 490 | 95,20 | 79 | 160,00 | ||||
| 2025-08-14 | 13F | Point72 (DIFC) Ltd | 3 096 | 12 | ||||||
| 2025-08-14 | 13F | CoreCap Advisors, LLC | 1 | 0 | ||||||
| 2025-07-09 | 13F | Massmutual Trust Co Fsb/adv | 4 680 | 0,00 | 18 | 30,77 | ||||
| 2025-07-23 | 13F/A | Euro Pacific Asset Management, LLC | 5 657 905 | 11,78 | 22 | 50,00 | ||||
| 2025-07-16 | 13F | Eagle Global Advisors Llc | 79 800 | 0,00 | 306 | 34,21 | ||||
| 2025-08-13 | 13F | Marshall Wace, Llp | 419 373 | 32,02 | 1 610 | 77,31 | ||||
| 2025-08-14 | 13F/A | Barclays Plc | 47 000 | 0 | ||||||
| 2025-08-22 | NP | FFNKX - Materials Portfolio Initial Class | 55 000 | 11,11 | 211 | 46,85 | ||||
| 2025-08-14 | 13F | Df Dent & Co Inc | 0 | −100,00 | 0 | |||||
| 2025-05-15 | 13F | Two Sigma Securities, Llc | 0 | −100,00 | 0 | −100,00 | ||||
| 2025-08-12 | 13F | Virtu Financial LLC | 0 | −100,00 | 0 | |||||
| 2025-08-11 | 13F | HighTower Advisors, LLC | 132 199 | −0,77 | 508 | 33,07 | ||||
| 2025-08-14 | 13F | Oxford Asset Management Llp | 32 934 | 126 | ||||||
| 2025-07-24 | NP | FNARX - Natural Resources Portfolio This fund is a listed as child fund of Fmr Llc and if that institution has disclosed ownership in this security, then these positions will not be double counted when calculating total shares and total value | 520 900 | 10,71 | 1 681 | 29,91 | ||||
| 2025-08-14 | 13F | Papamarkou Wellner Asset Management inc. | 30 272 | 9,50 | 116 | 46,84 | ||||
| 2025-08-14 | 13F | Citadel Advisors Llc | 790 501 | 57,75 | 3 036 | 111,79 | ||||
| 2025-08-14 | 13F | Susquehanna International Group, Llp | 88 121 | −20,45 | 338 | 6,96 | ||||
| 2025-08-14 | 13F | Fmr Llc | 1 224 000 | 10,86 | 4 692 | 47,01 | ||||
| 2025-08-12 | 13F | SRS Capital Advisors, Inc. | 2 200 | 0,00 | 8 | 33,33 | ||||
| 2025-08-14 | 13F | Citadel Advisors Llc | Put | 50 800 | 116,17 | 195 | 191,04 | |||
| 2025-07-29 | 13F | Sentry Investment Management Llc | 14 977 | 0,00 | 0 | |||||
| 2025-08-14 | 13F | Susquehanna International Group, Llp | Put | 43 400 | 197,26 | 167 | 304,88 | |||
| 2025-07-21 | 13F | Hilltop National Bank | 869 | 525,18 | 3 | |||||
| 2025-08-18 | 13F/A | National Bank Of Canada /fi/ | 6 566 | 10,20 | 24 | 41,18 | ||||
| 2025-08-13 | 13F | Walleye Capital LLC | 146 364 | 562 | ||||||
| 2025-08-05 | 13F | Bank Of Montreal /can/ | 21 023 | −8,04 | 81 | 21,21 | ||||
| 2025-08-14 | 13F | Balyasny Asset Management Llc | 10 409 | 40 | ||||||
| 2025-08-14 | 13F | Federation des caisses Desjardins du Quebec | 5 236 | −54,69 | 19 | −42,42 | ||||
| 2025-08-12 | 13F | Hillsdale Investment Management Inc. | 66 600 | 255 | ||||||
| 2025-08-28 | NP | INFL - Horizon Kinetics Inflation Beneficiaries ETF | 390 000 | 0,00 | 1 498 | 34,26 | ||||
| 2025-08-26 | NP | AFMCX - Acuitas US Microcap Fund Institutional Shares | 36 531 | 140 | ||||||
| 2025-08-13 | 13F | Continuum Advisory, LLC | 0 | −100,00 | 0 | |||||
| 2025-08-14 | 13F | Raymond James Financial Inc | 280 508 | 2 230,38 | 1 077 | 3 067,65 | ||||
| 2025-08-12 | 13F | Jpmorgan Chase & Co | 14 071 | 42,13 | 54 | 92,86 | ||||
| 2025-07-28 | NP | ASA Gold & Precious Metals Ltd | 3 000 000 | 0,00 | 9 660 | 17,09 | ||||
| 2025-08-14 | 13F | Merk Investments LLC | 3 000 000 | 0,00 | 11 520 | 34,27 | ||||
| 2025-08-13 | 13F | Quadrature Capital Ltd | 30 578 | 57,85 | 117 | 112,73 | ||||
| 2025-08-15 | 13F | Morgan Stanley | 278 750 | 6 697,12 | 1 070 | 9 627,27 | ||||
| 2025-08-14 | 13F | Man Group plc | 63 404 | 99,35 | 243 | 170,00 | ||||
| 2025-08-08 | 13F | Pnc Financial Services Group, Inc. | 1 000 | 0,00 | 4 | 50,00 | ||||
| 2025-08-14 | 13F | Jane Street Group, Llc | Call | 16 400 | 63 | |||||
| 2025-08-14 | 13F | Jane Street Group, Llc | 91 575 | 254,31 | 352 | 380,82 | ||||
| 2025-08-14 | 13F | SWAN Capital LLC | 200 | 1 | ||||||
| 2025-06-25 | NP | EPGFX - EuroPac Gold Fund Class A | 3 155 115 | 268,25 | 9 635 | 294,72 | ||||
| 2025-07-28 | 13F | Kiker Wealth Management, LLC | 6 003 | 595,60 | 23 | 1 050,00 | ||||
| 2025-08-14 | 13F | Bank Of America Corp /de/ | 72 162 | 3 836,82 | 277 | 5 440,00 | ||||
| 2025-08-14 | 13F | UBS Group AG | 21 859 | 2 077,19 | 84 | 4 050,00 | ||||
| 2025-08-14 | 13F | Royal Bank Of Canada | 5 126 | −68,60 | 20 | −57,45 | ||||
| 2025-05-21 | 13F/A | Geneos Wealth Management Inc. | 0 | −100,00 | 0 | −100,00 | ||||
| 2025-08-14 | 13F | Graham Capital Management, L.P. | 13 202 | 51 | ||||||
| 2025-05-07 | 13F | LPL Financial LLC | 0 | −100,00 | 0 | |||||
| 2025-08-14 | 13F | Citadel Advisors Llc | Call | 0 | −100,00 | 0 | ||||
| 2025-07-31 | 13F | Cambridge Investment Research Advisors, Inc. | 94 813 | −43,57 | 0 | |||||
| 2025-08-04 | 13F | Creekmur Asset Management LLC | 1 | 0,00 | 0 | |||||
| 2025-08-06 | 13F | Legacy Wealth Managment, LLC/ID | 400 | 0,00 | 2 | 0,00 | ||||
| 2025-09-04 | 13F/A | Advisor Group Holdings, Inc. | 14 084 | 7,64 | 54 | 45,95 | ||||
| 2025-08-14 | 13F | D. E. Shaw & Co., Inc. | 277 833 | 300,91 | 1 067 | 438,38 | ||||
| 2025-08-14 | 13F | Two Sigma Investments, Lp | 408 227 | 66,99 | 1 568 | 124,18 | ||||
| 2025-05-15 | 13F | Tower Research Capital LLC (TRC) | 0 | −100,00 | 0 | |||||
| 2025-08-14 | 13F/A | Perritt Capital Management Inc | 2 850 | 0,00 | 11 | 25,00 | ||||
| 2025-08-14 | 13F | Goldman Sachs Group Inc | 72 131 | 277 | ||||||
| 2025-08-12 | 13F | MAI Capital Management | 2 419 | 0,00 | 9 | 50,00 | ||||
| 2025-08-06 | 13F | Legacy Investment Solutions, LLC | 400 | 2 | ||||||
| 2025-08-12 | 13F | Steward Partners Investment Advisory, Llc | 0 | −100,00 | 0 | |||||
| 2025-08-14 | 13F | Group One Trading, L.p. | 12 996 | 50 | ||||||
| 2025-08-14 | 13F | Wells Fargo & Company/mn | 12 681 | 0,00 | 49 | 33,33 |