Grundläggande statistik
| Institutionella ägare | 123 total, 115 long only, 0 short only, 8 long/short - change of −8,89% MRQ |
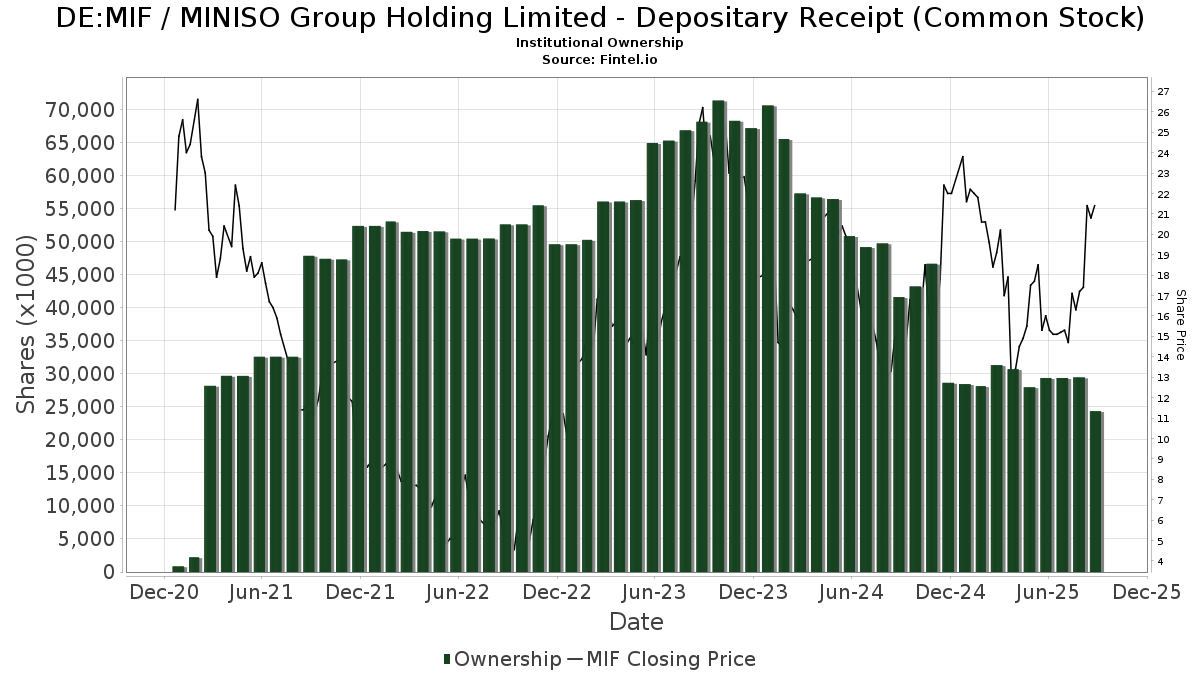
| Aktiepris | 21,20 |
| Genomsnittlig portföljallokering | 0.3765 % - change of 5,54% MRQ |
| Institutionella aktier (lång) | 24 346 962 (ex 13D/G) - change of −5,02MM shares −17,10% MRQ |
| Institutionellt värde (lång) | $ 435 401 USD ($1000) |
Institutionellt ägande och aktieägare
MINISO Group Holding Limited - Depositary Receipt (Common Stock) (DE:MIF) har 123 Institutionella ägare och aktieägare som har lämnat in 13D/G- eller 13F-formulär till Securities Exchange Commission (SEC). Dessa institut innehar totalt 24,346,962 aktier. Största aktieägare inkluderar KEYWISE CAPITAL MANAGEMENT (HK) Ltd, UBS Group AG, Marshall Wace, Llp, Morgan Stanley, Serenity Capital Management Pte. Ltd., Sequoia China Equity Partners (Hong Kong) Ltd, State Street Corp, Crossmark Global Holdings, Inc., Serenity Capital LLC, and Nordea Investment Management Ab .
MINISO Group Holding Limited - Depositary Receipt (Common Stock) (MUN:MIF) Institutionell ägarstruktur visar institutioners och fonders nuvarande positioner i företaget, samt de senaste förändringarna i positionernas storlek. Större aktieägare kan vara enskilda investerare, fonder, hedgefonder eller institutioner. Bilaga 13D visar att investeraren äger (eller ägde) mer än 5% av företaget och avser (eller avsåg) att aktivt eftersträva en förändring av affärsstrategin. Schedule 13G indikerar en passiv investering på över 5%.
The share price as of September 8, 2025 is 21,20 / share. Previously, on September 9, 2024, the share price was 14,10 / share. This represents an increase of 50,35% over that period.
Fondsentimentets poäng
Fondsentimentet poängen(fka Ägarackumulation-poäng) visar vilka aktier som är mest köpta av fonder. Det är resultatet av en sofistikerad kvantitativ flerfaktormodell som identifierar företag med de högsta nivåerna av institutionell ackumulering. Poängsättningsmodellen använder en kombination av den totala ökningen av redovisade ägare, förändringarna i portföljallokeringarna för dessa ägare och andra mått. Siffran sträcker sig från 0 till 100, där högre siffror indikerar en högre nivå av ackumulering i förhållande till sina konkurrenter, och 50 är genomsnittet.
Uppdateringsfrekvens: Dagligen
Se Ownership Explorer, som innehåller en lista över de högst rankade företagen.
13F- och NPORT-arkiveringar
Detaljer om 13F-arkiveringar är gratis. Detaljer om NP-arkiveringar kräver ett premiummedlemskap. Gröna rader indikerar nya positioner. Röda rader indikerar stängda positioner. Klicka på länk symbolen för att se hela transaktionshistoriken.
Uppgradera
för att låsa upp premiumdata och exportera till Excel ![]() .
.
| Fil Datum | Källa | Investerare | Typ | Genomsnittligt pris (beräknat) |
Aktier | Δ Aktier (%) |
Rapporterat värde (1000 USD) |
Δ Värde (%) |
Portföljallokering (%) |
|
|---|---|---|---|---|---|---|---|---|---|---|
| 2025-08-14 | 13F | Weiss Asset Management LP | 61 456 | 1 120 | ||||||
| 2025-08-12 | 13F | XTX Topco Ltd | 28 647 | 522 | ||||||
| 2025-08-14 | 13F | Erste Asset Management GmbH | 0 | −100,00 | 0 | |||||
| 2025-08-12 | 13F | Aigen Investment Management, Lp | 12 798 | 233 | ||||||
| 2025-08-14 | 13F | Parallax Volatility Advisers, L.P. | Call | 0 | −100,00 | 0 | ||||
| 2025-08-08 | 13F | Larson Financial Group LLC | 70 | 1 | ||||||
| 2025-08-14 | 13F | Group One Trading, L.p. | Call | 130 800 | 41,25 | 2 383 | 39,19 | |||
| 2025-08-14 | 13F | Group One Trading, L.p. | 13 722 | 250 | ||||||
| 2025-08-14 | 13F | Group One Trading, L.p. | Put | 68 800 | 24,19 | 1 254 | 22,36 | |||
| 2025-05-05 | 13F | Creekmur Asset Management LLC | 0 | −100,00 | 0 | |||||
| 2025-05-20 | 13F/A | Lansdowne Partners (uk) Llp | 0 | −100,00 | 0 | −100,00 | ||||
| 2025-08-14 | 13F | Sunbelt Securities, Inc. | 2 030 | 0,00 | 49 | 29,73 | ||||
| 2025-08-05 | 13F | Simplex Trading, Llc | Call | 75 100 | 59,11 | 1 | ||||
| 2025-07-30 | NP | APIE - ActivePassive International Equity ETF | 8 277 | −61,74 | 141 | −68,89 | ||||
| 2025-05-15 | 13F | Schonfeld Strategic Advisors LLC | 0 | −100,00 | 0 | |||||
| 2025-08-07 | 13F | Connor, Clark & Lunn Investment Management Ltd. | 0 | −100,00 | 0 | −100,00 | ||||
| 2025-08-14 | 13F | Jane Street Group, Llc | Put | 71 900 | −26,86 | 1 310 | −27,90 | |||
| 2025-08-05 | 13F | Simplex Trading, Llc | Put | 18 400 | −73,10 | 0 | −100,00 | |||
| 2025-08-05 | 13F | Simplex Trading, Llc | 2 020 | −95,59 | 0 | |||||
| 2025-08-14 | 13F | Jane Street Group, Llc | Call | 112 900 | −0,88 | 2 057 | −2,33 | |||
| 2025-05-15 | 13F | Tudor Investment Corp Et Al | Call | 0 | −100,00 | 0 | ||||
| 2025-08-14 | 13F | Jane Street Group, Llc | 13 828 | −96,63 | 252 | −96,69 | ||||
| 2025-05-05 | 13F | Pictet Asset Management Holding SA | 0 | −100,00 | 0 | |||||
| 2025-08-08 | 13F | M&G Plc | 0 | −100,00 | 0 | |||||
| 2025-08-14 | 13F | UBS Group AG | 2 520 980 | −40,64 | 45 932 | −41,51 | ||||
| 2025-08-07 | 13F | Vise Technologies, Inc. | 0 | −100,00 | 0 | |||||
| 2025-08-12 | 13F | Legal & General Group Plc | 352 471 | −0,47 | 6 417 | −1,99 | ||||
| 2025-08-11 | 13F | Citigroup Inc | 148 | −48,07 | 3 | −60,00 | ||||
| 2025-08-13 | 13F | Marshall Wace, Llp | 1 776 960 | 131,10 | 32 376 | 127,73 | ||||
| 2025-08-13 | 13F | Hsbc Holdings Plc | 0 | −100,00 | 0 | |||||
| 2025-08-13 | 13F | Invesco Ltd. | 22 894 | −19,16 | 417 | −20,27 | ||||
| 2025-08-14 | 13F | Vident Advisory, LLC | 29 127 | 18,02 | 531 | 16,23 | ||||
| 2025-08-28 | NP | GXC - SPDR(R) S&P(R) CHINA ETF | 16 479 | −10,15 | 300 | −11,50 | ||||
| 2025-07-28 | NP | AVEM - Avantis Emerging Markets Equity ETF This fund is a listed as child fund of American Century Companies Inc and if that institution has disclosed ownership in this security, then these positions will not be double counted when calculating total shares and total value | 117 342 | 0,00 | 1 997 | −18,19 | ||||
| 2025-08-07 | 13F | Allworth Financial LP | 7 | 0 | ||||||
| 2025-08-12 | 13F | MAI Capital Management | 341 | 0,00 | 6 | 0,00 | ||||
| 2025-06-23 | NP | UGPIX - UltraChina ProFund Investor Class | 5 405 | −24,36 | 97 | −40,85 | ||||
| 2025-07-22 | 13F | IMC-Chicago, LLC | 23 857 | −16,19 | 435 | −17,49 | ||||
| 2025-07-22 | 13F | IMC-Chicago, LLC | Put | 45 100 | 6,62 | 822 | 4,99 | |||
| 2025-07-22 | 13F | IMC-Chicago, LLC | Call | 24 300 | −12,59 | 443 | −14,01 | |||
| 2025-08-14 | 13F | Van Eck Associates Corp | 279 533 | 16,99 | 5 | 25,00 | ||||
| 2025-08-13 | 13F | Walleye Capital LLC | 0 | −100,00 | 0 | |||||
| 2025-08-15 | 13F | Tower Research Capital LLC (TRC) | 0 | −100,00 | 0 | |||||
| 2025-08-12 | 13F | Steward Partners Investment Advisory, Llc | 8 | 0 | ||||||
| 2025-08-12 | 13F | AI-Squared Management Ltd | 0 | −100,00 | 0 | |||||
| 2025-07-29 | 13F | Virginia Retirement Systems Et Al | 0 | −100,00 | 0 | |||||
| 2025-08-12 | 13F | Proequities, Inc. | Put | 0 | 0 | |||||
| 2025-08-13 | 13F | Walleye Capital LLC | Put | 0 | −100,00 | 0 | ||||
| 2025-08-12 | 13F | Proequities, Inc. | Call | 0 | 0 | |||||
| 2025-08-13 | 13F | Walleye Capital LLC | Call | 0 | −100,00 | 0 | ||||
| 2025-08-12 | 13F | IvyRock Asset Management (HK) Ltd | 0 | −100,00 | 0 | |||||
| 2025-08-12 | 13F | Proequities, Inc. | 0 | 0 | ||||||
| 2025-08-12 | 13F | Coldstream Capital Management Inc | 0 | −100,00 | 0 | |||||
| 2025-08-14 | 13F | Citadel Advisors Llc | Put | 0 | −100,00 | 0 | −100,00 | |||
| 2025-08-28 | NP | NDOW - Anydrus Advantage ETF | 0 | −100,00 | 0 | −100,00 | ||||
| 2025-08-14 | 13F | Ubs Asset Management Americas Inc | 2 836 | 52 | ||||||
| 2025-05-13 | 13F | Norges Bank | 0 | −100,00 | 0 | −100,00 | ||||
| 2025-08-14 | 13F | Susquehanna International Group, Llp | Call | 0 | −100,00 | 0 | ||||
| 2025-08-12 | 13F | Jpmorgan Chase & Co | 10 | 0,00 | 0 | |||||
| 2025-05-13 | 13F | Fox Run Management, L.l.c. | 0 | −100,00 | 0 | −100,00 | ||||
| 2025-05-15 | 13F | Two Sigma Advisers, Lp | 0 | −100,00 | 0 | |||||
| 2025-08-12 | 13F | CIBC Private Wealth Group, LLC | 482 | 0,00 | 9 | 33,33 | ||||
| 2025-04-30 | 13F | Sofos Investments, Inc. | 15 | 0 | ||||||
| 2025-05-15 | 13F | D. E. Shaw & Co., Inc. | 0 | −100,00 | 0 | |||||
| 2025-05-13 | 13F | Qtron Investments LLC | 0 | −100,00 | 0 | |||||
| 2025-08-13 | 13F | EverSource Wealth Advisors, LLC | 2 223 | 37,65 | 41 | 37,93 | ||||
| 2025-08-14 | 13F | Hrt Financial Lp | 0 | −100,00 | 0 | |||||
| 2025-08-14 | 13F | Goldman Sachs Group Inc | 329 456 | 4,45 | 6 003 | 2,91 | ||||
| 2025-06-26 | NP | DFAE - Dimensional Emerging Core Equity Market ETF | 1 100 | 0,00 | 20 | −24,00 | ||||
| 2025-08-12 | 13F | BlackRock, Inc. | 92 307 | −56,76 | 1 682 | −57,41 | ||||
| 2025-07-31 | 13F | Briaud Financial Planning, Inc | 426 | 0 | ||||||
| 2025-06-30 | NP | AIM INTERNATIONAL MUTUAL FUNDS (INVESCO INTERNATIONAL MUTUAL FUNDS) - Invesco Oppenheimer Global Multi-Asset Growth Fund Class R6 | 472 | 74,17 | 9 | 33,33 | ||||
| 2025-08-14 | 13F | Bank Of America Corp /de/ | 220 871 | −54,98 | 4 024 | −55,64 | ||||
| 2025-08-05 | 13F | NewSquare Capital LLC | 34 | 0,00 | 1 | |||||
| 2025-08-12 | 13F | Rhumbline Advisers | 2 013 | 2,18 | 37 | 0,00 | ||||
| 2025-08-13 | 13F | Sequoia China Equity Partners (Hong Kong) Ltd | 974 951 | −23,52 | 17 764 | −24,64 | ||||
| 2025-08-14 | 13F | Susquehanna International Group, Llp | 194 467 | −0,13 | 3 543 | −1,58 | ||||
| 2025-08-28 | NP | SSTIX - State Street Total Return V.I.S. Fund Class 1 Shares | 576 | −58,86 | 10 | −60,00 | ||||
| 2025-08-14 | 13F | Citadel Advisors Llc | 231 025 | 220,17 | 4 209 | 215,52 | ||||
| 2025-08-14 | 13F | Citadel Advisors Llc | Call | 132 000 | 91,30 | 2 405 | 88,63 | |||
| 2025-08-14 | 13F | Susquehanna International Group, Llp | Put | 191 300 | 20,92 | 3 485 | 19,15 | |||
| 2025-08-13 | 13F | Northwestern Mutual Wealth Management Co | 177 | 3 | ||||||
| 2025-08-14 | 13F | Old Mission Capital Llc | 0 | −100,00 | 0 | |||||
| 2025-05-14 | 13F | Taikang Asset Management (Hong Kong) Co Ltd | 0 | −100,00 | 0 | |||||
| 2025-07-24 | 13F | Ronald Blue Trust, Inc. | 170 | −78,37 | 3 | −78,57 | ||||
| 2025-05-15 | 13F | Two Sigma Investments, Lp | 0 | −100,00 | 0 | |||||
| 2025-08-14 | 13F | XY Capital Ltd | 0 | −100,00 | 0 | |||||
| 2025-06-30 | 13F/A | Deutsche Bank Ag\ | 0 | −100,00 | 0 | −100,00 | ||||
| 2025-07-21 | 13F | Qrg Capital Management, Inc. | 0 | −100,00 | 0 | |||||
| 2025-07-28 | NP | NSI - National Security Emerging Markets Index ETF | 825 | 38,66 | 14 | 16,67 | ||||
| 2025-08-12 | 13F | Tairen Capital Ltd | 378 270 | 26,86 | 6 892 | 25,01 | ||||
| 2025-08-29 | NP | JVANX - International Equity Index Trust NAV | 3 276 | 0,00 | 60 | −1,67 | ||||
| 2025-08-14 | 13F | Millennium Management Llc | 363 340 | 207,00 | 6 620 | 202,56 | ||||
| 2025-05-13 | 13F | Schroder Investment Management Group | 0 | −100,00 | 0 | −100,00 | ||||
| 2025-07-09 | 13F | Byrne Asset Management LLC | 0 | −100,00 | 0 | |||||
| 2025-08-11 | 13F | Keystone Investors Pte Ltd | 145 300 | 2 647 | ||||||
| 2025-08-21 | NP | VanEck VIP Trust - VanEck VIP Emerging Markets Fund Initial Class | 56 000 | 27,27 | 1 020 | 25,46 | ||||
| 2025-08-14 | 13F | Davidson Kempner Capital Management Lp | 110 576 | 2 015 | ||||||
| 2025-08-14 | 13F | Bnp Paribas Arbitrage, Sa | 35 516 | −72,18 | 647 | −72,58 | ||||
| 2025-08-08 | 13F | Financial Gravity Companies, Inc. | 7 | −53,33 | 0 | |||||
| 2025-06-24 | NP | TLTE - FlexShares Morningstar Emerging Markets Factor Tilt Index Fund | 1 992 | 0,00 | 36 | −22,22 | ||||
| 2025-08-01 | 13F | Brinker Capital Investments, LLC | 0 | −100,00 | 0 | −100,00 | ||||
| 2025-07-11 | 13F | Farther Finance Advisors, LLC | 96 | −54,72 | 2 | −75,00 | ||||
| 2025-05-06 | 13F | Venturi Wealth Management, LLC | 0 | −100,00 | 0 | |||||
| 2025-08-14 | 13F | Boston Private Wealth Llc | 0 | −100,00 | 0 | |||||
| 2025-05-05 | 13F | Lindbrook Capital, Llc | 34 | −66,34 | 1 | −100,00 | ||||
| 2025-08-14 | 13F/A | Skopos Labs, Inc. | 3 619 | 119,20 | 66 | 116,67 | ||||
| 2025-07-24 | 13F | Us Bancorp \de\ | 4 559 | −33,56 | 83 | −34,13 | ||||
| 2025-04-17 | 13F | Janney Montgomery Scott LLC | 0 | −100,00 | 0 | |||||
| 2025-08-06 | NP | LINCOLN VARIABLE INSURANCE PRODUCTS TRUST - LVIP SSGA Emerging Markets Equity Index Fund Standard Class | 2 865 | 0,00 | 52 | 0,00 | ||||
| 2025-05-15 | 13F | Caption Management, LLC | 0 | −100,00 | 0 | |||||
| 2025-07-29 | 13F | Nordea Investment Management Ab | 397 322 | 5,66 | 7 215 | 3,84 | ||||
| 2025-08-13 | 13F | Walleye Trading LLC | Put | 18 700 | −49,18 | 341 | −50,00 | |||
| 2025-08-13 | 13F | Walleye Trading LLC | Call | 20 500 | −50,96 | 374 | −51,68 | |||
| 2025-05-06 | 13F | Y-Intercept (Hong Kong) Ltd | 0 | −100,00 | 0 | −100,00 | ||||
| 2025-07-25 | 13F | Cwm, Llc | 263 | 115,57 | 0 | |||||
| 2025-05-16 | 13F | Bell Investment Advisors, Inc | 0 | −100,00 | 0 | |||||
| 2025-08-18 | 13F | Wolverine Trading, Llc | Call | 65 400 | 205,61 | 1 165 | 193,45 | |||
| 2025-08-13 | 13F | Walleye Trading LLC | 0 | −100,00 | 0 | −100,00 | ||||
| 2025-08-18 | 13F | Wolverine Trading, Llc | Put | 12 300 | −26,79 | 219 | −29,81 | |||
| 2025-08-14 | 13F | Peak6 Llc | 6 128 | 112 | ||||||
| 2025-07-11 | 13F | UMA Financial Services, Inc. | 0 | −100,00 | 0 | |||||
| 2025-08-28 | NP | GMF - SPDR(R) S&P(R) EMERGING ASIA PACIFIC ETF | 4 295 | −6,53 | 78 | −7,14 | ||||
| 2025-07-31 | 13F | Caitong International Asset Management Co., Ltd | 0 | −100,00 | 0 | |||||
| 2025-08-14 | 13F | Peak6 Llc | Put | 8 700 | 0,00 | 159 | −1,25 | |||
| 2025-08-14 | 13F | Peak6 Llc | Call | 15 200 | −90,16 | 277 | −90,33 | |||
| 2025-08-14 | 13F | Wells Fargo & Company/mn | 597 | −19,97 | 11 | −23,08 | ||||
| 2025-08-12 | 13F | Atlas Capital Advisors Llc | 6 705 | 0,00 | 122 | −0,81 | ||||
| 2025-08-12 | 13F | American Century Companies Inc | 133 224 | 0,45 | 2 427 | −1,02 | ||||
| 2025-08-13 | 13F | Quadrant Capital Group Llc | 41 972 | 12 244,71 | 765 | 12 633,33 | ||||
| 2025-08-14 | 13F | Quantinno Capital Management LP | 34 806 | 72,81 | 634 | 70,43 | ||||
| 2025-05-09 | 13F | J. Safra Sarasin Holding AG | 0 | −100,00 | 0 | |||||
| 2025-05-30 | NP | CGRO - CoreValues Alpha Greater China Growth ETF | 10 438 | −50,82 | 193 | −52,48 | ||||
| 2025-08-14 | 13F | Ameriprise Financial Inc | 14 770 | 1,99 | 269 | 0,75 | ||||
| 2025-07-21 | 13F | Mirae Asset Global Investments Co., Ltd. | 4 043 | 7,30 | 74 | 4,29 | ||||
| 2025-08-14 | 13F | Macquarie Group Ltd | 13 816 | 0,00 | 252 | −1,57 | ||||
| 2025-09-04 | 13F/A | Advisor Group Holdings, Inc. | 351 | 3 800,00 | 6 | |||||
| 2025-08-28 | NP | SPEM - SPDR(R) Portfolio Emerging Markets ETF | 117 786 | 1,94 | 2 146 | 0,47 | ||||
| 2025-05-15 | 13F | Advisors Asset Management, Inc. | 0 | −100,00 | 0 | |||||
| 2025-07-16 | 13F | Signaturefd, Llc | 107 | −36,31 | 2 | −66,67 | ||||
| 2025-05-14 | 13F | Candriam Luxembourg S.C.A. | 0 | −100,00 | 0 | |||||
| 2025-07-24 | 13F | Jfs Wealth Advisors, Llc | 46 | 24,32 | 1 | |||||
| 2025-08-13 | 13F | Victory Capital Management Inc | 11 791 | 0,00 | 215 | −1,83 | ||||
| 2025-08-12 | 13F | LPL Financial LLC | 11 152 | −6,06 | 203 | −7,31 | ||||
| 2025-08-14 | 13F | Fmr Llc | 1 085 | −71,68 | 20 | −72,86 | ||||
| 2025-08-07 | 13F | Aviva Plc | 55 825 | −1,54 | 1 017 | −2,96 | ||||
| 2025-08-08 | 13F | Creative Planning | 16 662 | 45,08 | 304 | 42,92 | ||||
| 2025-04-29 | 13F | Penserra Capital Management LLC | 0 | −100,00 | 0 | |||||
| 2025-08-08 | 13F | SBI Securities Co., Ltd. | 1 094 | 286,57 | 20 | 280,00 | ||||
| 2025-08-14 | 13F | Wexford Capital Lp | 0 | −100,00 | 0 | |||||
| 2025-08-14 | 13F | Toroso Investments, LLC | 0 | −100,00 | 0 | |||||
| 2025-08-13 | 13F | Northern Trust Corp | 22 037 | −6,33 | 402 | −7,60 | ||||
| 2025-08-14 | 13F/A | Barclays Plc | 38 837 | 1 | ||||||
| 2025-08-21 | NP | GBFAX - Emerging Markets Fund Class A | 200 000 | 11,11 | 3 644 | 9,50 | ||||
| 2025-08-14 | 13F | KEYWISE CAPITAL MANAGEMENT (HK) Ltd | 9 335 035 | 1,33 | 170 084 | −0,15 | ||||
| 2025-04-15 | 13F | SG Americas Securities, LLC | 0 | −100,00 | 0 | |||||
| 2025-08-08 | 13F | Pnc Financial Services Group, Inc. | 1 933 | 141,02 | 35 | 150,00 | ||||
| 2025-08-13 | 13F | Russell Investments Group, Ltd. | 10 400 | −36,59 | 189 | −37,62 | ||||
| 2025-08-15 | 13F | Sylebra Capital Llc | 0 | −100,00 | 0 | |||||
| 2025-07-28 | NP | TEMUX - Emerging Markets Equity Fund | 54 000 | 58,82 | 919 | 29,99 | ||||
| 2025-05-14 | 13F | Renaissance Technologies Llc | 0 | −100,00 | 0 | |||||
| 2025-07-28 | NP | AVSE - Avantis Responsible Emerging Markets Equity ETF | 3 339 | 13,30 | 57 | −8,20 | ||||
| 2025-08-14 | 13F | State Street Corp | 928 833 | −19,58 | 16 923 | −20,76 | ||||
| 2025-08-14 | 13F | LMR Partners LLP | 0 | −100,00 | 0 | |||||
| 2025-08-04 | 13F | Hantz Financial Services, Inc. | 2 139 | 3 465,00 | 0 | |||||
| 2025-08-14 | 13F | Raymond James Financial Inc | 299 | 5 | ||||||
| 2025-05-14 | 13F | MY.Alpha Management HK Advisors Ltd | 0 | −100,00 | 0 | |||||
| 2025-08-29 | 13F | Infini Capital Management Ltd | 15 650 | 0,00 | 285 | −1,38 | ||||
| 2025-08-01 | 13F | Envestnet Asset Management Inc | 17 913 | 326 | ||||||
| 2025-05-15 | 13F | Serenity Capital LLC | 463 450 | 8 569 | ||||||
| 2025-05-15 | 13F | Manufacturers Life Insurance Company, The | 0 | −100,00 | 0 | |||||
| 2025-08-14 | 13F | Mariner, LLC | 14 411 | −4,25 | 263 | −5,76 | ||||
| 2025-07-08 | 13F | Parallel Advisors, LLC | 389 | −58,31 | 7 | −58,82 | ||||
| 2025-07-30 | 13F | DekaBank Deutsche Girozentrale | 19 573 | 0,00 | 0 | |||||
| 2025-08-08 | 13F | Alberta Investment Management Corp | 20 100 | 0,00 | 366 | −1,35 | ||||
| 2025-08-13 | 13F | Mackenzie Financial Corp | 129 904 | −32,56 | 2 367 | −33,56 | ||||
| 2025-08-11 | 13F | Principal Securities, Inc. | 0 | −100,00 | 0 | |||||
| 2025-08-11 | 13F | Banque Cantonale Vaudoise | 4 024 | 0,00 | 0 | |||||
| 2025-08-15 | 13F | Morgan Stanley | 1 251 644 | −52,29 | 22 805 | −52,99 | ||||
| 2025-07-24 | 13F | GFG Capital, LLC | 3 165 | 58 | ||||||
| 2025-08-14 | 13F | Linden Advisors Lp | 50 590 | −40,27 | 922 | −41,15 | ||||
| 2025-08-28 | NP | SSGVX - State Street Global Equity ex-U.S. Index Portfolio State Street Global All Cap Equity ex-U.S. Index Portfolio This fund is a listed as child fund of State Street Corp and if that institution has disclosed ownership in this security, then these positions will not be double counted when calculating total shares and total value | 21 700 | 0,00 | 395 | −1,50 | ||||
| 2025-08-14 | 13F | Stifel Financial Corp | 88 114 | 1 605 | ||||||
| 2025-08-14 | 13F | Verition Fund Management LLC | 13 539 | 247 | ||||||
| 2025-08-13 | 13F | Serenity Capital Management Pte. Ltd. | 1 157 662 | 149,79 | 21 093 | 146,14 | ||||
| 2025-06-27 | NP | PGJ - Invesco Golden Dragon China ETF This fund is a listed as child fund of Invesco Ltd. and if that institution has disclosed ownership in this security, then these positions will not be double counted when calculating total shares and total value | 27 918 | −24,74 | 503 | −40,96 | ||||
| 2025-08-28 | NP | SPGM - SPDR(R) Portfolio MSCI Global Stock Market ETF | 372 | 2,48 | 7 | 0,00 | ||||
| 2025-08-28 | NP | SSKEX - State Street Emerging Markets Equity Index Fund Class K This fund is a listed as child fund of State Street Corp and if that institution has disclosed ownership in this security, then these positions will not be double counted when calculating total shares and total value | 6 396 | 0,00 | 117 | −1,69 | ||||
| 2025-08-14 | 13F | Barometer Capital Management Inc. | 16 900 | 43,22 | 308 | 44,13 | ||||
| 2025-08-13 | 13F | Healthcare Of Ontario Pension Plan Trust Fund | 0 | −100,00 | 0 | |||||
| 2025-04-21 | 13F | Nelson, Van Denburg & Campbell Wealth Management Group, LLC | 0 | −100,00 | 0 | |||||
| 2025-08-08 | 13F | Crossmark Global Holdings, Inc. | 679 199 | 12 375 | ||||||
| 2025-05-12 | 13F | Allianz Se | 0 | −100,00 | 0 | −100,00 | ||||
| 2025-07-16 | 13F | Strategic Investment Solutions, Inc. /IL | 100 | 0,00 | 2 | 0,00 | ||||
| 2025-07-22 | 13F | Gsa Capital Partners Llp | 123 531 | 608,52 | 2 | |||||
| 2025-07-28 | NP | AVEEX - Avantis Emerging Markets Equity Fund Institutional Class This fund is a listed as child fund of American Century Companies Inc and if that institution has disclosed ownership in this security, then these positions will not be double counted when calculating total shares and total value | 11 647 | 0,00 | 198 | −18,18 | ||||
| 2025-08-12 | 13F | O'shaughnessy Asset Management, Llc | 0 | −100,00 | 0 | |||||
| 2025-07-16 | 13F | ABS Direct Equity Fund LLC | 0 | −100,00 | 0 | |||||
| 2025-08-14 | 13F | Royal Bank Of Canada | 675 | −97,49 | 12 | −97,59 | ||||
| 2025-08-14 | 13F | Balyasny Asset Management Llc | 208 715 | 3 803 | ||||||
| 2025-04-24 | NP | USEMX - Emerging Markets Fund Shares | 30 465 | −2,96 | 634 | 0,80 | ||||
| 2025-05-14 | 13F | Orion Portfolio Solutions, LLC | 8 460 | 0,00 | 202 | 0,00 | ||||
| 2025-04-24 | NP | USIFX - International Fund Shares | 97 790 | −11,34 | 2 035 | −7,79 | ||||
| 2025-08-14 | 13F | Polymer Capital Management (HK) LTD | 260 053 | 4 738 | ||||||
| 2025-05-13 | 13F | Ethic Inc. | 0 | −100,00 | 0 |