Grundläggande statistik
| Institutionella ägare | 169 total, 169 long only, 0 short only, 0 long/short - change of 17,36% MRQ |
| Genomsnittlig portföljallokering | 0.6566 % - change of 61,13% MRQ |
| Institutionella aktier (lång) | 15 299 678 (ex 13D/G) - change of 7,53MM shares 96,84% MRQ |
| Institutionellt värde (lång) | $ 1 268 475 USD ($1000) |
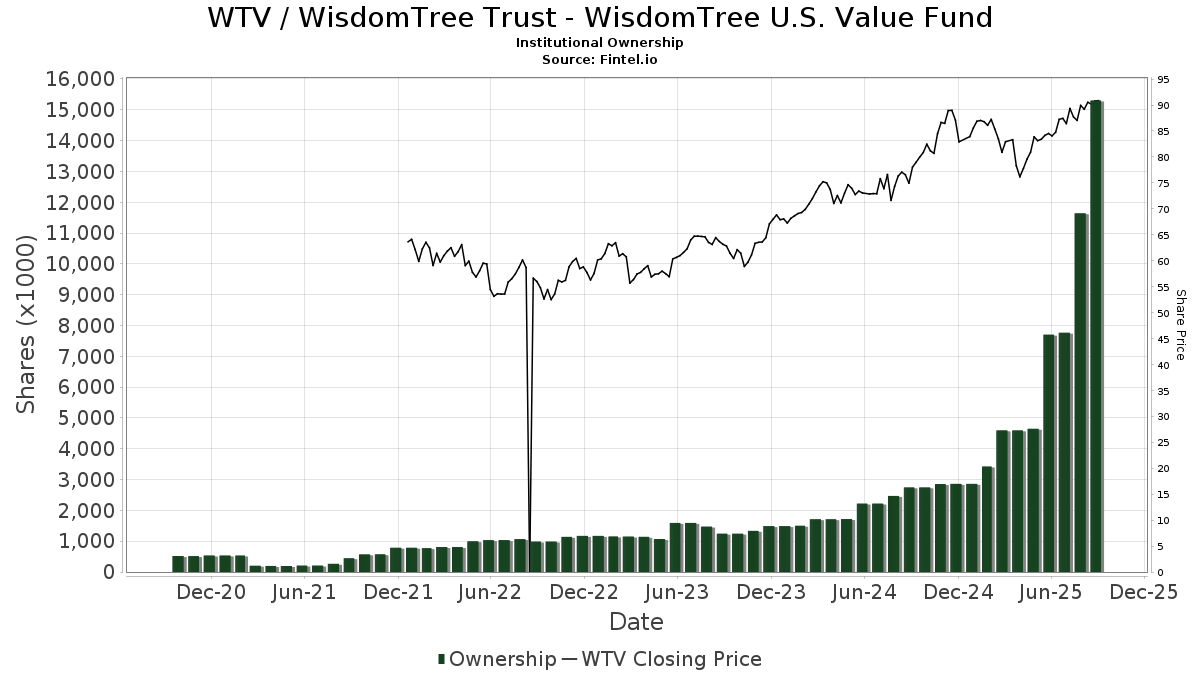
Institutionellt ägande och aktieägare
WisdomTree Trust - WisdomTree U.S. Value Fund (US:WTV) har 169 Institutionella ägare och aktieägare som har lämnat in 13D/G- eller 13F-formulär till Securities Exchange Commission (SEC). Dessa institut innehar totalt 15,299,678 aktier. Största aktieägare inkluderar LPL Financial LLC, Envestnet Asset Management Inc, Advisor Group Holdings, Inc., Raymond James Financial Inc, Smith Anglin Financial, LLC, Morgan Stanley, HighTower Advisors, LLC, Lido Advisors, LLC, Northwestern Mutual Wealth Management Co, and Systelligence, LLC .
WisdomTree Trust - WisdomTree U.S. Value Fund (ARCA:WTV) Institutionell ägarstruktur visar institutioners och fonders nuvarande positioner i företaget, samt de senaste förändringarna i positionernas storlek. Större aktieägare kan vara enskilda investerare, fonder, hedgefonder eller institutioner. Bilaga 13D visar att investeraren äger (eller ägde) mer än 5% av företaget och avser (eller avsåg) att aktivt eftersträva en förändring av affärsstrategin. Schedule 13G indikerar en passiv investering på över 5%.
The share price as of September 19, 2025 is 91,06 / share. Previously, on September 20, 2024, the share price was 79,11 / share. This represents an increase of 15,11% over that period.
Fondsentimentets poäng
Fondsentimentet poängen(fka Ägarackumulation-poäng) visar vilka aktier som är mest köpta av fonder. Det är resultatet av en sofistikerad kvantitativ flerfaktormodell som identifierar företag med de högsta nivåerna av institutionell ackumulering. Poängsättningsmodellen använder en kombination av den totala ökningen av redovisade ägare, förändringarna i portföljallokeringarna för dessa ägare och andra mått. Siffran sträcker sig från 0 till 100, där högre siffror indikerar en högre nivå av ackumulering i förhållande till sina konkurrenter, och 50 är genomsnittet.
Uppdateringsfrekvens: Dagligen
Se Ownership Explorer, som innehåller en lista över de högst rankade företagen.
AI+ Ask Fintel’s AI assistant about WisdomTree Trust - WisdomTree U.S. Value Fund.
Thinking of good questions…
Institutionell sälj/köp-kvot
Förutom att rapportera vanliga eget kapital- och skuldemissioner måste institutioner med mer än 100MM tillgångar under förvaltning också avslöja sina innehav av sälj- och köpoptioner. Eftersom säljoptioner i allmänhet indikerar ett negativt sentiment och köpoptioner indikerar ett positivt sentiment, kan vi få en uppfattning om det övergripande institutionella sentimentet genom att plotta förhållandet mellan säljoptioner och köpoptioner. Diagrammet till höger visar det historiska förhållandet mellan sälj- och köpoptioner för detta instrument.
Genom att använda sälj/köp-kvoten som en indikator på aktieägarnas sentiment undviker man en av de största bristerna med att använda det totala institutionella ägandet, nämligen att en betydande del av de förvaltade tillgångarna investeras passivt för att följa index. Passivt förvaltade fonder köper vanligtvis inte optioner, så indikatorn för sälj/köp-kvoten ger en bättre bild av stämningen i aktivt förvaltade fonder.
13F- och NPORT-arkiveringar
Detaljer om 13F-arkiveringar är gratis. Detaljer om NP-arkiveringar kräver ett premiummedlemskap. Gröna rader indikerar nya positioner. Röda rader indikerar stängda positioner. Klicka på länk symbolen för att se hela transaktionshistoriken.
Uppgradera
för att låsa upp premiumdata och exportera till Excel ![]() .
.
| Fil Datum | Källa | Investerare | Typ | Genomsnittligt pris (beräknat) |
Aktier | Δ Aktier (%) |
Rapporterat värde (1000 USD) |
Δ Värde (%) |
Portföljallokering (%) |
|
|---|---|---|---|---|---|---|---|---|---|---|
| 2025-07-15 | 13F | Armis Advisers, LLC | 11 964 | −19,62 | 1 034 | −15,54 | ||||
| 2025-08-27 | NP | LOWAX - LADENBURG GROWTH & INCOME FUND Class A Shares | 94 096 | 8 130 | ||||||
| 2025-07-10 | 13F | Wealth Enhancement Advisory Services, Llc | 4 359 | 1,73 | 382 | 8,52 | ||||
| 2025-08-26 | NP | EVCLX - The E-Valuator Conservative (15%-30%) RMS Fund Service Class Shares | 5 581 | 45,45 | 482 | 53,02 | ||||
| 2025-08-26 | NP | EVMLX - The E-Valuator Moderate (50%-70%) RMS Fund Service Class Shares | 40 790 | 50,95 | 3 524 | 58,74 | ||||
| 2025-07-25 | 13F | Sequoia Financial Advisors, LLC | 37 286 | 337,58 | 3 222 | 360,14 | ||||
| 2025-09-04 | 13F/A | Advisor Group Holdings, Inc. | 1 205 060 | 1 310,53 | 104 117 | 1 383,36 | ||||
| 2025-07-29 | 13F | Signature Estate & Investment Advisors Llc | 7 263 | 4,04 | 627 | 9,42 | ||||
| 2025-08-04 | 13F | Creative Financial Designs Inc /adv | 347 | 38,80 | 30 | 45,00 | ||||
| 2025-08-08 | 13F | Good Life Advisors, LLC | 10 656 | 17,02 | 921 | 22,99 | ||||
| 2025-08-14 | 13F | Quartz Partners, LLC | 3 666 | −1,77 | 317 | 3,27 | ||||
| 2025-07-07 | 13F | Nova Wealth Management, Inc. | 1 159 | 103,33 | 100 | 117,39 | ||||
| 2025-07-21 | 13F | Hilltop National Bank | 138 | 0,00 | 12 | 0,00 | ||||
| 2025-08-12 | 13F | Global Retirement Partners, LLC | 76 666 | 16,04 | 6 624 | 19,94 | ||||
| 2025-07-17 | 13F | Fifth Third Securities, Inc. | 12 221 | −44,03 | 1 056 | −41,19 | ||||
| 2025-08-12 | 13F | Steward Partners Investment Advisory, Llc | 43 853 | −17,36 | 3 789 | −13,12 | ||||
| 2025-08-15 | 13F | Kestra Advisory Services, LLC | 214 975 | −6,03 | 18 574 | −1,20 | ||||
| 2025-07-23 | 13F | Country Club Bank /gfn | 5 970 | 513 | ||||||
| 2025-08-13 | 13F | Smith, Moore & Co. | 2 930 | 0,00 | 253 | 5,42 | ||||
| 2025-08-14 | 13F | Smartleaf Asset Management LLC | 47 958 | 3,68 | 4 121 | 9,51 | ||||
| 2025-07-21 | 13F | Ameritas Advisory Services, LLC | 5 985 | 112,31 | 517 | 122,84 | ||||
| 2025-08-06 | 13F | Founders Financial Securities Llc | 4 125 | 356 | ||||||
| 2025-07-17 | 13F | PMG Wealth Management, Inc. | 35 043 | 12,26 | 3 028 | 18,01 | ||||
| 2025-08-14 | 13F | Ruggaard & Associates LLC | 84 648 | −6,26 | 7 314 | −1,44 | ||||
| 2025-08-13 | 13F | Valued Retirements, Inc. | 14 785 | 1 277 | ||||||
| 2025-07-08 | 13F | Nbc Securities, Inc. | 30 118 | 2,99 | 3 | 0,00 | ||||
| 2025-07-17 | 13F | XY Planning Network, Inc. | 3 734 | 6,17 | 323 | 11,81 | ||||
| 2025-08-14 | 13F | UBS Group AG | 127 | −96,04 | 11 | −96,20 | ||||
| 2025-08-13 | 13F | Leslie Global Wealth, LLC | 77 597 | −1,05 | 6 704 | 4,05 | ||||
| 2025-08-08 | 13F | Cetera Investment Advisers | 131 104 | 28,20 | 11 327 | 34,80 | ||||
| 2025-07-18 | 13F | Cooper Financial Group | 30 645 | 2 648 | ||||||
| 2025-08-13 | 13F | Lido Advisors, LLC | 310 304 | −3,99 | 26 810 | 0,95 | ||||
| 2025-07-21 | 13F | Patriot Financial Group Insurance Agency, LLC | 3 462 | 3,71 | 299 | 9,12 | ||||
| 2025-08-05 | 13F | Ceera Investments, Llc | 41 436 | 253,10 | 3 580 | 271,37 | ||||
| 2025-08-27 | NP | LNOAX - LADENBURG INCOME & GROWTH FUND Class A Shares | 26 278 | 2 270 | ||||||
| 2025-07-25 | 13F | Envestnet Portfolio Solutions, Inc. | 132 039 | 4 193,95 | 11 408 | 4 426,98 | ||||
| 2025-08-05 | 13F | Sigma Planning Corp | 11 294 | 149,37 | 976 | 162,10 | ||||
| 2025-08-11 | 13F | Covestor Ltd | 106 | 21,84 | 0 | |||||
| 2025-08-12 | 13F | CIBC Private Wealth Group, LLC | 3 774 | 0,00 | 326 | 19,85 | ||||
| 2025-07-07 | 13F | Capital Asset Advisory Services LLC | 119 903 | 10 441 | ||||||
| 2025-07-09 | 13F | Bowman & Co S.C. | 35 729 | 3 087 | ||||||
| 2025-07-17 | 13F | Janney Montgomery Scott LLC | 4 504 | 0 | ||||||
| 2025-08-14 | 13F | Mariner, LLC | 129 687 | 11 205 | ||||||
| 2025-07-18 | 13F | Truist Financial Corp | 47 103 | 4 070 | ||||||
| 2025-07-21 | 13F | Verus Financial Partners, Inc. | 3 918 | 0,00 | 343 | 13,62 | ||||
| 2025-08-27 | 13F/A | Brinker Capital Investments, LLC | 64 246 | 41,61 | 5 551 | 48,91 | ||||
| 2025-08-08 | 13F | TD Capital Management LLC | 81 | 1,25 | 7 | 0,00 | ||||
| 2025-08-13 | 13F | Trustmark National Bank Trust Department | 2 630 | 227 | ||||||
| 2025-07-23 | 13F | REAP Financial Group, LLC | 4 476 | −5,53 | 387 | −0,77 | ||||
| 2025-08-15 | 13F | Equitable Holdings, Inc. | 33 732 | 45,67 | 2 914 | 53,21 | ||||
| 2025-07-08 | 13F | Prism Advisors, Inc. | 202 630 | −20,00 | 17 507 | −15,88 | ||||
| 2025-08-12 | 13F | LPL Financial LLC | 2 007 413 | 37,52 | 173 440 | 44,60 | ||||
| 2025-08-14 | 13F | Avant Capital LLC | 6 293 | 21,75 | 544 | 28,07 | ||||
| 2025-07-30 | 13F | Insight Advisors, LLC/ PA | 83 036 | 91,02 | 7 174 | 100,90 | ||||
| 2025-07-24 | 13F | Us Bancorp \de\ | 220 | 0,00 | 19 | 5,56 | ||||
| 2025-08-04 | 13F | Arkadios Wealth Advisors | 14 142 | 155,82 | 1 222 | 168,94 | ||||
| 2025-08-04 | 13F | Assetmark, Inc | 1 010 | 87 | ||||||
| 2025-08-14 | 13F | Aqr Capital Management Llc | 5 423 | 20,56 | 469 | 26,83 | ||||
| 2025-07-29 | 13F | Koshinski Asset Management, Inc. | 2 520 | 0,00 | 218 | 4,83 | ||||
| 2025-07-24 | 13F | Blair William & Co/il | 244 | 69,44 | 21 | 90,91 | ||||
| 2025-07-17 | 13F | Smith Anglin Financial, LLC | 1 112 973 | 96 161 | ||||||
| 2025-08-14 | 13F | Citadel Advisors Llc | 5 796 | −17,46 | 501 | −13,19 | ||||
| 2025-08-08 | 13F | Kane Investment Management, Inc. | 3 920 | 2,64 | 339 | 7,99 | ||||
| 2025-07-31 | 13F | Cambridge Investment Research Advisors, Inc. | 216 414 | 25,71 | 19 | 28,57 | ||||
| 2025-07-10 | 13F | Wedmont Private Capital | 0 | −100,00 | 0 | |||||
| 2025-08-08 | 13F | Thoroughbred Financial Services, Llc | 11 833 | 94,43 | 1 | |||||
| 2025-08-11 | 13F | Advisor Resource Council | 18 238 | −80,63 | 1 576 | −74,76 | ||||
| 2025-08-11 | 13F | Private Advisor Group, LLC | 74 191 | 8,74 | 6 410 | 14,34 | ||||
| 2025-08-14 | 13F | GWM Advisors LLC | 7 786 | 14,28 | 673 | 20,21 | ||||
| 2025-08-27 | NP | LNCAX - LADENBURG INCOME FUND Class A Shares | 2 260 | 195 | ||||||
| 2025-07-24 | 13F | Trust Co Of Toledo Na /oh/ | 118 248 | 10 217 | ||||||
| 2025-08-04 | 13F | IFG Advisory, LLC | 36 758 | 11,11 | 3 176 | 16,81 | ||||
| 2025-08-07 | 13F | Allworth Financial LP | 783 | 62,11 | 68 | 76,32 | ||||
| 2025-08-06 | 13F | AE Wealth Management LLC | 84 782 | 3,64 | 7 325 | 8,97 | ||||
| 2025-07-15 | 13F | Main Street Group, LTD | 22 | 0,00 | 2 | 0,00 | ||||
| 2025-08-12 | 13F | Solano Wealth Investment Advisors LLC | 13 694 | −42,42 | 1 183 | −39,46 | ||||
| 2025-08-14 | 13F | Royal Bank Of Canada | 5 391 | −7,34 | 466 | −2,51 | ||||
| 2025-08-18 | 13F | Hollencrest Capital Management | 0 | −100,00 | 0 | |||||
| 2025-08-26 | NP | EVVLX - The E-Valuator Very Conservative (0%-15%) RMS Fund Service Class Shares | 1 147 | 85,60 | 99 | 98,00 | ||||
| 2025-08-29 | 13F | Centaurus Financial, Inc. | 4 005 | 0 | ||||||
| 2025-08-14 | 13F | Susquehanna International Group, Llp | 2 798 | −73,73 | 242 | −72,46 | ||||
| 2025-07-31 | 13F | Nilsine Partners, LLC | 32 765 | −21,58 | 2 831 | −17,56 | ||||
| 2025-08-14 | 13F | Modern Wealth Management, LLC | 65 876 | 5,38 | 5 692 | 10,81 | ||||
| 2025-08-08 | 13F | Larson Financial Group LLC | 42 | 4 | ||||||
| 2025-08-14 | 13F | Mml Investors Services, Llc | 84 886 | −14,61 | 7 | −12,50 | ||||
| 2025-05-15 | 13F/A | Orion Portfolio Solutions, LLC | 45 368 | −0,03 | 3 728 | −1,71 | ||||
| 2025-08-06 | 13F | Centerpoint Advisory Group | 4 631 | −3,40 | 400 | 1,78 | ||||
| 2025-08-11 | 13F | Principal Securities, Inc. | 5 422 | 31,95 | 468 | 36,44 | ||||
| 2025-08-04 | 13F | Horizon Wealth Management, LLC | 0 | −100,00 | 0 | |||||
| 2025-07-30 | 13F | Rehmann Capital Advisory Group | 4 615 | −0,11 | 399 | 5,01 | ||||
| 2025-04-17 | 13F | Sound Income Strategies, LLC | 0 | −100,00 | 0 | |||||
| 2025-08-04 | 13F | Atria Investments Llc | 3 876 | −88,34 | 335 | −87,77 | ||||
| 2025-07-24 | 13F | JNBA Financial Advisors | 288 | 25 | ||||||
| 2025-08-06 | 13F | O'Brien Greene & Co. Inc | 4 900 | 0,00 | 423 | 5,22 | ||||
| 2025-07-15 | 13F | Bay Capital Advisors, LLC | 20 713 | 1 790 | ||||||
| 2025-07-18 | 13F | Consolidated Portfolio Review Corp | 4 594 | 397 | ||||||
| 2025-08-12 | 13F | Proequities, Inc. | 0 | 0 | ||||||
| 2025-08-13 | 13F | Cambria Investment Management, L.P. | 0 | −100,00 | 0 | |||||
| 2025-07-25 | 13F | Concurrent Investment Advisors, LLC | 66 046 | 14,35 | 5 706 | 20,25 | ||||
| 2025-08-12 | 13F | Ameritas Investment Partners, Inc. | 119 664 | 7,10 | 10 339 | 12,60 | ||||
| 2025-08-14 | 13F | Ancora Advisors, LLC | 850 | 0,00 | 73 | 5,80 | ||||
| 2025-08-01 | 13F | Envestnet Asset Management Inc | 1 780 632 | 1 256,61 | 153 847 | 1 326,48 | ||||
| 2025-08-26 | NP | EVTTX - The E-Valuator Conservative/Moderate (30%-50%) RMS Fund Service Class Shares | 5 631 | 30,68 | 487 | 37,29 | ||||
| 2025-07-29 | 13F | Private Trust Co Na | 3 705 | 9,94 | 320 | 15,94 | ||||
| 2025-08-11 | 13F | HighTower Advisors, LLC | 666 243 | 57 563 | ||||||
| 2025-05-09 | 13F | Pnc Financial Services Group, Inc. | 0 | −100,00 | 0 | |||||
| 2025-08-05 | 13F | Cherry Tree Wealth Management, LLC | 252 | 22 | ||||||
| 2025-08-12 | 13F | Jpmorgan Chase & Co | 129 660 | 6,96 | 11 203 | 12,47 | ||||
| 2025-07-14 | 13F | Ridgewood Investments LLC | 1 164 | 0,00 | 101 | 5,26 | ||||
| 2025-08-07 | 13F | PCG Wealth Advisors, LLC | 9 950 | 9,97 | 860 | 15,61 | ||||
| 2025-08-14 | 13F | Fmr Llc | 2 | −66,67 | 0 | |||||
| 2025-08-04 | 13F | Integrity Alliance, Llc. | 0 | −100,00 | 0 | |||||
| 2025-07-28 | 13F | Rosenberg Matthew Hamilton | 0 | −100,00 | 0 | |||||
| 2025-07-23 | 13F | Valmark Advisers, Inc. | 15 967 | −0,15 | 1 380 | 5,03 | ||||
| 2025-08-06 | 13F | Commonwealth Equity Services, Llc | 98 683 | 25,39 | 9 | 33,33 | ||||
| 2025-07-14 | 13F | Cathy Pareto & Associates, Inc | 4 090 | −21,24 | 353 | −17,14 | ||||
| 2025-08-13 | 13F | Jones Financial Companies Lllp | 272 | 18,26 | 23 | 27,78 | ||||
| 2025-08-08 | 13F | Capital Investment Advisory Services, LLC | 200 | 0,00 | 17 | 6,25 | ||||
| 2025-08-14 | 13F | Stifel Financial Corp | 177 099 | −45,81 | 15 301 | −43,02 | ||||
| 2025-08-14 | 13F | CoreCap Advisors, LLC | 785 | 36,05 | 68 | 42,55 | ||||
| 2025-07-24 | 13F | IFP Advisors, Inc | 12 736 | 181,65 | 1 101 | 196,50 | ||||
| 2025-08-14 | 13F | Betterment LLC | 0 | −100,00 | 0 | |||||
| 2025-07-22 | 13F | Willner & Heller, Llc | 2 819 | 6,86 | 244 | 12,50 | ||||
| 2025-08-04 | 13F | Pensionmark Financial Group, Llc | 4 103 | −0,34 | 354 | 4,73 | ||||
| 2025-07-30 | 13F | TFB Advisors LLC | 2 485 | 0,00 | 215 | 4,90 | ||||
| 2025-08-12 | 13F | Change Path, LLC | 10 326 | 892 | ||||||
| 2025-07-16 | 13F | ORG Partners LLC | 3 014 | −3,18 | 262 | 2,34 | ||||
| 2025-07-22 | 13F | Beacon Financial Advisory LLC | 5 647 | −16,59 | 488 | −12,41 | ||||
| 2025-08-12 | 13F | Gladstone Institutional Advisory LLC | 3 699 | −25,50 | 320 | −21,81 | ||||
| 2025-04-15 | 13F | Foresight Capital Management Advisors, Inc. | 0 | −100,00 | 0 | |||||
| 2025-08-01 | 13F | Ashton Thomas Private Wealth, LLC | 26 430 | −3,85 | 2 284 | 1,11 | ||||
| 2025-07-28 | 13F | Axxcess Wealth Management, Llc | 120 146 | 10 381 | ||||||
| 2025-04-23 | 13F | Mascagni Wealth Management, Inc. | 0 | −100,00 | 0 | −100,00 | ||||
| 2025-08-11 | 13F | United Advisor Group, LLC | 6 280 | 35,49 | 543 | 42,63 | ||||
| 2025-08-15 | 13F | Morgan Stanley | 876 853 | 20,50 | 75 760 | 26,70 | ||||
| 2025-08-11 | 13F | Anderson Financial Strategies, LLC | 223 687 | 0,53 | 19 327 | 5,71 | ||||
| 2025-07-11 | 13F | Pinnacle Bancorp, Inc. | 70 | 6 | ||||||
| 2025-08-14 | 13F | Wharton Business Group, LLC | 4 885 | 0,00 | 0 | |||||
| 2025-04-29 | 13F | Hm Payson & Co | 0 | −100,00 | 0 | |||||
| 2025-08-27 | NP | LGWAX - LADENBURG GROWTH FUND Class A Shares | 124 975 | 10 798 | ||||||
| 2025-05-12 | 13F | Independent Advisor Alliance | 0 | −100,00 | 0 | |||||
| 2025-08-01 | 13F | Gwn Securities Inc. | 5 408 | 469 | ||||||
| 2025-08-14 | 13F | Wiley Bros.-aintree Capital, Llc | 2 589 | 0,00 | 224 | 6,19 | ||||
| 2025-07-31 | 13F | Oppenheimer & Co Inc | 175 971 | 15 204 | ||||||
| 2025-08-11 | 13F | Regal Investment Advisors LLC | 3 342 | −7,22 | 289 | −2,37 | ||||
| 2025-07-30 | 13F | Onyx Bridge Wealth Group LLC | 175 247 | 15 141 | ||||||
| 2025-08-14 | 13F | Peapack Gladstone Financial Corp | 6 015 | −0,08 | 1 | |||||
| 2025-08-26 | NP | EVAGX - The E-Valuator Aggressive Growth (85%-99%) RMS Fund Service Class Shares | 94 175 | 52,75 | 8 137 | 60,60 | ||||
| 2025-08-14 | 13F | Jane Street Group, Llc | 10 084 | 871 | ||||||
| 2025-08-18 | 13F | Geneos Wealth Management Inc. | 47 335 | −0,85 | 4 090 | 4,26 | ||||
| 2025-07-29 | 13F | Systelligence, LLC | 227 996 | 38,05 | 19 699 | 45,16 | ||||
| 2025-07-25 | 13F | Atria Wealth Solutions, Inc. | 0 | −100,00 | 0 | |||||
| 2025-08-14 | 13F | Wells Fargo & Company/mn | 130 | −0,76 | 11 | 10,00 | ||||
| 2025-08-07 | 13F | Legacy Financial Advisors, Inc. | 222 048 | 2,18 | 19 185 | 7,44 | ||||
| 2025-07-14 | 13F | Hoey Investments, Inc | 870 | 0,00 | 75 | 5,63 | ||||
| 2025-08-19 | 13F | Advisory Services Network, LLC | 8 916 | 777 | ||||||
| 2025-07-15 | 13F | Optima Capital Llc | 70 634 | 11,70 | 6 103 | 17,46 | ||||
| 2025-08-14 | 13F | Great Valley Advisor Group, Inc. | 3 902 | 1,72 | 337 | 6,98 | ||||
| 2025-07-15 | 13F | RVW Wealth, LLC | 9 521 | −0,64 | 823 | 4,45 | ||||
| 2025-08-26 | NP | EVGLX - The E-Valuator Growth (70%-85%) RMS Fund Service Class Shares | 80 672 | 19,13 | 6 970 | 25,27 | ||||
| 2025-08-14 | 13F | Raymond James Financial Inc | 1 144 700 | 65,20 | 98 902 | 73,70 | ||||
| 2025-08-14 | 13F | Goldman Sachs Group Inc | 19 867 | 300,54 | 1 717 | 321,62 | ||||
| 2025-08-11 | 13F | Synergy Investment Management, LLC | 0 | −100,00 | 0 | |||||
| 2025-08-13 | 13F | Northwestern Mutual Wealth Management Co | 307 697 | 246,07 | 26 585 | 263,93 | ||||
| 2025-07-22 | 13F | USAdvisors Wealth Management, LLC | 59 008 | 5 | ||||||
| 2025-07-22 | 13F | Team Financial Group, LLC | 102 598 | 5,85 | 8 864 | 11,30 | ||||
| 2025-05-16 | 13F | Coppell Advisory Solutions LLC | 0 | −100,00 | 0 | |||||
| 2025-08-14 | 13F | Comerica Bank | 1 706 | 20,23 | 147 | 26,72 | ||||
| 2025-07-28 | 13F | Harbour Investments, Inc. | 15 881 | 7,91 | 1 372 | 13,48 | ||||
| 2025-08-11 | 13F | Western Wealth Management, LLC | 10 297 | 34,37 | 890 | 41,34 | ||||
| 2025-08-04 | 13F | Flagship Harbor Advisors, Llc | 129 226 | 22,61 | 11 165 | 28,93 | ||||
| 2025-08-14 | 13F | Integrated Wealth Concepts LLC | 8 743 | −3,18 | 755 | 1,89 | ||||
| 2025-07-29 | 13F | Stratos Wealth Partners, LTD. | 36 041 | −0,36 | 3 114 | 4,74 | ||||
| 2025-08-08 | 13F | Crossmark Global Holdings, Inc. | 25 924 | 0,00 | 2 229 | 4,70 | ||||
| 2025-07-28 | 13F | RFG Advisory, LLC | 13 556 | 12,13 | 1 171 | 17,93 | ||||
| 2025-07-17 | 13F | Tempus Wealth Planning, LLC | 0 | −100,00 | 0 | |||||
| 2025-07-24 | 13F | Morton Brown Family Wealth, LLC | 164 | 0,00 | 14 | 7,69 | ||||
| 2025-07-28 | 13F | Mutual Advisors, LLC | 5 243 | 36,64 | 467 | 54,64 | ||||
| 2025-08-12 | 13F | Financial Advocates Investment Management | 8 600 | −14,68 | 743 | −10,27 | ||||
| 2025-08-26 | 13F/A | Thrivent Financial For Lutherans | 6 330 | 1 | ||||||
| 2025-07-21 | 13F | Ameriflex Group, Inc. | 134 | 0,00 | 11 | 0,00 | ||||
| 2025-07-25 | 13F | LRI Investments, LLC | 5 785 | 0,03 | 500 | 5,05 | ||||
| 2025-08-08 | 13F | Avantax Advisory Services, Inc. | 25 351 | 2 190 | ||||||
| 2025-08-12 | 13F | Walled Lake Planning & Wealth Management, Llc | 7 201 | 66,11 | 622 | 74,72 | ||||
| 2025-07-21 | 13F | Matauro, Llc | 10 788 | 1,76 | 932 | 7,00 | ||||
| 2025-07-25 | 13F | Cwm, Llc | 89 844 | −0,50 | 8 | 0,00 | ||||
| 2025-08-27 | NP | LAWAX - LADENBURG AGGRESSIVE GROWTH FUND Class A Shares | 69 592 | 6 013 |