T.PRA - AT&T Inc. - Preferred Stock Aktier - Aktiekurs, institutionellt ägande, aktieägare (NYSE)

AT&T Inc. - Preferred Stock
US ˙ NYSE ˙ US00206R5081

Grundläggande statistik
Institutionella ägare 36 total, 36 long only, 0 short only, 0 long/short - change of 12,50% MRQ
Genomsnittlig portföljallokering 0.2942 % - change of 2,35% MRQ
Institutionella aktier (lång) 9 945 914 (ex 13D/G) - change of 0,01MM shares 0,07% MRQ
Institutionellt värde (lång) $ 199 719 USD ($1000)
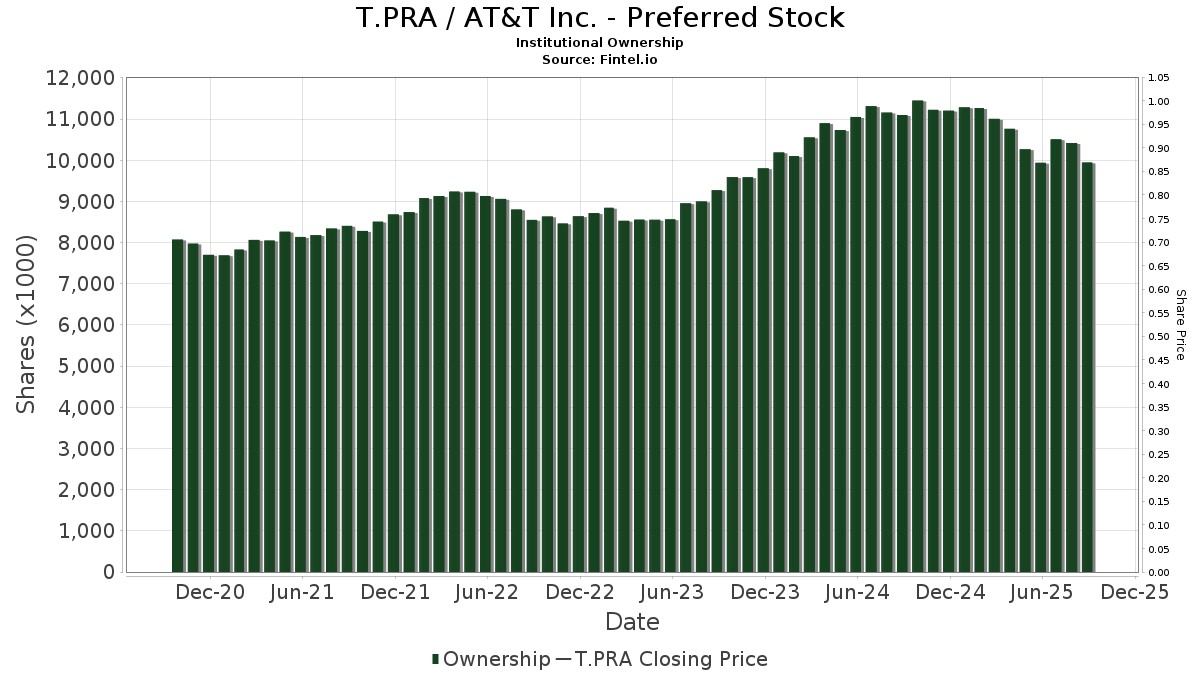
Institutionellt ägande och aktieägare

AT&T Inc. - Preferred Stock (US:T.PRA) har 36 Institutionella ägare och aktieägare som har lämnat in 13D/G- eller 13F-formulär till Securities Exchange Commission (SEC). Dessa institut innehar totalt 9,945,914 aktier. Största aktieägare inkluderar PFF - iShares Preferred and Income Securities ETF, PGX - Invesco Preferred ETF, PFXF - VanEck Vectors Preferred Securities ex Financials ETF, PFFD - Global X U.S. Preferred ETF, Cohen & Steers Tax-Advantaged Preferred Securities & Income Fund, FPE - First Trust Preferred Securities and Income ETF, Cohen & Steers Quality Income Realty Fund Inc, CPXAX - Cohen & Steers Preferred Securities & Income Fund, Inc. Class A, First Trust Intermediate Duration Preferred & Income Fund, and FSDIX - Fidelity Strategic Dividend & Income Fund .

AT&T Inc. - Preferred Stock (NYSE:T.PRA) Institutionell ägarstruktur visar institutioners och fonders nuvarande positioner i företaget, samt de senaste förändringarna i positionernas storlek. Större aktieägare kan vara enskilda investerare, fonder, hedgefonder eller institutioner. Bilaga 13D visar att investeraren äger (eller ägde) mer än 5% av företaget och avser (eller avsåg) att aktivt eftersträva en förändring av affärsstrategin. Schedule 13G indikerar en passiv investering på över 5%.

T.PRA / AT&T Inc. - Preferred Stock Institutional Ownership
Fondsentimentets poäng

Fondsentimentet poängen(fka Ägarackumulation-poäng) visar vilka aktier som är mest köpta av fonder. Det är resultatet av en sofistikerad kvantitativ flerfaktormodell som identifierar företag med de högsta nivåerna av institutionell ackumulering. Poängsättningsmodellen använder en kombination av den totala ökningen av redovisade ägare, förändringarna i portföljallokeringarna för dessa ägare och andra mått. Siffran sträcker sig från 0 till 100, där högre siffror indikerar en högre nivå av ackumulering i förhållande till sina konkurrenter, och 50 är genomsnittet.

Uppdateringsfrekvens: Dagligen

Se Ownership Explorer, som innehåller en lista över de högst rankade företagen.

Institutionell sälj/köp-kvot

Förutom att rapportera vanliga eget kapital- och skuldemissioner måste institutioner med mer än 100MM tillgångar under förvaltning också avslöja sina innehav av sälj- och köpoptioner. Eftersom säljoptioner i allmänhet indikerar ett negativt sentiment och köpoptioner indikerar ett positivt sentiment, kan vi få en uppfattning om det övergripande institutionella sentimentet genom att plotta förhållandet mellan säljoptioner och köpoptioner. Diagrammet till höger visar det historiska förhållandet mellan sälj- och köpoptioner för detta instrument.

Genom att använda sälj/köp-kvoten som en indikator på aktieägarnas sentiment undviker man en av de största bristerna med att använda det totala institutionella ägandet, nämligen att en betydande del av de förvaltade tillgångarna investeras passivt för att följa index. Passivt förvaltade fonder köper vanligtvis inte optioner, så indikatorn för sälj/köp-kvoten ger en bättre bild av stämningen i aktivt förvaltade fonder.

T.PRA / AT&T Inc. - Preferred Stock Historical Put/Call Ratio
13F- och NPORT-arkiveringar

Detaljer om 13F-arkiveringar är gratis. Detaljer om NP-arkiveringar kräver ett premiummedlemskap. Gröna rader indikerar nya positioner. Röda rader indikerar stängda positioner. Klicka på länk symbolen för att se hela transaktionshistoriken.

Uppgradera för att låsa upp premiumdata och exportera till Excel .

Fil Datum Källa Investerare Typ Genomsnittligt pris
(beräknat)
Aktier Δ Aktier
(%)
Rapporterat
värde
(1000 USD)
Δ Värde
(%)
Portföljallokering
(%)
2025-06-25 NP FPEAX - First Trust Preferred Securities and Income Fund Class A This fund is a listed as child fund of First Trust Advisors Lp and if that institution has disclosed ownership in this security, then these positions will not be double counted when calculating total shares and total value 13 671 274
2025-08-08 13F Pnc Financial Services Group, Inc. 787 −24,98 16 −28,57
2025-08-28 NP Cohen & Steers Infrastructure Fund Inc 13 078 0,00 264 −0,38
2025-07-30 NP PFFD - Global X U.S. Preferred ETF This fund is a listed as child fund of Mirae Asset Global Investments Co., Ltd. and if that institution has disclosed ownership in this security, then these positions will not be double counted when calculating total shares and total value 868 869 −4,22 17 325 −10,83
2025-08-28 NP Cohen & Steers Reit & Preferred Income Fund Inc 81 345 0,00 1 639 −0,24
2025-08-28 NP Cohen & Steers Select Preferred & Income Fund, Inc. 24 832 −42,51 500 −42,73
2025-08-28 NP Cohen & Steers Quality Income Realty Fund Inc 188 182 0,00 3 792 −0,32
2025-08-28 NP CSPF - Cohen & Steers Preferred and Income Opportunities Active ETF 1 800 0,00 36 0,00
2025-08-26 NP PFF - iShares Preferred and Income Securities ETF This fund is a listed as child fund of BlackRock Inc. and if that institution has disclosed ownership in this security, then these positions will not be double counted when calculating total shares and total value 3 799 167 −8,14 76 553 −8,41
2025-06-25 NP FPE - First Trust Preferred Securities and Income ETF This fund is a listed as child fund of First Trust Advisors Lp and if that institution has disclosed ownership in this security, then these positions will not be double counted when calculating total shares and total value 403 744 11,81 8 103 8,36
2025-08-13 13F Estabrook Capital Management 4 000 0,00 81 0,00
2025-07-07 13F Thurston, Springer, Miller, Herd & Titak, Inc. 0 −100,00 0
2025-08-28 NP Cohen & Steers Total Return Realty Fund Inc 20 941 0,00 422 −0,47
2025-08-06 13F Ethos Financial Group, LLC 10 750 0,00 217 −4,42
2025-08-14 13F Kelly Lawrence W & Associates Inc/ca 59 300 50,89 1 194 48,75
2025-03-27 NP HFSI - Hartford Sustainable Income ETF 525 31,25 11 25,00
2025-08-15 NP PQDI - Principal Spectrum Tax-Advantaged Dividend Active ETF 11 381 0,00 229 −0,43
2025-07-24 NP FPFD - Fidelity Preferred Securities & Income ETF 18 800 375
2025-04-28 NP JIGDX - Global Bond Fund Class 1 1 315 86,52 28 86,67
2025-03-27 NP HSNCX - THE HARTFORD STRATEGIC INCOME FUND Class C 16 647 0,00 340 −5,82
2025-08-21 NP PFXF - VanEck Vectors Preferred Securities ex Financials ETF 1 469 418 −10,82 29 609 −11,08
2025-06-25 NP First Trust Intermediate Duration Preferred & Income Fund This fund is a listed as child fund of First Trust Advisors Lp and if that institution has disclosed ownership in this security, then these positions will not be double counted when calculating total shares and total value 118 717 2 383
2025-07-29 NP PGX - Invesco Preferred ETF This fund is a listed as child fund of Invesco Ltd. and if that institution has disclosed ownership in this security, then these positions will not be double counted when calculating total shares and total value 1 835 482 −5,88 36 600 −12,38
2025-08-28 NP IPPP - Preferred-Plus ETF 1 199 0,00 24 0,00
2025-07-25 NP PNARX - Spectrum Preferred and Capital Securities Income Fund (f/k/a Preferred Securities) R-3 22 144 82,35 442 69,62
2025-03-27 NP ITTAX - Hartford Multi-Asset Income and Growth Fund Class A 2 575 0,00 53 −5,45
2025-06-25 NP PFFA - Virtus InfraCap U.S. Preferred Stock ETF 1 047 −56,38 21 −57,14
2025-07-24 NP FSDIX - Fidelity Strategic Dividend & Income Fund This fund is a listed as child fund of Fmr Llc and if that institution has disclosed ownership in this security, then these positions will not be double counted when calculating total shares and total value 112 500 44,60 2 244 34,61
2025-08-28 NP Cohen & Steers Real Estate Opportunities & Income Fund 77 972 0,00 1 571 −0,25
2025-07-28 NP QPFF - American Century Quality Preferred ETF This fund is a listed as child fund of American Century Companies Inc and if that institution has disclosed ownership in this security, then these positions will not be double counted when calculating total shares and total value 30 183 −5,13 602 −11,75
2025-06-24 NP Cohen & Steers Tax-Advantaged Preferred Securities & Income Fund 493 265 0,00 9 900 −1,82
2025-08-26 NP JPDRX - JPMorgan Preferred and Income Securities Fund Class R6 40 000 806
2025-06-26 NP JHPI - John Hancock Preferred Income ETF 35 000 702
2025-07-22 NP GPRF - Goldman Sachs Access U.S. Preferred Stock and Hybrid Securities ETF 18 366 17,69 366 9,58
2025-05-29 NP JAEKX - Global Bond Trust NAV 1 760 110,78 36 105,88
2025-03-26 NP Nuveen Preferred & Income Opportunities Fund This fund is a listed as child fund of Nuveen Asset Management, LLC and if that institution has disclosed ownership in this security, then these positions will not be double counted when calculating total shares and total value 20 680 0,00 423 −5,80
2025-05-29 NP CPXAX - Cohen & Steers Preferred Securities & Income Fund, Inc. Class A 126 472 306,24 2 556 290,08
Fintel data has been cited in the following publications:
Daily Mail Fox Business Business Insider Wall Street Journal The Washington Post Bloomberg Financial Times Globe and Mail
NASDAQ.com Reuters The Guardian Associated Press FactCheck.org Snopes Politifact
Federal Register The Intercept Forbes Fortune Magazine TheStreet Time Magazine Canadian Broadcasting Corporation International Business Times
Cambridge University Press Investopedia MarketWatch NY Daily News Entrepreneur Newsweek Barron's El Economista