Grundläggande statistik
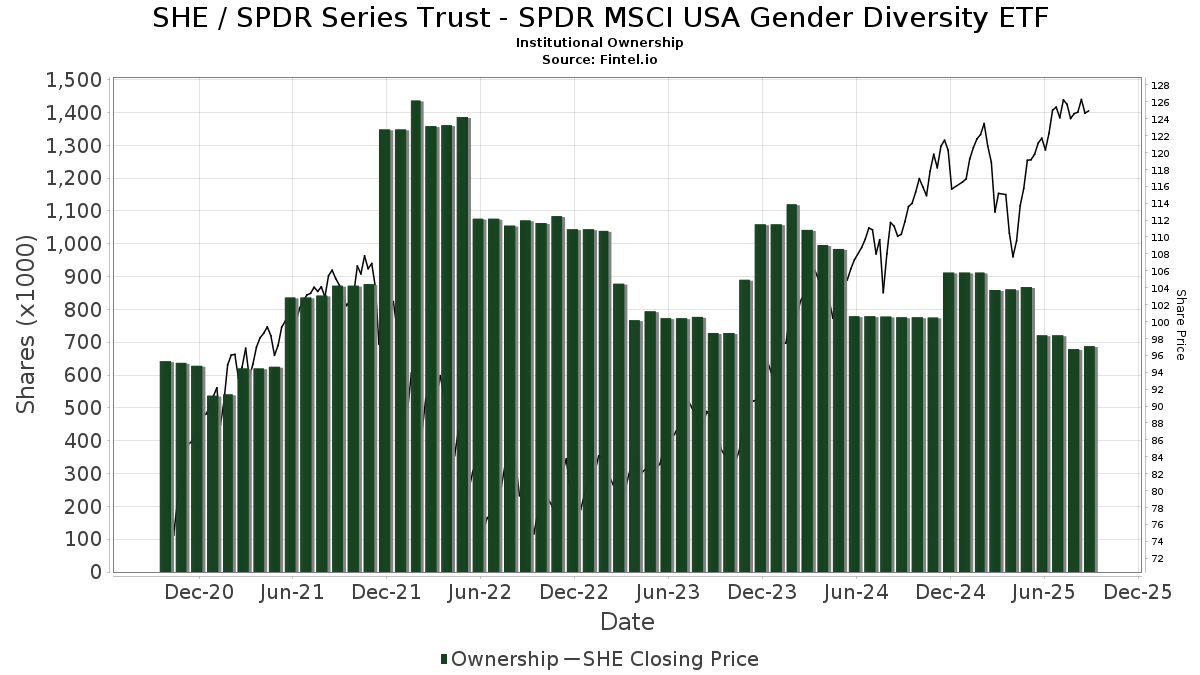
| Institutionella ägare | 111 total, 111 long only, 0 short only, 0 long/short - change of 3,67% MRQ |
| Genomsnittlig portföljallokering | 0.0303 % - change of 6,52% MRQ |
| Institutionella aktier (lång) | 688 883 (ex 13D/G) - change of −0,03MM shares −4,51% MRQ |
| Institutionellt värde (lång) | $ 77 866 USD ($1000) |
Institutionellt ägande och aktieägare
SPDR Series Trust - SPDR MSCI USA Gender Diversity ETF (US:SHE) har 111 Institutionella ägare och aktieägare som har lämnat in 13D/G- eller 13F-formulär till Securities Exchange Commission (SEC). Dessa institut innehar totalt 688,883 aktier. Största aktieägare inkluderar LPL Financial LLC, Morgan Stanley, Bank Of America Corp /de/, Jpmorgan Chase & Co, Betterment LLC, Albion Financial Group /ut, Cetera Investment Advisers, UBS Group AG, Commonwealth Equity Services, Llc, and Royal Bank Of Canada .
SPDR Series Trust - SPDR MSCI USA Gender Diversity ETF (ARCA:SHE) Institutionell ägarstruktur visar institutioners och fonders nuvarande positioner i företaget, samt de senaste förändringarna i positionernas storlek. Större aktieägare kan vara enskilda investerare, fonder, hedgefonder eller institutioner. Bilaga 13D visar att investeraren äger (eller ägde) mer än 5% av företaget och avser (eller avsåg) att aktivt eftersträva en förändring av affärsstrategin. Schedule 13G indikerar en passiv investering på över 5%.
The share price as of September 12, 2025 is 126,00 / share. Previously, on September 13, 2024, the share price was 111,73 / share. This represents an increase of 12,77% over that period.
Fondsentimentets poäng
Fondsentimentet poängen(fka Ägarackumulation-poäng) visar vilka aktier som är mest köpta av fonder. Det är resultatet av en sofistikerad kvantitativ flerfaktormodell som identifierar företag med de högsta nivåerna av institutionell ackumulering. Poängsättningsmodellen använder en kombination av den totala ökningen av redovisade ägare, förändringarna i portföljallokeringarna för dessa ägare och andra mått. Siffran sträcker sig från 0 till 100, där högre siffror indikerar en högre nivå av ackumulering i förhållande till sina konkurrenter, och 50 är genomsnittet.
Uppdateringsfrekvens: Dagligen
Se Ownership Explorer, som innehåller en lista över de högst rankade företagen.
Institutionell sälj/köp-kvot
Förutom att rapportera vanliga eget kapital- och skuldemissioner måste institutioner med mer än 100MM tillgångar under förvaltning också avslöja sina innehav av sälj- och köpoptioner. Eftersom säljoptioner i allmänhet indikerar ett negativt sentiment och köpoptioner indikerar ett positivt sentiment, kan vi få en uppfattning om det övergripande institutionella sentimentet genom att plotta förhållandet mellan säljoptioner och köpoptioner. Diagrammet till höger visar det historiska förhållandet mellan sälj- och köpoptioner för detta instrument.
Genom att använda sälj/köp-kvoten som en indikator på aktieägarnas sentiment undviker man en av de största bristerna med att använda det totala institutionella ägandet, nämligen att en betydande del av de förvaltade tillgångarna investeras passivt för att följa index. Passivt förvaltade fonder köper vanligtvis inte optioner, så indikatorn för sälj/köp-kvoten ger en bättre bild av stämningen i aktivt förvaltade fonder.
13F- och NPORT-arkiveringar
Detaljer om 13F-arkiveringar är gratis. Detaljer om NP-arkiveringar kräver ett premiummedlemskap. Gröna rader indikerar nya positioner. Röda rader indikerar stängda positioner. Klicka på länk symbolen för att se hela transaktionshistoriken.
Uppgradera
för att låsa upp premiumdata och exportera till Excel ![]() .
.
| Fil Datum | Källa | Investerare | Typ | Genomsnittligt pris (beräknat) |
Aktier | Δ Aktier (%) |
Rapporterat värde (1000 USD) |
Δ Värde (%) |
Portföljallokering (%) |
|
|---|---|---|---|---|---|---|---|---|---|---|
| 2025-07-30 | 13F | Fingerlakes Wealth Management, Inc. | 3 870 | −0,08 | 483 | 9,28 | ||||
| 2025-07-30 | 13F | Pittenger & Anderson Inc | 2 475 | 0,00 | 309 | 9,22 | ||||
| 2025-08-14 | 13F | Mariner, LLC | 3 000 | 0,10 | 374 | 9,36 | ||||
| 2025-06-30 | NP | VWITX - Vanguard Intermediate-Term Tax-Exempt Fund Investor Shares This fund is a listed as child fund of Vanguard Group Inc and if that institution has disclosed ownership in this security, then these positions will not be double counted when calculating total shares and total value | 1 167 | 0,00 | ||||||
| 2025-08-01 | 13F | Redwood Park Advisors LLC | 1 | 0,00 | 0 | |||||
| 2025-08-14 | 13F | Mendel Capital Management LLC | 4 037 | 0,00 | 504 | 9,35 | ||||
| 2025-07-25 | 13F | Johnson Investment Counsel Inc | 2 500 | −19,35 | 312 | −11,61 | ||||
| 2025-08-14 | 13F | Sunbelt Securities, Inc. | 548 | −0,18 | 63 | 1,61 | ||||
| 2025-08-14 | 13F | Integrated Wealth Concepts LLC | 3 693 | 21,20 | 461 | 32,56 | ||||
| 2025-08-08 | 13F | Smithfield Trust Co | 24 | 0,00 | 0 | |||||
| 2025-08-06 | 13F | Commonwealth Equity Services, Llc | 12 391 | 36,69 | 2 | 0,00 | ||||
| 2025-07-18 | 13F | Bartlett & Co. Wealth Management Llc | 570 | 0,00 | 71 | 9,23 | ||||
| 2025-08-14 | 13F | Goldman Sachs Group Inc | 0 | −100,00 | 0 | |||||
| 2025-08-18 | 13F | Geneos Wealth Management Inc. | 100 | 0,00 | 12 | 9,09 | ||||
| 2025-07-23 | 13F | Traphagen Investment Advisors Llc | 2 108 | −8,39 | 263 | 0,38 | ||||
| 2025-04-23 | 13F | Financial Life Planners | 0 | −100,00 | 0 | |||||
| 2025-05-08 | 13F | Us Financial Advisors, Llc | 4 363 | 4,68 | 498 | 3,11 | ||||
| 2025-08-12 | 13F | Proequities, Inc. | 0 | 0 | ||||||
| 2025-08-14 | 13F | UBS Group AG | 23 194 | −10,63 | 2 895 | −2,26 | ||||
| 2025-07-31 | 13F | Cambridge Investment Research Advisors, Inc. | 7 497 | 8,75 | 1 | |||||
| 2025-07-29 | 13F | Private Trust Co Na | 1 146 | 0,00 | 143 | 10,00 | ||||
| 2025-07-21 | 13F | Ameritas Advisory Services, LLC | 214 | 27 | ||||||
| 2025-08-14 | 13F | Aprio Wealth Management, LLC | 2 793 | −5,93 | 349 | 2,96 | ||||
| 2025-08-19 | 13F | Asset Dedication, LLC | 12 | 0,00 | 1 | 0,00 | ||||
| 2025-07-24 | 13F | Blair William & Co/il | 1 894 | −94,66 | 236 | −94,17 | ||||
| 2025-08-14 | 13F | Mercer Global Advisors Inc /adv | 2 995 | −2,06 | 374 | 6,88 | ||||
| 2025-08-14 | 13F | Marshall Investment Management, Llc | 0 | −100,00 | 0 | |||||
| 2025-08-01 | 13F | Envestnet Asset Management Inc | 4 509 | −2,82 | 563 | 6,24 | ||||
| 2025-08-05 | 13F | Bank Of Montreal /can/ | 700 | 0,00 | 87 | 10,13 | ||||
| 2025-08-14 | 13F | Camden Capital, LLC | 3 429 | 0,32 | 428 | 9,74 | ||||
| 2025-07-10 | 13F | Global Financial Private Client, LLC | 0 | −100,00 | 0 | |||||
| 2025-08-14 | 13F | Ameriprise Financial Inc | 5 132 | 32,17 | 640 | 33,13 | ||||
| 2025-07-30 | 13F | Princeton Global Asset Management LLC | 523 | 0,38 | 65 | 10,17 | ||||
| 2025-08-14 | 13F | AllSquare Wealth Management LLC | 47 | 0,00 | 6 | 0,00 | ||||
| 2025-07-10 | 13F | CWC Advisors, LLC. | 3 257 | −0,25 | 407 | 9,14 | ||||
| 2025-08-05 | 13F | Bank of New York Mellon Corp | 3 651 | −0,03 | 456 | 9,38 | ||||
| 2025-08-08 | 13F | Laurel Wealth Planning LLC | 5 371 | 2,27 | 670 | 11,85 | ||||
| 2025-07-28 | 13F | Harbour Investments, Inc. | 162 | 0,00 | 20 | 11,11 | ||||
| 2025-07-23 | 13F | Valmark Advisers, Inc. | 2 352 | 4,30 | 294 | 14,01 | ||||
| 2025-08-11 | 13F | Citigroup Inc | 3 852 | −1,83 | 481 | 7,38 | ||||
| 2025-07-28 | 13F | BRYN MAWR TRUST Co | 6 088 | −0,07 | 760 | 9,21 | ||||
| 2025-08-12 | 13F | Steward Partners Investment Advisory, Llc | 460 | 0,00 | 57 | 9,62 | ||||
| 2025-07-17 | 13F | Vermillion Wealth Management, Inc. | 975 | 0,21 | 122 | 9,01 | ||||
| 2025-08-15 | 13F | Kestra Advisory Services, LLC | 5 934 | −2,45 | 741 | 6,63 | ||||
| 2025-08-13 | 13F | Russell Investments Group, Ltd. | 429 | 0,00 | 54 | 10,42 | ||||
| 2025-08-14 | 13F | Comerica Bank | 609 | 0,33 | 76 | 10,14 | ||||
| 2025-09-04 | 13F/A | Advisor Group Holdings, Inc. | 6 587 | −18,12 | 822 | −10,46 | ||||
| 2025-07-25 | 13F | Mitchell Sinkler & Starr/pa | 2 625 | 0,00 | 328 | 9,36 | ||||
| 2025-07-31 | 13F | CVA Family Office, LLC | 8 | 1 | ||||||
| 2025-07-17 | 13F | Wolff Wiese Magana Llc | 5 | 1 | ||||||
| 2025-08-13 | 13F | Twin Peaks Wealth Advisors, LLC | 80 | 10 | ||||||
| 2025-08-13 | 13F | KilterHowling LLC | 2 126 | 0,33 | 265 | 7,72 | ||||
| 2025-08-06 | 13F | Golden State Wealth Management, LLC | 175 | 0,00 | 22 | 10,53 | ||||
| 2025-08-14 | 13F | Bank Of America Corp /de/ | 52 785 | 13,66 | 6 589 | 24,30 | ||||
| 2025-08-14 | 13F | Colony Group, LLC | 3 538 | 442 | ||||||
| 2025-08-26 | 13F/A | Thrivent Financial For Lutherans | 2 180 | 0 | ||||||
| 2025-07-11 | 13F | Caldwell Securities, Inc | 18 | 0,00 | 2 | 0,00 | ||||
| 2025-07-29 | 13F | Mattson Financial Services, LLC | 0 | −100,00 | 0 | |||||
| 2025-08-12 | 13F | MAI Capital Management | 657 | 42,83 | 82 | 57,69 | ||||
| 2025-08-12 | 13F | O'shaughnessy Asset Management, Llc | 0 | −100,00 | 0 | |||||
| 2025-08-04 | 13F | Bristlecone Advisors, LLC | 487 | 0,00 | 61 | 9,09 | ||||
| 2025-08-12 | 13F | Howe & Rusling Inc | 1 562 | 0,00 | 195 | 8,99 | ||||
| 2025-08-12 | 13F | Jpmorgan Chase & Co | 40 949 | −0,07 | 5 111 | 9,28 | ||||
| 2025-07-08 | 13F | Gradient Investments LLC | 6 312 | −19,44 | 788 | −11,97 | ||||
| 2025-07-31 | 13F | Buckingham Strategic Partners | 3 225 | 30,20 | 403 | 42,55 | ||||
| 2025-08-08 | 13F | SBI Securities Co., Ltd. | 108 | 0,00 | 13 | 8,33 | ||||
| 2025-08-12 | 13F | Wood Tarver Financial Group, LLC | 1 687 | 0,00 | 0 | −100,00 | ||||
| 2025-07-10 | 13F | Atticus Wealth Management, Llc | 886 | 0,34 | 111 | 10,00 | ||||
| 2025-08-14 | 13F | Abound Financial, Llc | 1 958 | −13,59 | 244 | −5,43 | ||||
| 2025-08-01 | 13F | Rossby Financial, LCC | 156 | 0,00 | 19 | 11,76 | ||||
| 2025-08-13 | 13F | Jones Financial Companies Lllp | 4 523 | 9,54 | 560 | 19,66 | ||||
| 2025-08-12 | 13F | Franklin Resources Inc | 210 | 0,00 | 26 | 13,04 | ||||
| 2025-08-04 | 13F | Assetmark, Inc | 2 421 | 302 | ||||||
| 2025-08-11 | 13F | Principal Securities, Inc. | 69 | 0,00 | 9 | 14,29 | ||||
| 2025-08-14 | 13F | Betterment LLC | 37 319 | 1,51 | 5 | 0,00 | ||||
| 2025-07-08 | 13F | Parallel Advisors, LLC | 11 | 1 | ||||||
| 2025-08-14 | 13F | Sei Investments Co | 6 501 | −3,89 | 811 | 5,05 | ||||
| 2025-08-14 | 13F | Guardian Wealth Advisors, Llc / Nc | 59 | 0,00 | 7 | 16,67 | ||||
| 2025-08-15 | 13F | Morgan Stanley | 95 528 | −1,67 | 11 924 | 7,54 | ||||
| 2025-07-18 | 13F/A | MJT & Associates Financial Advisory Group, Inc. | 1 062 | −15,91 | 133 | −8,33 | ||||
| 2025-07-11 | 13F | Farther Finance Advisors, LLC | 1 | 0,00 | 0 | |||||
| 2025-08-07 | 13F | Allworth Financial LP | 7 | −41,67 | 1 | −100,00 | ||||
| 2025-08-11 | 13F | HighTower Advisors, LLC | 2 202 | 0,00 | 275 | 9,16 | ||||
| 2025-05-05 | 13F | Lindbrook Capital, Llc | 250 | 0,00 | 29 | 0,00 | ||||
| 2025-07-17 | 13F | Albion Financial Group /ut | 35 429 | 0,39 | 4 422 | 9,81 | ||||
| 2025-07-29 | 13F | Mountain Capital Investment Advisors, Inc | 3 543 | −2,80 | 443 | 8,85 | ||||
| 2025-08-14 | 13F | Clifford Group, LLC | 1 675 | 209 | ||||||
| 2025-07-25 | 13F | Stephens Consulting, LLC | 1 542 | −24,49 | 192 | −17,60 | ||||
| 2025-08-05 | 13F | Huntington National Bank | 0 | |||||||
| 2025-08-12 | 13F | Ameritas Investment Partners, Inc. | 682 | 0,29 | 85 | 10,39 | ||||
| 2025-08-08 | 13F | TD Capital Management LLC | 191 | 0,53 | 24 | 9,52 | ||||
| 2025-08-12 | 13F | Global Retirement Partners, LLC | 22 | −38,89 | 3 | −50,00 | ||||
| 2025-08-29 | 13F | Centaurus Financial, Inc. | 864 | 0 | ||||||
| 2025-07-18 | 13F | PFG Investments, LLC | 2 371 | 0,21 | 296 | 9,26 | ||||
| 2025-07-22 | 13F | Berkshire Money Management, Inc. | 456 | 57 | ||||||
| 2025-05-15 | 13F | Tower Research Capital LLC (TRC) | 0 | −100,00 | 0 | |||||
| 2025-07-14 | 13F | Sowell Financial Services LLC | 2 421 | −6,63 | 302 | 2,37 | ||||
| 2025-08-13 | 13F | Northwestern Mutual Wealth Management Co | 1 289 | −8,97 | 161 | −0,62 | ||||
| 2025-08-14 | 13F | Wells Fargo & Company/mn | 11 872 | −12,47 | 1 482 | −4,33 | ||||
| 2025-08-12 | 13F | LPL Financial LLC | 115 068 | 5,79 | 14 363 | 15,69 | ||||
| 2025-07-10 | 13F | Wealth Enhancement Advisory Services, Llc | 5 283 | −0,36 | 666 | 9,92 | ||||
| 2025-08-08 | 13F | Creative Planning | 1 959 | 0,26 | 245 | 9,42 | ||||
| 2025-08-14 | 13F | Fmr Llc | 2 552 | 142,13 | 319 | 165,00 | ||||
| 2025-08-08 | 13F | Cetera Investment Advisers | 29 387 | 0,01 | 3 668 | 9,39 | ||||
| 2025-08-08 | 13F | Pnc Financial Services Group, Inc. | 282 | 0,00 | 35 | 9,38 | ||||
| 2025-08-14 | 13F | Federation des caisses Desjardins du Quebec | 115 | 0,00 | 14 | 7,69 | ||||
| 2025-08-04 | 13F | Simon Quick Advisors, Llc | 3 000 | 0,00 | 374 | 9,36 | ||||
| 2025-04-23 | 13F | Security National Bank | 0 | −100,00 | 0 | |||||
| 2025-08-14 | 13F | Citadel Advisors Llc | 0 | −100,00 | 0 | |||||
| 2025-08-14 | 13F | Royal Bank Of Canada | 12 296 | −15,37 | 1 535 | −7,42 | ||||
| 2025-08-14 | 13F | Susquehanna International Group, Llp | 11 107 | 52,32 | 1 386 | 66,59 | ||||
| 2025-07-29 | 13F | Sincerus Advisory, LLC | 1 587 | 201 | ||||||
| 2025-08-12 | 13F | Pathstone Holdings, LLC | 1 841 | 0,00 | 230 | 9,05 | ||||
| 2025-08-11 | 13F | Bell Investment Advisors, Inc | 6 663 | 0,41 | 832 | 9,78 | ||||
| 2025-05-13 | 13F | Rock Creek Group, LP | 0 | −100,00 | 0 | |||||
| 2025-07-25 | 13F | Cwm, Llc | 2 352 | −70,65 | 0 | |||||
| 2025-07-14 | 13F | Sentinel Pension Advisors Inc | 0 | −100,00 | 0 | |||||
| 2025-08-13 | 13F | Congress Wealth Management LLC / DE / | 5 049 | 14,18 | 630 | 25,00 | ||||
| 2025-08-14 | 13F | Raymond James Financial Inc | 10 314 | 16,89 | 1 287 | 27,81 | ||||
| 2025-08-14 | 13F | Glenmede Investment Management, LP | 92 | 11 | ||||||
| 2025-08-15 | 13F | Captrust Financial Advisors | 3 878 | 0,00 | 484 | 9,50 | ||||
| 2025-07-15 | 13F | Compagnie Lombard Odier SCmA | 0 | −100,00 | 0 | |||||
| 2025-07-11 | 13F | Grove Bank & Trust | 1 886 | 0,00 | 235 | 9,30 | ||||
| 2025-07-31 | 13F | Wealthfront Advisers Llc | 6 083 | 2,51 | 759 | 12,11 | ||||
| 2025-08-06 | 13F | AE Wealth Management LLC | 17 | 0,00 | 2 | 100,00 | ||||
| 2025-08-11 | 13F | Aptus Capital Advisors, LLC | 533 | 2,11 | 67 | 11,86 |
Other Listings
| MX:SHE |