Grundläggande statistik
| Institutionella ägare | 140 total, 140 long only, 0 short only, 0 long/short - change of 20,51% MRQ |
| Genomsnittlig portföljallokering | 0.1335 % - change of 62,54% MRQ |
| Institutionella aktier (lång) | 9 817 320 (ex 13D/G) - change of 3,65MM shares 59,30% MRQ |
| Institutionellt värde (lång) | $ 260 896 USD ($1000) |
Institutionellt ägande och aktieägare
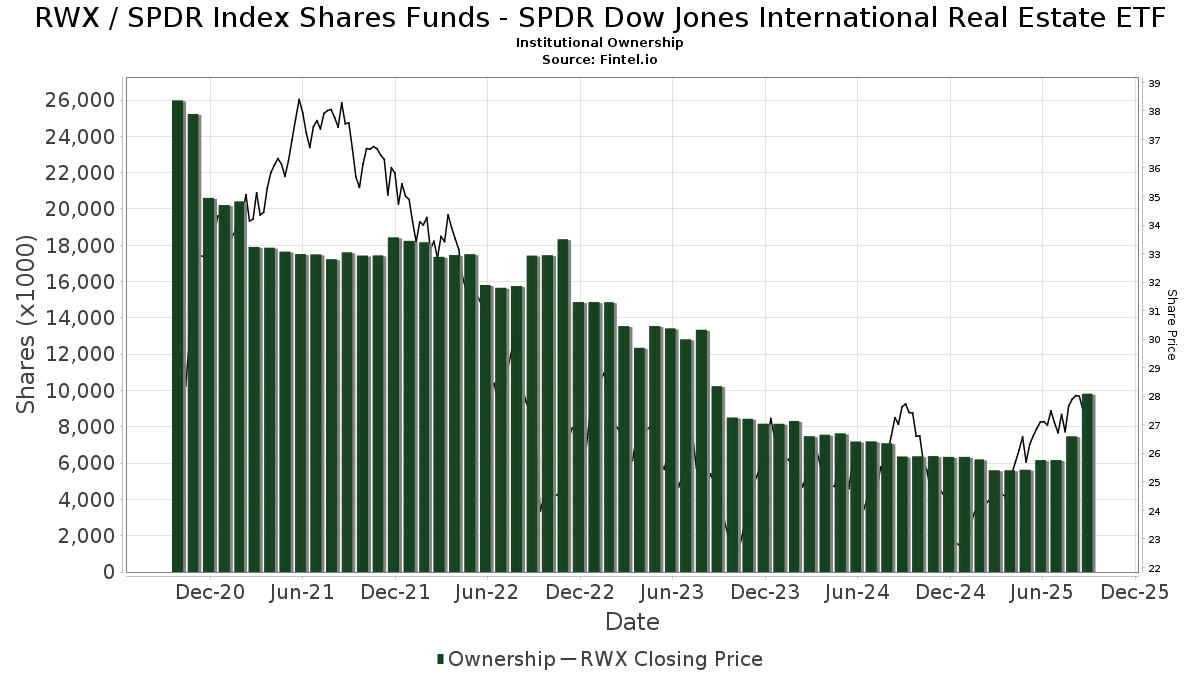
SPDR Index Shares Funds - SPDR Dow Jones International Real Estate ETF (US:RWX) har 140 Institutionella ägare och aktieägare som har lämnat in 13D/G- eller 13F-formulär till Securities Exchange Commission (SEC). Dessa institut innehar totalt 9,817,320 aktier. Största aktieägare inkluderar State Street Corp, Osborne Partners Capital Management, Llc, Morgan Stanley, Northern Trust Corp, Envestnet Portfolio Solutions, Inc., LPL Financial LLC, RLY - SPDR SSGA Multi-Asset Real Return ETF, Envestnet Asset Management Inc, Assetmark, Inc, and Wells Fargo & Company/mn .
SPDR Index Shares Funds - SPDR Dow Jones International Real Estate ETF (ARCA:RWX) Institutionell ägarstruktur visar institutioners och fonders nuvarande positioner i företaget, samt de senaste förändringarna i positionernas storlek. Större aktieägare kan vara enskilda investerare, fonder, hedgefonder eller institutioner. Bilaga 13D visar att investeraren äger (eller ägde) mer än 5% av företaget och avser (eller avsåg) att aktivt eftersträva en förändring av affärsstrategin. Schedule 13G indikerar en passiv investering på över 5%.
The share price as of September 11, 2025 is 28,22 / share. Previously, on September 12, 2024, the share price was 27,79 / share. This represents an increase of 1,55% over that period.
Fondsentimentets poäng
Fondsentimentet poängen(fka Ägarackumulation-poäng) visar vilka aktier som är mest köpta av fonder. Det är resultatet av en sofistikerad kvantitativ flerfaktormodell som identifierar företag med de högsta nivåerna av institutionell ackumulering. Poängsättningsmodellen använder en kombination av den totala ökningen av redovisade ägare, förändringarna i portföljallokeringarna för dessa ägare och andra mått. Siffran sträcker sig från 0 till 100, där högre siffror indikerar en högre nivå av ackumulering i förhållande till sina konkurrenter, och 50 är genomsnittet.
Uppdateringsfrekvens: Dagligen
Se Ownership Explorer, som innehåller en lista över de högst rankade företagen.
Institutionell sälj/köp-kvot
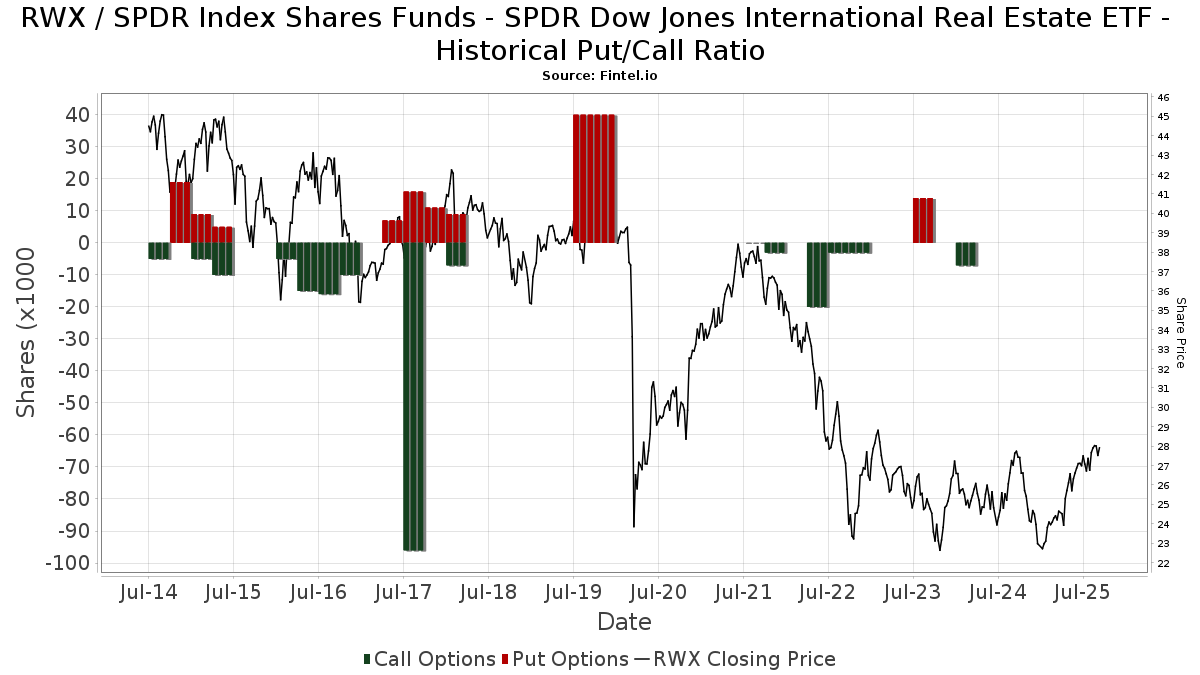
Förutom att rapportera vanliga eget kapital- och skuldemissioner måste institutioner med mer än 100MM tillgångar under förvaltning också avslöja sina innehav av sälj- och köpoptioner. Eftersom säljoptioner i allmänhet indikerar ett negativt sentiment och köpoptioner indikerar ett positivt sentiment, kan vi få en uppfattning om det övergripande institutionella sentimentet genom att plotta förhållandet mellan säljoptioner och köpoptioner. Diagrammet till höger visar det historiska förhållandet mellan sälj- och köpoptioner för detta instrument.
Genom att använda sälj/köp-kvoten som en indikator på aktieägarnas sentiment undviker man en av de största bristerna med att använda det totala institutionella ägandet, nämligen att en betydande del av de förvaltade tillgångarna investeras passivt för att följa index. Passivt förvaltade fonder köper vanligtvis inte optioner, så indikatorn för sälj/köp-kvoten ger en bättre bild av stämningen i aktivt förvaltade fonder.
13F- och NPORT-arkiveringar
Detaljer om 13F-arkiveringar är gratis. Detaljer om NP-arkiveringar kräver ett premiummedlemskap. Gröna rader indikerar nya positioner. Röda rader indikerar stängda positioner. Klicka på länk symbolen för att se hela transaktionshistoriken.
Uppgradera
för att låsa upp premiumdata och exportera till Excel ![]() .
.
| Fil Datum | Källa | Investerare | Typ | Genomsnittligt pris (beräknat) |
Aktier | Δ Aktier (%) |
Rapporterat värde (1000 USD) |
Δ Värde (%) |
Portföljallokering (%) |
|
|---|---|---|---|---|---|---|---|---|---|---|
| 2025-08-05 | 13F | Westside Investment Management, Inc. | 12 | 0,00 | 0 | |||||
| 2025-08-04 | 13F | Creative Financial Designs Inc /adv | 228 | 6 | ||||||
| 2025-08-11 | 13F | HighTower Advisors, LLC | 21 633 | 593 | ||||||
| 2025-08-14 | 13F | Royal Bank Of Canada | 28 619 | 44,67 | 785 | 62,53 | ||||
| 2025-08-13 | 13F | GeoWealth Management, LLC | 10 124 | 277 | ||||||
| 2025-08-13 | 13F | Northwestern Mutual Wealth Management Co | 7 266 | −47,99 | 199 | −41,64 | ||||
| 2025-05-15 | 13F | Creative Planning | 0 | −100,00 | 0 | |||||
| 2025-08-07 | 13F | Allworth Financial LP | 344 | 0,00 | 9 | 12,50 | ||||
| 2025-08-14 | 13F/A | Rockefeller Capital Management L.P. | 25 773 | −6,31 | 706 | 4,90 | ||||
| 2025-07-28 | 13F | Private Wealth Asset Management, LLC | 219 | 0,00 | 6 | 0,00 | ||||
| 2025-08-08 | 13F | SBI Securities Co., Ltd. | 7 304 | 0,08 | 200 | 12,36 | ||||
| 2025-08-18 | 13F | Front Row Advisors LLC | 187 | −32,73 | 5 | −16,67 | ||||
| 2025-04-21 | 13F | Nelson, Van Denburg & Campbell Wealth Management Group, LLC | 0 | −100,00 | 0 | |||||
| 2025-08-15 | 13F | Provenance Wealth Advisors, LLC | 0 | −100,00 | 0 | |||||
| 2025-07-24 | 13F | Horizon Bancorp Inc /in/ | 208 | 0,00 | 0 | |||||
| 2025-04-29 | 13F | Truist Financial Corp | 0 | −100,00 | 0 | |||||
| 2025-07-11 | 13F | Pinnacle Bancorp, Inc. | 1 400 | 0,00 | 38 | 11,76 | ||||
| 2025-07-17 | 13F | Raleigh Capital Management Inc. | 24 879 | 682 | ||||||
| 2025-07-23 | 13F | Indiana Trust & Investment Management CO | 0 | −100,00 | 0 | |||||
| 2025-08-27 | NP | Brighthouse Funds Trust I - SSGA Growth ETF Portfolio Class A | 267 964 | 7 342 | ||||||
| 2025-05-12 | 13F | Kohmann Bosshard Financial Services, LLC | 0 | −100,00 | 0 | |||||
| 2025-07-14 | 13F | Farmers & Merchants Investments Inc | 539 | 0,00 | 15 | 7,69 | ||||
| 2025-07-25 | 13F | Richardson Financial Services Inc. | 14 577 | 375,60 | 401 | 433,33 | ||||
| 2025-07-18 | 13F | Bridge Generations Wealth Management Llc | 398 | −49,62 | 11 | −47,37 | ||||
| 2025-08-14 | 13F | Raymond James Financial Inc | 2 970 | 81 | ||||||
| 2025-07-28 | 13F | Harbour Investments, Inc. | 23 340 | 640 | ||||||
| 2025-08-11 | 13F | Citigroup Inc | 2 542 | 0,00 | 70 | 11,29 | ||||
| 2025-08-13 | 13F | RPg Family Wealth Advisory, LLC | 86 584 | −1,96 | 2 372 | 9,76 | ||||
| 2025-08-14 | 13F | Novus Advisors, Llc | 8 563 | 235 | ||||||
| 2025-07-24 | 13F | Us Bancorp \de\ | 6 834 | 0,00 | 187 | 11,98 | ||||
| 2025-08-12 | 13F | CIBC Private Wealth Group, LLC | 0 | −100,00 | 0 | |||||
| 2025-08-18 | 13F | Pacific Center for Financial Services | 47 | 0,00 | 1 | 0,00 | ||||
| 2025-08-01 | 13F | Austin Private Wealth, LLC | 65 043 | 1 782 | ||||||
| 2025-08-14 | 13F | Sunbelt Securities, Inc. | 129 | 0,00 | 3 | −33,33 | ||||
| 2025-08-12 | 13F | Global Retirement Partners, LLC | 500 | 24 900,00 | 14 | |||||
| 2025-04-15 | 13F | Paladin Advisory Group, LLC | 0 | −100,00 | 0 | |||||
| 2025-08-12 | 13F | Steward Partners Investment Advisory, Llc | 29 | 0,00 | 1 | |||||
| 2025-05-01 | 13F | Quest 10 Wealth Builders, Inc. | 29 | −67,78 | 1 | −100,00 | ||||
| 2025-08-14 | 13F | Citadel Advisors Llc | 18 740 | 513 | ||||||
| 2025-07-21 | 13F | Ameritas Advisory Services, LLC | 70 | 2 | ||||||
| 2025-07-31 | 13F | Schoolcraft Capital LLC | 93 346 | −19,52 | 2 558 | −9,93 | ||||
| 2025-07-29 | 13F | Aspiriant, Llc | 11 657 | 0,00 | 319 | 11,93 | ||||
| 2025-07-24 | 13F | IFP Advisors, Inc | 2 088 | 57 | ||||||
| 2025-07-23 | 13F | Valmark Advisers, Inc. | 15 168 | −51,96 | 416 | −46,24 | ||||
| 2025-08-07 | 13F | New England Private Wealth Advisors LLC | 23 987 | 0,00 | 642 | 9,20 | ||||
| 2025-07-28 | 13F | Mutual Advisors, LLC | 31 347 | 846 | ||||||
| 2025-07-07 | 13F | Investors Research Corp | 20 998 | −0,28 | 575 | 11,65 | ||||
| 2025-08-05 | 13F | Mission Wealth Management, Lp | 18 618 | −7,41 | 510 | 3,66 | ||||
| 2025-04-30 | 13F | Phillips Financial Management, Llc | 0 | −100,00 | 0 | |||||
| 2025-07-31 | 13F | Jackson Hole Capital Partners, LLC | 196 | 0,51 | 5 | 25,00 | ||||
| 2025-08-11 | 13F | Bellwether Advisors, LLC | 53 | 0,00 | 1 | 0,00 | ||||
| 2025-07-31 | 13F | Money Design Co.,Ltd. | 160 839 | −6,34 | 4 | 0,00 | ||||
| 2025-08-14 | 13F | D. E. Shaw & Co., Inc. | 227 893 | 6 244 | ||||||
| 2025-08-12 | 13F | LPL Financial LLC | 460 687 | 1 604,23 | 12 623 | 1 809,53 | ||||
| 2025-08-12 | 13F | MAI Capital Management | 16 | 0,00 | 0 | |||||
| 2025-08-18 | 13F | Geneos Wealth Management Inc. | 897 | 0,00 | 25 | 14,29 | ||||
| 2025-09-04 | 13F | Beacon Capital Management, Inc. | 735 | 20 | ||||||
| 2025-08-13 | 13F | M&t Bank Corp | 84 901 | −37,16 | 2 326 | −29,69 | ||||
| 2025-08-04 | 13F | Savvy Advisors, Inc. | 14 995 | −4,34 | 411 | 7,05 | ||||
| 2025-08-14 | 13F | Logan Stone Capital, LLC | 10 317 | −3,73 | 283 | 7,63 | ||||
| 2025-07-09 | 13F | Breakwater Investment Management | 766 | 12,15 | 21 | 25,00 | ||||
| 2025-07-16 | 13F | Moisand Fitzgerald Tamayo, LLC | 489 | 0,62 | 13 | 18,18 | ||||
| 2025-08-04 | 13F | Assetmark, Inc | 335 510 | 233,93 | 9 193 | 273,81 | ||||
| 2025-08-12 | 13F | Jpmorgan Chase & Co | 4 227 | 8,72 | 116 | 21,05 | ||||
| 2025-07-23 | 13F | Bear Mountain Capital, Inc. | 5 360 | −6,77 | 143 | −4,67 | ||||
| 2025-08-28 | NP | GAL - SPDR SSGA Global Allocation ETF This fund is a listed as child fund of State Street Corp and if that institution has disclosed ownership in this security, then these positions will not be double counted when calculating total shares and total value | 141 710 | 228,18 | 3 883 | 218,72 | ||||
| 2025-08-14 | 13F | Fairview Capital Investment Management, Llc | 18 860 | −2,00 | 517 | 9,55 | ||||
| 2025-05-14 | 13F | Huntington National Bank | 12 | 9,09 | ||||||
| 2025-07-30 | 13F | Cullen/frost Bankers, Inc. | 617 | 17 | ||||||
| 2025-08-04 | 13F | Spire Wealth Management | 25 665 | −0,08 | 703 | 11,94 | ||||
| 2025-07-07 | 13F | Upper Left Wealth Management, LLC | 38 383 | 31,59 | 1 052 | 47,20 | ||||
| 2025-08-14 | 13F | Smartleaf Asset Management LLC | 669 | 3 421,05 | 18 | |||||
| 2025-08-11 | 13F | Principal Securities, Inc. | 1 953 | 54 | ||||||
| 2025-08-13 | 13F | Continuum Advisory, LLC | 0 | −100,00 | 0 | |||||
| 2025-05-01 | 13F | Coastal Investment Advisors, Inc. | 0 | −100,00 | 0 | |||||
| 2025-08-05 | 13F | NewSquare Capital LLC | 111 | 3 | ||||||
| 2025-08-14 | 13F | CoreCap Advisors, LLC | 8 | −27,27 | 0 | |||||
| 2025-07-28 | 13F | Copia Wealth Management | 23 | 0,00 | 1 | |||||
| 2025-08-11 | 13F | Pin Oak Investment Advisors Inc | 47 | 0,00 | 0 | |||||
| 2025-08-11 | 13F | Covestor Ltd | 84 | 0 | ||||||
| 2025-07-10 | 13F | Global Financial Private Client, LLC | 8 217 | 225 | ||||||
| 2025-07-17 | 13F | City Holding Co | 500 | 0,00 | 14 | 8,33 | ||||
| 2025-08-14 | 13F | Susquehanna International Group, Llp | 0 | −100,00 | 0 | |||||
| 2025-08-14 | 13F | Jane Street Group, Llc | 41 747 | 306,53 | 1 144 | 355,38 | ||||
| 2025-04-23 | 13F | Mascagni Wealth Management, Inc. | 0 | −100,00 | 0 | −100,00 | ||||
| 2025-08-14 | 13F | Gould Capital, LLC | 167 | −10,70 | 5 | 0,00 | ||||
| 2025-08-14 | 13F | Wells Fargo & Company/mn | 319 613 | −7,79 | 8 757 | 3,21 | ||||
| 2025-07-28 | 13F | Innova Wealth Partners | 247 509 | 135,12 | 6 782 | 163,24 | ||||
| 2025-08-14 | 13F | Mercer Global Advisors Inc /adv | 14 330 | 1,02 | 393 | 12,97 | ||||
| 2025-08-05 | 13F | Landmark Wealth Management, Inc. | 36 434 | 998 | ||||||
| 2025-04-18 | 13F | Colorado Capital Management, Inc. | 0 | −100,00 | 0 | |||||
| 2025-07-10 | 13F | Wealth Enhancement Advisory Services, Llc | 22 207 | 4,83 | 609 | 17,57 | ||||
| 2025-08-14 | 13F | Ameriprise Financial Inc | 9 287 | −4,87 | 254 | 6,72 | ||||
| 2025-07-10 | 13F | Signal Advisors Wealth, LLC | 26 247 | 719 | ||||||
| 2025-08-27 | NP | RLY - SPDR SSGA Multi-Asset Real Return ETF This fund is a listed as child fund of State Street Corp and if that institution has disclosed ownership in this security, then these positions will not be double counted when calculating total shares and total value | 419 745 | 729,72 | 11 501 | 829,00 | ||||
| 2025-07-11 | 13F | Farther Finance Advisors, LLC | 207 | 6 | ||||||
| 2025-09-04 | 13F/A | Advisor Group Holdings, Inc. | 38 017 | 805,81 | 994 | 874,51 | ||||
| 2025-07-22 | 13F | Awm Capital, Llc | 158 393 | −19,97 | 4 340 | −10,43 | ||||
| 2025-08-14 | 13F | Bank Of America Corp /de/ | 79 408 | −41,19 | 2 176 | −34,19 | ||||
| 2025-07-21 | 13F | Empirical Financial Services, LLC d.b.a. Empirical Wealth Management | 7 913 | −19,73 | 217 | −10,37 | ||||
| 2025-07-02 | 13F/A | Bank Of Nova Scotia | 0 | −100,00 | 0 | |||||
| 2025-08-13 | 13F | Consultiva Wealth Management, Corp. | 450 | 0,00 | 12 | 9,09 | ||||
| 2025-08-14 | 13F | State Street Corp | 2 043 085 | 184,65 | 55 981 | 218,61 | ||||
| 2025-08-14 | 13F | Colony Group, LLC | 14 376 | −90,64 | 394 | −89,55 | ||||
| 2025-04-25 | 13F | Smallwood Wealth Investment Management, LLC | 134 | 3 | ||||||
| 2025-08-11 | 13F | Private Advisor Group, LLC | 14 877 | −15,40 | 408 | −5,35 | ||||
| 2025-07-09 | 13F | VisionPoint Advisory Group, LLC | 11 131 | 305 | ||||||
| 2025-07-15 | 13F | Fifth Third Bancorp | 2 119 | 0,00 | 58 | 13,73 | ||||
| 2025-08-08 | 13F | Pnc Financial Services Group, Inc. | 7 974 | 300,70 | 218 | 354,17 | ||||
| 2025-08-14 | 13F | Boston Private Wealth Llc | 0 | −100,00 | 0 | |||||
| 2025-08-29 | 13F | Evolution Wealth Management Inc. | 100 | 3 | ||||||
| 2025-08-06 | 13F | Savant Capital, LLC | 25 065 | −5,91 | 687 | 5,21 | ||||
| 2025-07-24 | 13F | Eastern Bank | 5 000 | 0,00 | 137 | 12,30 | ||||
| 2025-05-12 | 13F | Virtu Financial LLC | 0 | −100,00 | 0 | |||||
| 2025-08-18 | 13F/A | National Bank Of Canada /fi/ | 159 | −80,59 | 4 | −78,95 | ||||
| 2025-07-14 | 13F | Park Avenue Securities Llc | 116 413 | 3 | ||||||
| 2025-08-14 | 13F | Old Mission Capital Llc | 0 | −100,00 | 0 | |||||
| 2025-07-22 | 13F | Aspire Private Capital, LLC | 42 411 | 1 162 | ||||||
| 2025-08-01 | 13F | Motco | 242 | 0,00 | 6 | 20,00 | ||||
| 2025-07-31 | 13F | Glass Jacobson Investment Advisors llc | 0 | −100,00 | 0 | |||||
| 2025-05-14 | 13F | Oarsman Capital, Inc. | 0 | −100,00 | 0 | |||||
| 2025-08-12 | 13F | Franklin Resources Inc | 184 | 0,00 | 5 | 25,00 | ||||
| 2025-08-14 | 13F | UBS Group AG | 82 571 | −12,91 | 2 262 | −2,50 | ||||
| 2025-08-12 | 13F | DiMeo Schneider & Associates, L.L.C. | 15 345 | 420 | ||||||
| 2025-08-14 | 13F | Goldman Sachs Group Inc | 33 503 | 918 | ||||||
| 2025-08-08 | 13F | Cetera Investment Advisers | 26 977 | 739 | ||||||
| 2025-08-12 | 13F | Proequities, Inc. | 0 | 0 | ||||||
| 2025-07-08 | 13F/A | Salem Investment Counselors Inc | 142 | 0,00 | 4 | 0,00 | ||||
| 2025-07-25 | 13F | Cwm, Llc | 1 739 | −49,21 | 0 | |||||
| 2025-08-12 | 13F | SRS Capital Advisors, Inc. | 33 | 0,00 | 1 | |||||
| 2025-08-13 | 13F | Northern Trust Corp | 538 763 | −8,81 | 14 762 | 2,07 | ||||
| 2025-08-15 | 13F | Kestra Advisory Services, LLC | 54 051 | 1,54 | 1 481 | 13,66 | ||||
| 2025-08-19 | 13F | Cape Investment Advisory, Inc. | 144 | 1,41 | 4 | 0,00 | ||||
| 2025-05-16 | 13F/A | Kestra Investment Management, LLC | 0 | −100,00 | 0 | |||||
| 2025-07-14 | 13F | Maryland Capital Advisors Inc. | 15 040 | −29,88 | 412 | −21,52 | ||||
| 2025-08-12 | 13F | Richard W. Paul & Associates, LLC | 1 378 | 38 | ||||||
| 2025-07-25 | 13F | Envestnet Portfolio Solutions, Inc. | 515 868 | 14 135 | ||||||
| 2025-07-30 | 13F | Strategic Investment Management, Llc | 0 | −100,00 | 0 | |||||
| 2025-08-13 | 13F | Transce3nd, LLC | 183 | 5 | ||||||
| 2025-08-14 | 13F | Federation des caisses Desjardins du Quebec | 115 | 0,00 | 3 | 50,00 | ||||
| 2025-08-18 | 13F | Hollencrest Capital Management | 26 | 0,00 | 1 | |||||
| 2025-08-14 | 13F | Comerica Bank | 12 153 | 2,80 | 333 | 14,88 | ||||
| 2025-07-07 | 13F | Aletheian Wealth Advisors LLC | 31 043 | 0,00 | 851 | 11,99 | ||||
| 2025-07-15 | 13F | Mather Group, Llc. | 0 | −100,00 | 0 | |||||
| 2025-08-01 | 13F | Envestnet Asset Management Inc | 387 405 | 2 145,70 | 10 615 | 2 415,17 | ||||
| 2025-07-28 | 13F | Frazier Financial Advisors, LLC | 22 | 4,76 | 1 | |||||
| 2025-07-15 | 13F | Ballentine Partners, LLC | 90 659 | 95,61 | 2 484 | 119,05 | ||||
| 2025-08-12 | 13F | Osborne Partners Capital Management, Llc | 1 171 696 | −11,22 | 32 104 | −0,63 | ||||
| 2025-08-13 | 13F | Jones Financial Companies Lllp | 490 | 36,87 | 13 | 62,50 | ||||
| 2025-08-05 | 13F | Bank Of Montreal /can/ | 17 695 | 66,23 | 485 | 86,15 | ||||
| 2025-08-15 | 13F | Morgan Stanley | 881 779 | −0,37 | 24 161 | 11,52 | ||||
| 2025-08-13 | 13F | EverSource Wealth Advisors, LLC | 525 | 1 212,50 | 14 | |||||
| 2025-07-21 | 13F | Ascent Group, LLC | 8 731 | 239 | ||||||
| 2025-07-31 | 13F | Cambridge Investment Research Advisors, Inc. | 11 209 | 0 | ||||||
| 2025-08-14 | 13F | Fmr Llc | 0 | −100,00 | 0 | |||||
| 2025-05-05 | 13F | Lindbrook Capital, Llc | 0 | −100,00 | 0 | |||||
| 2025-07-24 | 13F | Blair William & Co/il | 785 | −46,92 | 22 | −41,67 | ||||
| 2025-08-13 | 13F | Idaho Trust Bank | 110 008 | 19,87 | 3 013 | 34,21 | ||||
| 2025-08-06 | 13F | Florin Court Capital LLP | 64 023 | 66,22 | 1 754 | 86,20 | ||||
| 2025-08-08 | 13F | Capital Investment Advisory Services, LLC | 528 | 0,00 | 14 | 16,67 | ||||
| 2025-08-14 | 13F | GWM Advisors LLC | 55 001 | 33 033,13 | 1 507 | 37 575,00 | ||||
| 2025-07-29 | 13F | Salomon & Ludwin, LLC | 27 | −49,06 | 1 | −100,00 | ||||
| 2025-08-15 | 13F | CI Private Wealth, LLC | 13 964 | 53,75 | 383 | 72,07 | ||||
| 2025-08-15 | 13F | Tower Research Capital LLC (TRC) | 0 | −100,00 | 0 | |||||
| 2025-07-29 | 13F | Private Trust Co Na | 746 | 18,04 | 20 | 33,33 | ||||
| 2025-08-12 | 13F | Change Path, LLC | 15 527 | 425 | ||||||
| 2025-08-13 | 13F | Baker Avenue Asset Management, LP | 109 628 | −2,64 | 3 004 | 8,96 | ||||
| 2025-08-06 | 13F | AE Wealth Management LLC | 15 278 | 2 931,35 | 419 | 3 383,33 |