Grundläggande statistik
| Institutionella ägare | 121 total, 115 long only, 4 short only, 2 long/short - change of −9,02% MRQ |
| Genomsnittlig portföljallokering | 0.1620 % - change of −14,89% MRQ |
| Institutionella aktier (lång) | 8 442 335 (ex 13D/G) - change of −1,04MM shares −10,96% MRQ |
| Institutionellt värde (lång) | $ 175 081 USD ($1000) |
Institutionellt ägande och aktieägare
iShares Trust - iShares Mortgage Real Estate ETF (US:REM) har 121 Institutionella ägare och aktieägare som har lämnat in 13D/G- eller 13F-formulär till Securities Exchange Commission (SEC). Dessa institut innehar totalt 8,442,348 aktier. Största aktieägare inkluderar Wells Fargo & Company/mn, Morgan Stanley, Envestnet Asset Management Inc, Bank Of America Corp /de/, Bnp Paribas Arbitrage, Sa, Advisor Group Holdings, Inc., Evergreen Capital Management Llc, Ameriprise Financial Inc, LPL Financial LLC, and VisionPoint Advisory Group, LLC .
iShares Trust - iShares Mortgage Real Estate ETF (BATS:REM) Institutionell ägarstruktur visar institutioners och fonders nuvarande positioner i företaget, samt de senaste förändringarna i positionernas storlek. Större aktieägare kan vara enskilda investerare, fonder, hedgefonder eller institutioner. Bilaga 13D visar att investeraren äger (eller ägde) mer än 5% av företaget och avser (eller avsåg) att aktivt eftersträva en förändring av affärsstrategin. Schedule 13G indikerar en passiv investering på över 5%.
The share price as of September 11, 2025 is 23,32 / share. Previously, on September 12, 2024, the share price was 23,75 / share. This represents a decline of 1,81% over that period.

Fondsentimentets poäng
Fondsentimentet poängen(fka Ägarackumulation-poäng) visar vilka aktier som är mest köpta av fonder. Det är resultatet av en sofistikerad kvantitativ flerfaktormodell som identifierar företag med de högsta nivåerna av institutionell ackumulering. Poängsättningsmodellen använder en kombination av den totala ökningen av redovisade ägare, förändringarna i portföljallokeringarna för dessa ägare och andra mått. Siffran sträcker sig från 0 till 100, där högre siffror indikerar en högre nivå av ackumulering i förhållande till sina konkurrenter, och 50 är genomsnittet.
Uppdateringsfrekvens: Dagligen
Se Ownership Explorer, som innehåller en lista över de högst rankade företagen.
Institutionell sälj/köp-kvot
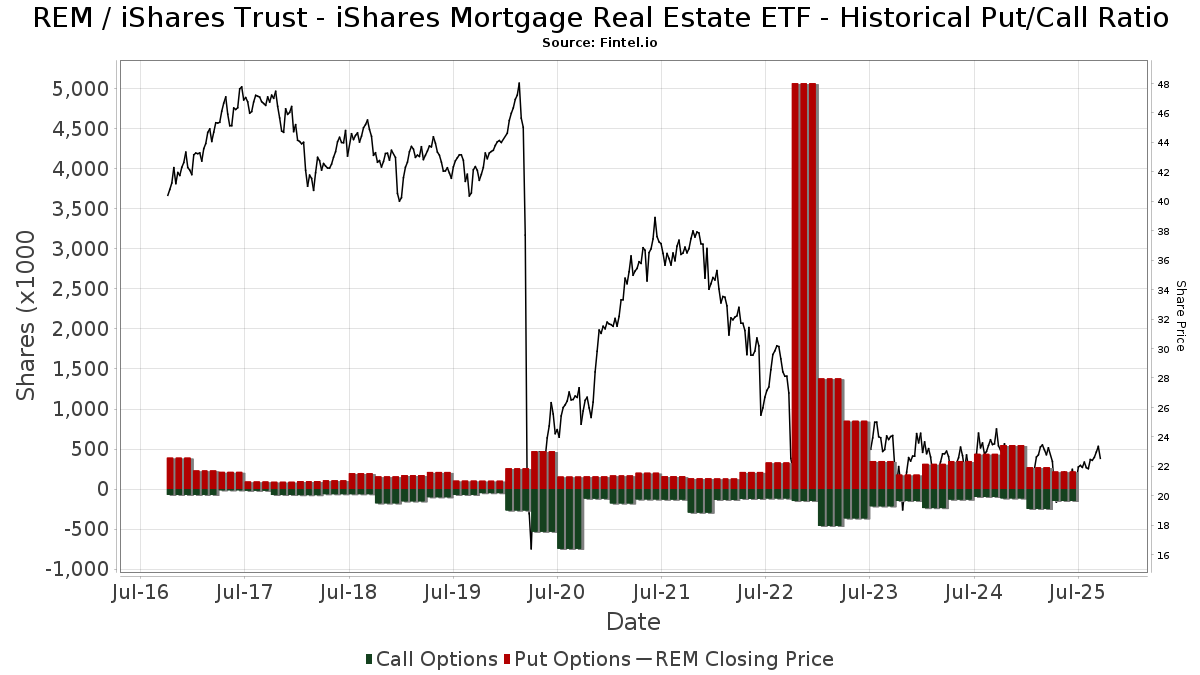
Förutom att rapportera vanliga eget kapital- och skuldemissioner måste institutioner med mer än 100MM tillgångar under förvaltning också avslöja sina innehav av sälj- och köpoptioner. Eftersom säljoptioner i allmänhet indikerar ett negativt sentiment och köpoptioner indikerar ett positivt sentiment, kan vi få en uppfattning om det övergripande institutionella sentimentet genom att plotta förhållandet mellan säljoptioner och köpoptioner. Diagrammet till höger visar det historiska förhållandet mellan sälj- och köpoptioner för detta instrument.
Genom att använda sälj/köp-kvoten som en indikator på aktieägarnas sentiment undviker man en av de största bristerna med att använda det totala institutionella ägandet, nämligen att en betydande del av de förvaltade tillgångarna investeras passivt för att följa index. Passivt förvaltade fonder köper vanligtvis inte optioner, så indikatorn för sälj/köp-kvoten ger en bättre bild av stämningen i aktivt förvaltade fonder.
13F- och NPORT-arkiveringar
Detaljer om 13F-arkiveringar är gratis. Detaljer om NP-arkiveringar kräver ett premiummedlemskap. Gröna rader indikerar nya positioner. Röda rader indikerar stängda positioner. Klicka på länk symbolen för att se hela transaktionshistoriken.
Uppgradera
för att låsa upp premiumdata och exportera till Excel ![]() .
.
| Fil Datum | Källa | Investerare | Typ | Genomsnittligt pris (beräknat) |
Aktier | Δ Aktier (%) |
Rapporterat värde (1000 USD) |
Δ Värde (%) |
Portföljallokering (%) |
|
|---|---|---|---|---|---|---|---|---|---|---|
| 2025-07-16 | 13F/A | CX Institutional | 402 | 1,26 | 0 | |||||
| 2025-08-14 | 13F | Mariner, LLC | 20 854 | −32,59 | 446 | −35,88 | ||||
| 2025-08-14 | 13F | Susquehanna International Group, Llp | Put | 70 200 | 1,74 | 1 501 | −3,10 | |||
| 2025-08-14 | 13F | Susquehanna International Group, Llp | 54 226 | −7,77 | 1 159 | −12,13 | ||||
| 2025-07-09 | 13F | VisionPoint Advisory Group, LLC | 203 395 | −3,45 | 4 349 | −8,02 | ||||
| 2025-08-14 | 13F | Susquehanna International Group, Llp | Call | 112 600 | −27,73 | 2 407 | −31,15 | |||
| 2025-05-13 | 13F | EverSource Wealth Advisors, LLC | 0 | −100,00 | 0 | |||||
| 2025-08-04 | 13F | Spire Wealth Management | 96 | 0,00 | 2 | 0,00 | ||||
| 2025-08-14 | 13F | UBS Group AG | 172 058 | 15,01 | 3 679 | 9,56 | ||||
| 2025-05-14 | 13F | Oarsman Capital, Inc. | 0 | −100,00 | 0 | −100,00 | ||||
| 2025-08-12 | 13F | Proequities, Inc. | 0 | 0 | ||||||
| 2025-07-15 | 13F | Fifth Third Bancorp | 212 | 0,00 | 5 | 0,00 | ||||
| 2025-08-14 | 13F | Fwl Investment Management, Llc | 14 061 | −25,57 | 301 | −29,08 | ||||
| 2025-07-30 | 13F | Mid-American Wealth Advisory Group, Inc. | 269 | 6 | ||||||
| 2025-08-18 | 13F | Wolverine Trading, Llc | Put | 0 | −100,00 | 0 | −100,00 | |||
| 2025-08-14 | 13F | Smartleaf Asset Management LLC | 900 | 19 | ||||||
| 2025-08-08 | 13F | Cetera Investment Advisers | 35 672 | 17,69 | 763 | 12,06 | ||||
| 2025-08-12 | 13F | LPL Financial LLC | 219 571 | 10,84 | 4 694 | 5,60 | ||||
| 2025-07-21 | 13F | DHJJ Financial Advisors, Ltd. | 50 | 0,00 | 1 | 0,00 | ||||
| 2025-08-07 | 13F | Kestra Private Wealth Services, Llc | 32 954 | −41,32 | 705 | −44,13 | ||||
| 2025-08-12 | 13F | CIBC Private Wealth Group, LLC | 0 | −100,00 | 0 | |||||
| 2025-05-29 | NP | SYMIX - AlphaCentric Symmetry Strategy Fund Class I | 16 147 | 85,92 | 362 | 95,68 | ||||
| 2025-08-13 | 13F | Bayview Asset Management, Llc | Put | 71 500 | 1 529 | |||||
| 2025-08-14 | 13F | Goldman Sachs Group Inc | 0 | −100,00 | 0 | |||||
| 2025-08-11 | 13F | Synergy Investment Management, LLC | 0 | −100,00 | 0 | |||||
| 2025-07-17 | 13F | Barry Investment Advisors, LLC | 144 845 | −0,54 | 3 097 | −5,23 | ||||
| 2025-07-29 | 13F | Salomon & Ludwin, LLC | 247 | 0,00 | 5 | 0,00 | ||||
| 2025-07-30 | 13F | Drive Wealth Management, Llc | 142 151 | 388,95 | 3 039 | 366,10 | ||||
| 2025-07-08 | 13F | Nbc Securities, Inc. | 11 231 | 0,00 | 0 | |||||
| 2025-07-18 | 13F | Clarity Financial LLC | 145 019 | −40,80 | 3 101 | −43,60 | ||||
| 2025-08-14 | 13F | Macquarie Group Ltd | 35 243 | 11 766,33 | 753 | 12 450,00 | ||||
| 2025-08-07 | 13F | Cascade Financial Partners, LLC | 17 450 | 0,00 | 373 | −4,60 | ||||
| 2025-08-13 | 13F | Lido Advisors, LLC | 12 637 | 0,93 | 270 | −3,57 | ||||
| 2025-07-28 | 13F | Harbour Investments, Inc. | 84 876 | 10,51 | 1 815 | 5,28 | ||||
| 2025-08-11 | 13F | PFG Private Wealth Management, LLC | 0 | −100,00 | 0 | |||||
| 2025-08-13 | 13F | Townsquare Capital Llc | 0 | −100,00 | 0 | |||||
| 2025-07-11 | 13F | Farther Finance Advisors, LLC | 1 528 | 239,56 | 33 | 220,00 | ||||
| 2025-08-14 | 13F | Citadel Advisors Llc | Call | 13 800 | 79,22 | 295 | 71,51 | |||
| 2025-08-08 | 13F | Avantax Advisory Services, Inc. | 24 691 | −22,69 | 528 | −26,40 | ||||
| 2025-08-14 | 13F | Citadel Advisors Llc | 37 897 | −77,53 | 810 | −78,59 | ||||
| 2025-08-14 | 13F | Citadel Advisors Llc | Put | 66 800 | −63,68 | 1 428 | −65,39 | |||
| 2025-08-14 | 13F | Federation des caisses Desjardins du Quebec | 576 | 0,00 | 12 | 0,00 | ||||
| 2025-08-14 | 13F | Two Sigma Securities, Llc | 0 | −100,00 | 0 | |||||
| 2025-08-14 | 13F | Fmr Llc | 275 | −25,68 | 6 | −37,50 | ||||
| 2025-07-25 | 13F | Endowment Wealth Management, Inc. | 9 565 | 205 | ||||||
| 2025-08-14 | 13F | Raymond James Financial Inc | 133 338 | 85,26 | 2 851 | 76,47 | ||||
| 2025-07-30 | 13F | Phillips Financial Management, Llc | 0 | −100,00 | 0 | |||||
| 2025-07-25 | 13F | Cwm, Llc | 2 346 | 0,26 | 0 | |||||
| 2025-08-14 | 13F | IHT Wealth Management, LLC | 51 797 | 0,07 | 1 107 | −4,65 | ||||
| 2025-08-14 | 13F | Evergreen Capital Management Llc | 321 751 | 6,03 | 6 879 | 1,03 | ||||
| 2025-08-14 | 13F/A | Rockefeller Capital Management L.P. | 10 340 | 1,10 | 221 | −3,49 | ||||
| 2025-08-06 | 13F | Commonwealth Equity Services, Llc | 11 225 | −28,38 | 0 | |||||
| 2025-08-11 | 13F | Mount Lucas Management LP | 0 | −100,00 | 0 | |||||
| 2025-08-14 | 13F | Quantessence Capital LLC | 23 470 | 502 | ||||||
| 2025-07-16 | 13F | ORG Wealth Partners, LLC | 589 | 0,00 | 13 | −7,69 | ||||
| 2025-08-14 | 13F | Group One Trading, L.p. | 0 | −100,00 | 0 | |||||
| 2025-07-14 | 13F | Park Avenue Securities Llc | 25 183 | 1 | ||||||
| 2025-08-07 | 13F | Allworth Financial LP | 68 | 3,03 | 1 | 0,00 | ||||
| 2025-08-26 | 13F/A | Thrivent Financial For Lutherans | 10 950 | −57,15 | 0 | |||||
| 2025-06-26 | NP | FIXP - FolioBeyond Enhanced Fixed Income Premium ETF | 27 807 | −47,25 | 592 | −49,79 | ||||
| 2025-08-12 | 13F | Steward Partners Investment Advisory, Llc | 279 | −76,24 | 6 | −80,77 | ||||
| 2025-08-14 | 13F | Millennium Management Llc | 0 | −100,00 | 0 | |||||
| 2025-08-27 | NP | RYDEX VARIABLE TRUST - Multi-Hedge Strategies Fund Variable Annuity | Short | −8 | −71,43 | −0 | ||||
| 2025-08-14 | 13F | Bnp Paribas Arbitrage, Sa | 397 414 | 4 415 611,11 | 8 497 | |||||
| 2025-08-13 | 13F | Baker Avenue Asset Management, LP | 0 | −100,00 | 0 | |||||
| 2025-05-13 | 13F | SFI Advisors, LLC | 0 | −100,00 | 0 | |||||
| 2025-07-28 | 13F | BRYN MAWR TRUST Co | 375 | 0,00 | 8 | 0,00 | ||||
| 2025-08-14 | 13F | Robinson Capital Management, Llc | 29 420 | 18,45 | 629 | 13,74 | ||||
| 2025-05-06 | 13F | Wedbush Securities Inc | 0 | −100,00 | 0 | |||||
| 2025-07-17 | 13F/A | Capital Investment Advisors, LLC | 39 499 | −11,95 | 844 | −16,10 | ||||
| 2025-07-15 | 13F | Fortitude Family Office, LLC | 223 | 48,67 | 5 | 33,33 | ||||
| 2025-08-12 | 13F | Global Retirement Partners, LLC | 783 | 347,43 | 17 | 433,33 | ||||
| 2025-03-12 | 13F/A | Private Capital Management Llc | 0 | −100,00 | 0 | |||||
| 2025-07-22 | 13F | Wealthcare Advisory Partners LLC | 33 758 | 1,05 | 722 | −3,74 | ||||
| 2025-08-13 | 13F | Russell Investments Group, Ltd. | 74 | −23,71 | 2 | −50,00 | ||||
| 2025-08-14 | 13F | Comerica Bank | 14 880 | 12,48 | 318 | 7,43 | ||||
| 2025-08-28 | NP | TFAFX - Tactical Growth Allocation Fund Class I | 1 980 | 23,75 | 42 | 20,00 | ||||
| 2025-07-07 | 13F | Investors Research Corp | 177 | 0,00 | 4 | 0,00 | ||||
| 2025-08-06 | 13F | Golden State Wealth Management, LLC | 149 | 2,76 | 3 | 0,00 | ||||
| 2025-07-28 | 13F | Bridges Investment Management Inc | 66 044 | 38,99 | 1 412 | 32,46 | ||||
| 2025-08-14 | 13F | Mml Investors Services, Llc | 114 073 | 4,73 | 2 | 0,00 | ||||
| 2025-07-21 | 13F | Future Financial Wealth Managment LLC | 2 900 | 0,00 | 62 | −4,62 | ||||
| 2025-07-24 | 13F | IFP Advisors, Inc | 10 243 | −11,08 | 219 | −15,50 | ||||
| 2025-07-15 | 13F | MCF Advisors LLC | 6 453 | 0,00 | 138 | −4,86 | ||||
| 2025-08-11 | 13F | Principal Securities, Inc. | 933 | 0,00 | 20 | 0,00 | ||||
| 2025-08-14 | 13F | Royal Bank Of Canada | 103 293 | −52,35 | 2 208 | −54,61 | ||||
| 2025-07-31 | 13F | Wealthfront Advisers Llc | 28 970 | 19,63 | 619 | 14,00 | ||||
| 2025-07-31 | 13F | Cambridge Investment Research Advisors, Inc. | 40 100 | −0,85 | 1 | |||||
| 2025-08-19 | 13F | Anchor Investment Management, LLC | 200 | 0,00 | 4 | 0,00 | ||||
| 2025-08-12 | 13F | SRS Capital Advisors, Inc. | 3 | 0,00 | 0 | |||||
| 2025-08-12 | 13F | MAI Capital Management | 1 822 | −10,99 | 39 | −15,56 | ||||
| 2025-08-14 | 13F | Jane Street Group, Llc | Call | 0 | −100,00 | 0 | ||||
| 2025-08-14 | 13F | Jane Street Group, Llc | Put | 10 800 | 11,34 | 231 | 5,99 | |||
| 2025-08-12 | 13F | Change Path, LLC | 18 098 | 12,20 | 387 | 6,93 | ||||
| 2025-08-13 | 13F | Cerity Partners LLC | 0 | −100,00 | 0 | |||||
| 2025-07-30 | 13F | Brookstone Capital Management | 18 578 | −17,35 | 397 | −21,23 | ||||
| 2025-08-15 | 13F | Tower Research Capital LLC (TRC) | 55 151 | −14,25 | 1 179 | −18,30 | ||||
| 2025-04-29 | 13F | Element Wealth, LLC | 0 | −100,00 | 0 | |||||
| 2025-08-14 | 13F | Jane Street Group, Llc | 0 | −100,00 | 0 | |||||
| 2025-05-15 | 13F | Schonfeld Strategic Advisors LLC | 0 | −100,00 | 0 | |||||
| 2025-07-17 | 13F | Paradigm Financial Partners, Llc | 161 240 | −0,08 | 3 447 | −4,81 | ||||
| 2025-08-14 | 13F | Wells Fargo & Company/mn | 1 577 216 | 25,04 | 33 721 | 19,13 | ||||
| 2025-08-06 | 13F | AE Wealth Management LLC | 29 425 | 2,94 | 629 | −1,87 | ||||
| 2025-08-08 | 13F | Advyzon Investment Management, LLC | 14 646 | 1,78 | 313 | −2,80 | ||||
| 2025-08-13 | 13F | Northwestern Mutual Wealth Management Co | 22 287 | 39,77 | 476 | 33,33 | ||||
| 2025-08-08 | 13F | Emerald Investment Partners, Llc | 1 000 | 0,00 | 21 | −4,55 | ||||
| 2025-08-14 | 13F | Toroso Investments, LLC | 49 767 | −9,36 | 1 064 | −13,64 | ||||
| 2025-07-29 | 13F | Private Trust Co Na | 150 | 0,00 | 3 | 0,00 | ||||
| 2025-08-14 | 13F | Ameriprise Financial Inc | 296 604 | −8,33 | 6 341 | −12,65 | ||||
| 2025-08-14 | 13F | Man Group plc | 0 | −100,00 | 0 | |||||
| 2025-04-23 | 13F | Creative Financial Designs Inc /adv | 0 | −100,00 | 0 | |||||
| 2025-08-11 | 13F | Citigroup Inc | 18 497 | 0,33 | 395 | −4,36 | ||||
| 2025-05-08 | 13F | Us Bancorp \de\ | 0 | −100,00 | 0 | |||||
| 2025-08-14 | 13F | Napa Wealth Management | 22 193 | 3,97 | 474 | −1,04 | ||||
| 2025-08-15 | 13F | Kestra Advisory Services, LLC | 26 576 | 13,01 | 568 | 7,78 | ||||
| 2025-07-11 | 13F | SILVER OAK SECURITIES, Inc | 15 384 | 2,97 | 329 | −0,61 | ||||
| 2025-08-14 | 13F | GWM Advisors LLC | 533 | 0,00 | 11 | 0,00 | ||||
| 2025-08-13 | 13F | Transce3nd, LLC | 66 184 | 5,77 | 1 416 | 1,07 | ||||
| 2025-08-12 | 13F | Cynosure Management, Llc | 161 494 | 25,91 | 3 453 | 19,94 | ||||
| 2025-08-15 | 13F | Morgan Stanley | 741 903 | 0,44 | 15 862 | −4,31 | ||||
| 2025-07-17 | 13F | Janney Montgomery Scott LLC | 39 509 | −43,96 | 1 | −100,00 | ||||
| 2025-09-04 | 13F/A | Advisor Group Holdings, Inc. | 379 671 | 14,07 | 8 117 | 8,68 | ||||
| 2025-08-05 | 13F | Simplex Trading, Llc | 0 | −100,00 | 0 | |||||
| 2025-08-14 | 13F | Financial Advisory Service, Inc. | 422 | 0,00 | 9 | 0,00 | ||||
| 2025-04-23 | 13F | Symphony Financial, Ltd. Co. | 0 | −100,00 | 0 | −100,00 | ||||
| 2025-08-12 | 13F | Pathstone Holdings, LLC | 32 214 | 100,46 | 701 | 94,72 | ||||
| 2025-08-11 | 13F | TD Waterhouse Canada Inc. | 375 | 0,00 | 8 | 0,00 | ||||
| 2025-08-13 | 13F | Cambria Investment Management, L.P. | 0 | −100,00 | 0 | |||||
| 2025-07-28 | 13F | Mutual Advisors, LLC | 17 550 | −11,36 | 392 | −4,85 | ||||
| 2025-05-29 | NP | TFAZX - TFA Tactical Income Fund Class I | 8 400 | 0,00 | 188 | 5,03 | ||||
| 2025-08-13 | 13F | Sumitomo Mitsui Financial Group, Inc. | 14 223 | 0,00 | 304 | −4,70 | ||||
| 2025-08-14 | 13F | Hrt Financial Lp | 0 | −100,00 | 0 | |||||
| 2025-08-14 | 13F | Safeguard Investment Advisory Group, LLC | 0 | −100,00 | 0 | |||||
| 2025-08-27 | NP | RBNAX - Robinson Opportunistic Income Fund Class A Shares | 29 250 | 18,18 | 625 | 12,61 | ||||
| 2025-08-15 | 13F | Captrust Financial Advisors | 31 547 | −1,38 | 674 | −6,00 | ||||
| 2025-08-12 | 13F | J.w. Cole Advisors, Inc. | 15 104 | 323 | ||||||
| 2025-07-25 | 13F | Allspring Global Investments Holdings, LLC | 24 900 | −12,94 | 532 | −17,00 | ||||
| 2025-08-15 | 13F | Prevail Innovative Wealth Advisors, Llc | 111 968 | 14,54 | 2 394 | 9,12 | ||||
| 2025-08-01 | 13F | Envestnet Asset Management Inc | 600 405 | 8,37 | 12 837 | 3,25 | ||||
| 2025-07-24 | 13F | Copperwynd Financial, LLC | 0 | −100,00 | 0 | |||||
| 2025-08-14 | 13F | First Foundation Advisors | 30 064 | −9,29 | 643 | −13,59 | ||||
| 2025-08-13 | 13F | Natixis | 5 | 0,00 | 0 | |||||
| 2025-08-13 | 13F | Manning & Napier Advisors Llc | 33 803 | 0,16 | 723 | −4,62 | ||||
| 2025-08-14 | 13F | Stifel Financial Corp | 10 881 | 233 | ||||||
| 2025-08-18 | 13F | Wolverine Trading, Llc | Call | 22 200 | −20,43 | 471 | −23,66 | |||
| 2025-08-13 | 13F | Twin Peaks Wealth Advisors, LLC | 4 241 | 94 | ||||||
| 2025-08-13 | 13F | Virtus ETF Advisers LLC | 23 | 0 | ||||||
| 2025-08-11 | 13F | Private Advisor Group, LLC | 18 788 | −64,64 | 402 | −66,36 | ||||
| 2025-08-13 | 13F | Jones Financial Companies Lllp | 246 | 0,00 | 5 | 0,00 | ||||
| 2025-07-31 | 13F | Sumitomo Mitsui Trust Holdings, Inc. | 31 279 | 5,88 | 669 | 0,91 | ||||
| 2025-08-13 | 13F | Rsm Us Wealth Management Llc | 54 552 | −14,63 | 1 166 | −18,63 | ||||
| 2025-08-14 | 13F | Two Sigma Investments, Lp | 0 | −100,00 | 0 | |||||
| 2025-08-27 | NP | RYMSX - Guggenheim Multi-Hedge Strategies Fund Class P | Short | −5 | −76,19 | −0 | ||||
| 2025-08-12 | 13F | Jpmorgan Chase & Co | 4 980 | −32,63 | 106 | −35,76 | ||||
| 2025-08-14 | 13F | Bank Of America Corp /de/ | 523 995 | 1,88 | 11 203 | −2,93 | ||||
| 2025-08-14 | 13F | Aster Capital Management (DIFC) Ltd | 148 992 | 3 185 | ||||||
| 2025-07-08 | 13F | Parallel Advisors, LLC | 91 | 0,00 | 2 | −50,00 | ||||
| 2025-06-03 | 13F | Invst, LLC | 25 924 | 33,57 | 582 | 40,34 |
Other Listings
| MX:REM |