Grundläggande statistik
| Institutionella ägare | 81 total, 81 long only, 0 short only, 0 long/short - change of 2,53% MRQ |
| Genomsnittlig portföljallokering | 0.2107 % - change of −14,63% MRQ |
| Institutionella aktier (lång) | 15 277 546 (ex 13D/G) - change of 2,02MM shares 15,27% MRQ |
| Institutionellt värde (lång) | $ 297 107 USD ($1000) |
Institutionellt ägande och aktieägare
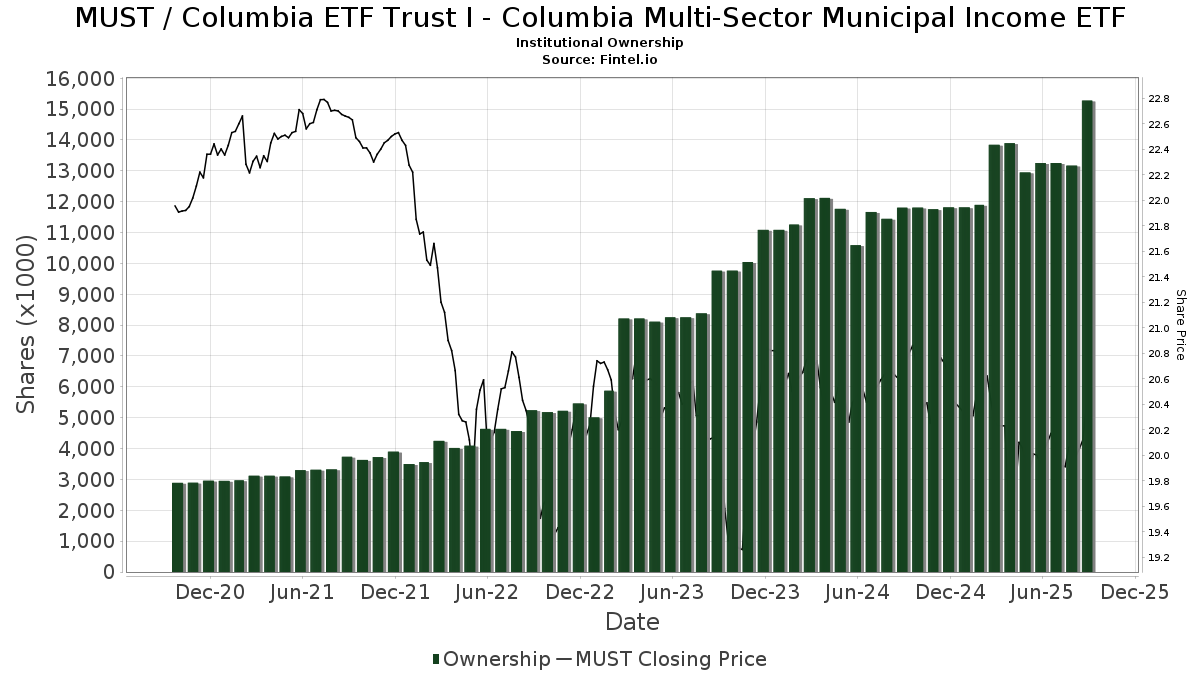
Columbia ETF Trust I - Columbia Multi-Sector Municipal Income ETF (US:MUST) har 81 Institutionella ägare och aktieägare som har lämnat in 13D/G- eller 13F-formulär till Securities Exchange Commission (SEC). Dessa institut innehar totalt 15,277,546 aktier. Största aktieägare inkluderar Morgan Stanley, Ameriprise Financial Inc, Wells Fargo & Company/mn, LPL Financial LLC, Bank Of America Corp /de/, Haven Private, LLC, Commonwealth Equity Services, Llc, Royal Bank Of Canada, TruWealth Advisors, LLC, and UBS Group AG .
Columbia ETF Trust I - Columbia Multi-Sector Municipal Income ETF (ARCA:MUST) Institutionell ägarstruktur visar institutioners och fonders nuvarande positioner i företaget, samt de senaste förändringarna i positionernas storlek. Större aktieägare kan vara enskilda investerare, fonder, hedgefonder eller institutioner. Bilaga 13D visar att investeraren äger (eller ägde) mer än 5% av företaget och avser (eller avsåg) att aktivt eftersträva en förändring av affärsstrategin. Schedule 13G indikerar en passiv investering på över 5%.
The share price as of September 12, 2025 is 20,46 / share. Previously, on September 16, 2024, the share price was 20,73 / share. This represents a decline of 1,30% over that period.
Fondsentimentets poäng
Fondsentimentet poängen(fka Ägarackumulation-poäng) visar vilka aktier som är mest köpta av fonder. Det är resultatet av en sofistikerad kvantitativ flerfaktormodell som identifierar företag med de högsta nivåerna av institutionell ackumulering. Poängsättningsmodellen använder en kombination av den totala ökningen av redovisade ägare, förändringarna i portföljallokeringarna för dessa ägare och andra mått. Siffran sträcker sig från 0 till 100, där högre siffror indikerar en högre nivå av ackumulering i förhållande till sina konkurrenter, och 50 är genomsnittet.
Uppdateringsfrekvens: Dagligen
Se Ownership Explorer, som innehåller en lista över de högst rankade företagen.
Institutionell sälj/köp-kvot
Förutom att rapportera vanliga eget kapital- och skuldemissioner måste institutioner med mer än 100MM tillgångar under förvaltning också avslöja sina innehav av sälj- och köpoptioner. Eftersom säljoptioner i allmänhet indikerar ett negativt sentiment och köpoptioner indikerar ett positivt sentiment, kan vi få en uppfattning om det övergripande institutionella sentimentet genom att plotta förhållandet mellan säljoptioner och köpoptioner. Diagrammet till höger visar det historiska förhållandet mellan sälj- och köpoptioner för detta instrument.
Genom att använda sälj/köp-kvoten som en indikator på aktieägarnas sentiment undviker man en av de största bristerna med att använda det totala institutionella ägandet, nämligen att en betydande del av de förvaltade tillgångarna investeras passivt för att följa index. Passivt förvaltade fonder köper vanligtvis inte optioner, så indikatorn för sälj/köp-kvoten ger en bättre bild av stämningen i aktivt förvaltade fonder.
13F- och NPORT-arkiveringar
Detaljer om 13F-arkiveringar är gratis. Detaljer om NP-arkiveringar kräver ett premiummedlemskap. Gröna rader indikerar nya positioner. Röda rader indikerar stängda positioner. Klicka på länk symbolen för att se hela transaktionshistoriken.
Uppgradera
för att låsa upp premiumdata och exportera till Excel ![]() .
.
| Fil Datum | Källa | Investerare | Typ | Genomsnittligt pris (beräknat) |
Aktier | Δ Aktier (%) |
Rapporterat värde (1000 USD) |
Δ Värde (%) |
Portföljallokering (%) |
|
|---|---|---|---|---|---|---|---|---|---|---|
| 2025-08-12 | 13F | Jpmorgan Chase & Co | 70 484 | 48,22 | 1 418 | 48,17 | ||||
| 2025-08-14 | 13F | Royal Bank Of Canada | 247 385 | 4,95 | 4 978 | 4,87 | ||||
| 2025-08-14 | 13F | LM Advisors LLC | 40 725 | 0,00 | 1 | |||||
| 2025-07-17 | 13F | Janney Montgomery Scott LLC | 27 235 | −29,05 | 1 | |||||
| 2025-07-28 | 13F | BRYN MAWR TRUST Co | 75 | 2 | ||||||
| 2025-08-14 | 13F | Bank Of America Corp /de/ | 1 069 403 | 9,95 | 21 516 | 9,87 | ||||
| 2025-07-29 | 13F | Horst & Graben Wealth Management LLC | 12 479 | 0,52 | 251 | 0,80 | ||||
| 2025-08-14 | 13F | Jane Street Group, Llc | 219 944 | 4 425 | ||||||
| 2025-08-14 | 13F | Mml Investors Services, Llc | 18 754 | 2,29 | 0 | |||||
| 2025-07-24 | 13F | IFP Advisors, Inc | 4 134 | 83 | ||||||
| 2025-08-08 | 13F | Cetera Investment Advisers | 80 119 | −6,65 | 1 612 | −6,77 | ||||
| 2025-08-13 | 13F | GeoWealth Management, LLC | 80 031 | 1 610 | ||||||
| 2025-08-04 | 13F | Amplius Wealth Advisors, LLC | 108 470 | 11,98 | 2 182 | 11,90 | ||||
| 2025-08-14 | 13F | Comerica Bank | 18 778 | −35,96 | 378 | −36,10 | ||||
| 2025-08-15 | 13F | Morgan Stanley | 3 259 079 | 40,80 | 65 573 | 40,70 | ||||
| 2025-08-04 | 13F | Haven Private, LLC | 821 593 | 1,40 | 16 530 | 1,32 | ||||
| 2025-07-17 | 13F | Genesis Private Wealth, Llc | 108 067 | 5,46 | 2 174 | 5,38 | ||||
| 2025-04-08 | 13F | Parallel Advisors, LLC | 0 | −100,00 | 0 | |||||
| 2025-08-05 | 13F | Frederick Financial Consultants, LLC | 127 906 | 1,51 | 2 573 | 1,42 | ||||
| 2025-08-14 | 13F | Wiley Bros.-aintree Capital, Llc | 21 523 | 35,99 | 433 | 36,16 | ||||
| 2025-08-04 | 13F | Arbor Capital Management Inc /adv | 74 608 | 0,83 | 1 497 | 0,00 | ||||
| 2025-08-07 | 13F | Cvfg Llc | 22 271 | −1,51 | 448 | −1,54 | ||||
| 2025-08-06 | 13F | Commonwealth Equity Services, Llc | 315 350 | 12,09 | 6 | 20,00 | ||||
| 2025-08-18 | 13F | Geneos Wealth Management Inc. | 1 750 | 0,00 | 35 | 0,00 | ||||
| 2025-08-13 | 13F | EverSource Wealth Advisors, LLC | 3 416 | 18,16 | 69 | 17,24 | ||||
| 2025-07-16 | 13F | GenWealth Group, Inc. | 0 | −100,00 | 0 | |||||
| 2025-07-24 | 13F | Jfs Wealth Advisors, Llc | 0 | −100,00 | 0 | |||||
| 2025-07-25 | 13F | Concurrent Investment Advisors, LLC | 11 965 | 241 | ||||||
| 2025-08-13 | 13F | Vertex Planning Partners, LLC | 12 294 | 1,44 | 247 | 1,23 | ||||
| 2025-08-04 | 13F | Daymark Wealth Partners, Llc | 12 117 | 15,85 | 244 | 15,71 | ||||
| 2025-07-21 | 13F | Cliftonlarsonallen Wealth Advisors, Llc | 109 039 | 0,00 | 2 194 | −0,09 | ||||
| 2025-08-15 | 13F | Captrust Financial Advisors | 129 017 | −2,64 | 2 596 | −2,74 | ||||
| 2025-08-13 | 13F | Baker Avenue Asset Management, LP | 133 245 | −5,11 | 2 681 | −5,20 | ||||
| 2025-08-19 | 13F | Advisory Services Network, LLC | 24 068 | −5,60 | 481 | −6,24 | ||||
| 2025-08-14 | 13F | Two Sigma Securities, Llc | 13 357 | 269 | ||||||
| 2025-05-07 | 13F | BlueStem Wealth Partners, LLC | 0 | −100,00 | 0 | |||||
| 2025-07-11 | 13F | Farther Finance Advisors, LLC | 3 821 | 77 | ||||||
| 2025-08-14 | 13F | Integrated Wealth Concepts LLC | 11 973 | −15,71 | 241 | −16,08 | ||||
| 2025-08-07 | 13F/A | Joseph Group Capital Management | 2 309 | −60,96 | 46 | −61,34 | ||||
| 2025-08-05 | 13F | Westside Investment Management, Inc. | 17 800 | 0,00 | 357 | −0,56 | ||||
| 2025-07-29 | 13F | Liberty Square Wealth Partners Llc | 14 459 | −29,59 | 291 | −29,78 | ||||
| 2025-07-30 | 13F | Bleakley Financial Group, LLC | 13 536 | 272 | ||||||
| 2025-08-14 | 13F | Fmr Llc | 683 | 335,03 | 14 | 333,33 | ||||
| 2025-08-19 | 13F | Newbridge Financial Services Group, Inc. | 1 765 | 0,00 | 36 | 0,00 | ||||
| 2025-08-29 | 13F | Centaurus Financial, Inc. | 12 873 | 0,00 | 0 | |||||
| 2025-07-16 | 13F | Moneywise, Inc. | 78 861 | −27,58 | 1 587 | −27,65 | ||||
| 2025-09-04 | 13F/A | Advisor Group Holdings, Inc. | 182 872 | 37,23 | 3 679 | 37,12 | ||||
| 2025-07-23 | 13F | Pure Portfolios Holdings Llc | 17 578 | 49,19 | 354 | 48,95 | ||||
| 2025-08-11 | 13F | Lake Street Financial Llc | 67 299 | 0,10 | 1 354 | 0,07 | ||||
| 2025-08-14 | 13F | Paragon Private Wealth Management, LLC | 30 176 | −29,32 | 607 | −29,34 | ||||
| 2025-07-11 | 13F | SILVER OAK SECURITIES, Inc | 0 | −100,00 | 0 | |||||
| 2025-07-29 | 13F | Activest Wealth Management | 0 | 0 | ||||||
| 2025-07-23 | 13F | Lakeside Advisors, INC. | 39 990 | 17,74 | 805 | 17,72 | ||||
| 2025-08-14 | 13F | Ameriprise Financial Inc | 2 599 097 | 6,99 | 52 284 | 6,93 | ||||
| 2025-07-31 | 13F | Cambridge Investment Research Advisors, Inc. | 11 804 | −5,57 | 0 | |||||
| 2025-08-12 | 13F | Proequities, Inc. | 0 | 0 | ||||||
| 2025-07-22 | 13F | DAVENPORT & Co LLC | 13 450 | 271 | ||||||
| 2025-05-15 | 13F | Citadel Advisors Llc | 0 | −100,00 | 0 | |||||
| 2025-08-14 | 13F | Raymond James Financial Inc | 233 038 | 277,29 | 4 689 | 277,15 | ||||
| 2025-08-01 | 13F | Envestnet Asset Management Inc | 52 979 | 8,61 | 1 066 | 8,45 | ||||
| 2025-08-06 | 13F | Golden State Wealth Management, LLC | 0 | −100,00 | 0 | −100,00 | ||||
| 2025-08-14 | 13F | Susquehanna International Group, Llp | 61 054 | 1 228 | ||||||
| 2025-08-04 | 13F | Atria Investments Llc | 22 292 | −20,94 | 449 | −20,99 | ||||
| 2025-07-29 | 13F | Private Trust Co Na | 0 | −100,00 | 0 | |||||
| 2025-07-16 | 13F | ORG Partners LLC | 10 416 | 209 | ||||||
| 2025-08-18 | 13F | Arq Wealth Advisors, Llc | 145 368 | 2 927 | ||||||
| 2025-08-14 | 13F | UBS Group AG | 245 802 | −12,29 | 4 946 | −12,35 | ||||
| 2025-05-02 | 13F | Transcendent Capital Group LLC | 0 | −100,00 | 0 | |||||
| 2025-08-12 | 13F | LPL Financial LLC | 1 291 788 | 5,31 | 25 991 | 5,23 | ||||
| 2025-08-14 | 13F | Colony Group, LLC | 74 463 | 137,14 | 1 498 | 137,03 | ||||
| 2025-08-14 | 13F | C M Bidwell & Associates Ltd | 13 127 | −11,76 | 264 | −11,71 | ||||
| 2025-08-13 | 13F | Natixis Advisors, L.p. | 44 538 | 0,04 | 1 | |||||
| 2025-08-07 | 13F | CENTRAL TRUST Co | 123 555 | 3,28 | 2 486 | 3,20 | ||||
| 2025-08-11 | 13F | Principal Securities, Inc. | 1 220 | −55,41 | 25 | −56,36 | ||||
| 2025-08-08 | 13F | Larson Financial Group LLC | 1 708 | −21,62 | 34 | −20,93 | ||||
| 2025-08-14 | 13F | Redwood Investment Management, Llc | 15 189 | 0,86 | 0 | |||||
| 2025-07-10 | 13F | Wealth Enhancement Advisory Services, Llc | 133 165 | −26,37 | 2 685 | −26,28 | ||||
| 2025-08-08 | 13F | Collaborative Wealth Managment Inc. | 11 134 | 0,13 | 224 | 0,45 | ||||
| 2025-08-13 | 13F | Lido Advisors, LLC | 0 | −100,00 | 0 | |||||
| 2025-08-13 | 13F | Flow Traders U.s. Llc | 0 | −100,00 | 0 | |||||
| 2025-08-12 | 13F | Cornerstone Wealth Management, LLC | 43 050 | −17,68 | 866 | −17,68 | ||||
| 2025-08-14 | 13F | Integrity Wealth Advisors, Inc. | 15 620 | −3,44 | 314 | −3,38 | ||||
| 2025-08-08 | 13F | Foundations Investment Advisors, LLC | 38 944 | 46,72 | 784 | 46,63 | ||||
| 2025-08-14 | 13F | Wells Fargo & Company/mn | 1 818 775 | 5,68 | 36 594 | 5,60 | ||||
| 2025-08-14 | 13F | GWM Advisors LLC | 30 132 | −3,77 | 606 | −3,81 | ||||
| 2025-08-08 | 13F | Condor Capital Management | 57 809 | 3,79 | 1 163 | 3,75 | ||||
| 2025-08-14 | 13F/A | Rockefeller Capital Management L.P. | 23 175 | 0,00 | 466 | 0,00 | ||||
| 2025-07-28 | 13F | Harbour Investments, Inc. | 4 265 | 0,00 | 86 | 0,00 | ||||
| 2025-08-04 | 13F | Pensionmark Financial Group, Llc | 18 084 | 0,00 | 364 | −0,27 | ||||
| 2025-08-14 | 13F | Old Mission Capital Llc | 0 | −100,00 | 0 | |||||
| 2025-07-18 | 13F | Truist Financial Corp | 0 | −100,00 | 0 | |||||
| 2025-07-07 | 13F | Global Wealth Strategies & Associates | 137 539 | 3,09 | 2 767 | 3,02 | ||||
| 2025-08-12 | 13F | OneAscent Financial Services LLC | 22 292 | −20,94 | 0 | |||||
| 2025-08-12 | 13F | MAI Capital Management | 2 162 | 0,00 | 44 | 0,00 | ||||
| 2025-07-07 | 13F | TruWealth Advisors, LLC | 246 860 | 15,27 | 4 967 | 15,17 | ||||
| 2025-07-16 | 13F | New Insight Wealth Advisors | 18 976 | −13,96 | 382 | −14,19 |