Grundläggande statistik
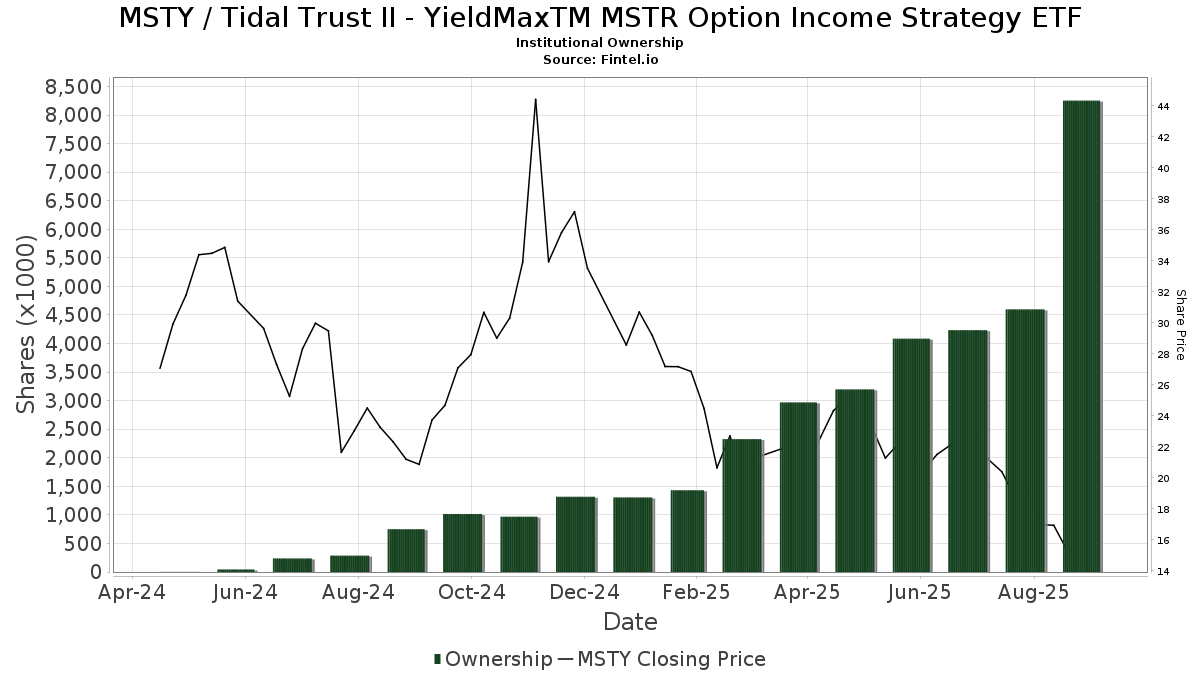
| Institutionella ägare | 167 total, 163 long only, 0 short only, 4 long/short - change of 112,66% MRQ |
| Genomsnittlig portföljallokering | 0.0766 % - change of −81,61% MRQ |
| Institutionella aktier (lång) | 8 254 886 (ex 13D/G) - change of 4,17MM shares 102,01% MRQ |
| Institutionellt värde (lång) | $ 176 492 USD ($1000) |
Institutionellt ägande och aktieägare
Tidal Trust II - YieldMaxTM MSTR Option Income Strategy ETF (US:MSTY) har 167 Institutionella ägare och aktieägare som har lämnat in 13D/G- eller 13F-formulär till Securities Exchange Commission (SEC). Dessa institut innehar totalt 8,254,886 aktier. Största aktieägare inkluderar Toroso Investments, LLC, YMAX - YieldMaxTM Universe Fund of Option Income ETFs, Citadel Advisors Llc, Susquehanna International Group, Llp, Susquehanna International Group, Llp, Private Advisor Group, LLC, Jane Street Group, Llc, Citadel Advisors Llc, Jump Financial, LLC, and Jane Street Group, Llc .
Tidal Trust II - YieldMaxTM MSTR Option Income Strategy ETF (ARCA:MSTY) Institutionell ägarstruktur visar institutioners och fonders nuvarande positioner i företaget, samt de senaste förändringarna i positionernas storlek. Större aktieägare kan vara enskilda investerare, fonder, hedgefonder eller institutioner. Bilaga 13D visar att investeraren äger (eller ägde) mer än 5% av företaget och avser (eller avsåg) att aktivt eftersträva en förändring av affärsstrategin. Schedule 13G indikerar en passiv investering på över 5%.
The share price as of September 10, 2025 is 15,38 / share. Previously, on September 11, 2024, the share price was 21,20 / share. This represents a decline of 27,45% over that period.
Fondsentimentets poäng
Fondsentimentet poängen(fka Ägarackumulation-poäng) visar vilka aktier som är mest köpta av fonder. Det är resultatet av en sofistikerad kvantitativ flerfaktormodell som identifierar företag med de högsta nivåerna av institutionell ackumulering. Poängsättningsmodellen använder en kombination av den totala ökningen av redovisade ägare, förändringarna i portföljallokeringarna för dessa ägare och andra mått. Siffran sträcker sig från 0 till 100, där högre siffror indikerar en högre nivå av ackumulering i förhållande till sina konkurrenter, och 50 är genomsnittet.
Uppdateringsfrekvens: Dagligen
Se Ownership Explorer, som innehåller en lista över de högst rankade företagen.
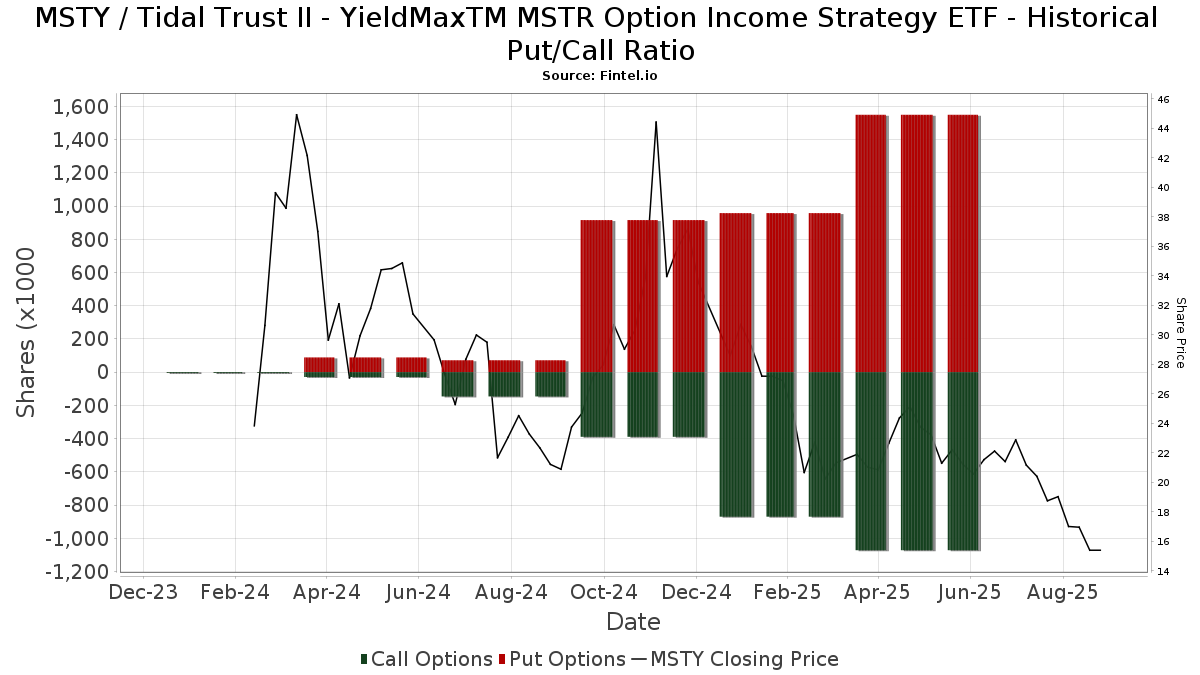
Institutionell sälj/köp-kvot
Förutom att rapportera vanliga eget kapital- och skuldemissioner måste institutioner med mer än 100MM tillgångar under förvaltning också avslöja sina innehav av sälj- och köpoptioner. Eftersom säljoptioner i allmänhet indikerar ett negativt sentiment och köpoptioner indikerar ett positivt sentiment, kan vi få en uppfattning om det övergripande institutionella sentimentet genom att plotta förhållandet mellan säljoptioner och köpoptioner. Diagrammet till höger visar det historiska förhållandet mellan sälj- och köpoptioner för detta instrument.
Genom att använda sälj/köp-kvoten som en indikator på aktieägarnas sentiment undviker man en av de största bristerna med att använda det totala institutionella ägandet, nämligen att en betydande del av de förvaltade tillgångarna investeras passivt för att följa index. Passivt förvaltade fonder köper vanligtvis inte optioner, så indikatorn för sälj/köp-kvoten ger en bättre bild av stämningen i aktivt förvaltade fonder.
13F- och NPORT-arkiveringar
Detaljer om 13F-arkiveringar är gratis. Detaljer om NP-arkiveringar kräver ett premiummedlemskap. Gröna rader indikerar nya positioner. Röda rader indikerar stängda positioner. Klicka på länk symbolen för att se hela transaktionshistoriken.
Uppgradera
för att låsa upp premiumdata och exportera till Excel ![]() .
.
| Fil Datum | Källa | Investerare | Typ | Genomsnittligt pris (beräknat) |
Aktier | Δ Aktier (%) |
Rapporterat värde (1000 USD) |
Δ Värde (%) |
Portföljallokering (%) |
|
|---|---|---|---|---|---|---|---|---|---|---|
| 2025-07-08 | 13F | Arlington Trust Co LLC | 220 | 5 | ||||||
| 2025-07-14 | 13F | Sowell Financial Services LLC | 11 794 | 261 | ||||||
| 2025-08-05 | 13F | Lifeworks Advisors, LLC | 38 025 | 126,66 | 843 | 147,21 | ||||
| 2025-08-06 | 13F | AE Wealth Management LLC | 7 550 | 5,59 | 167 | 15,17 | ||||
| 2025-04-28 | 13F | Strategic Financial Concepts, LLC | 0 | −100,00 | 0 | −100,00 | ||||
| 2025-08-11 | 13F | HighTower Advisors, LLC | 14 265 | 316 | ||||||
| 2025-08-12 | 13F | Proequities, Inc. | 0 | 0 | ||||||
| 2025-08-06 | 13F | ZEGA Investments, LLC | 17 435 | 36,37 | 387 | 49,03 | ||||
| 2025-08-13 | 13F | Natixis | 53 065 | 23,96 | 1 165 | 32,84 | ||||
| 2025-08-27 | 13F/A | Brinker Capital Investments, LLC | 65 718 | 1 457 | ||||||
| 2025-07-14 | 13F | AdvisorNet Financial, Inc | 3 774 | −41,10 | 84 | −36,15 | ||||
| 2025-08-01 | 13F | Belvedere Trading LLC | 4 982 | −79,86 | 110 | −78,09 | ||||
| 2025-08-01 | 13F | Belvedere Trading LLC | Call | 12 900 | 5,74 | 286 | 14,92 | |||
| 2025-08-01 | 13F | Belvedere Trading LLC | Put | 20 600 | −41,14 | 457 | −35,86 | |||
| 2025-08-12 | 13F | Aspiring Ventures, LLC | 154 150 | 3 418 | ||||||
| 2025-07-15 | 13F | Financial Partners Group, Inc | 27 073 | 600 | ||||||
| 2025-08-13 | 13F | Texas Capital Bank Wealth Management Services Inc | 42 952 | 952 | ||||||
| 2025-08-14 | 13F | Harwood Advisory Group, LLC | 40 | 1 | ||||||
| 2025-07-09 | 13F | Fiduciary Alliance LLC | 75 767 | 99,42 | 1 680 | 117,49 | ||||
| 2025-08-14 | 13F | TCG Advisory Services, LLC | 13 701 | 304 | ||||||
| 2025-07-10 | 13F | Signal Advisors Wealth, LLC | 68 742 | 1 524 | ||||||
| 2025-07-16 | 13F | Instrumental Wealth, Llc | 71 133 | 61,63 | 1 593 | 53,47 | ||||
| 2025-05-15 | 13F | Dimension Capital Management Llc | 0 | −100,00 | 0 | −100,00 | ||||
| 2025-07-16 | 13F | ORG Partners LLC | 8 872 | 191 | ||||||
| 2025-07-17 | 13F | Sound Income Strategies, LLC | 1 500 | 33 | ||||||
| 2025-07-16 | 13F | Strategic Investment Solutions, Inc. /IL | 139 | 3 | ||||||
| 2025-08-14 | 13F | Private Wealth Advisors, LLC | 12 124 | 269 | ||||||
| 2025-09-11 | 13F | Silicon Valley Capital Partners | 269 | 25,70 | 6 | 25,00 | ||||
| 2025-08-12 | 13F | Change Path, LLC | 16 359 | 363 | ||||||
| 2025-08-13 | 13F | StoneX Group Inc. | 101 726 | 369,24 | 2 255 | 412,50 | ||||
| 2025-08-14 | 13F | Toroso Investments, LLC | 1 432 831 | 26,46 | 31 766 | 37,90 | ||||
| 2025-07-25 | 13F | Cwm, Llc | 121 | −73,64 | 0 | |||||
| 2025-08-14 | 13F | Susquehanna International Group, Llp | Put | 581 400 | 131,08 | 12 890 | 151,98 | |||
| 2025-08-14 | 13F | Susquehanna International Group, Llp | 536 093 | 261,98 | 11 885 | 294,85 | ||||
| 2025-08-06 | 13F | Prospera Financial Services Inc | 44 514 | 987 | ||||||
| 2025-08-14 | 13F | Susquehanna International Group, Llp | Call | 88 200 | −16,00 | 1 955 | −8,39 | |||
| 2025-08-12 | 13F | MAI Capital Management | 1 000 | 0,00 | 22 | 10,00 | ||||
| 2025-07-16 | 13F | Kiley Juergens Wealth Management, Llc | 10 785 | 239 | ||||||
| 2025-08-08 | 13F | Foundations Investment Advisors, LLC | 9 092 | 202 | ||||||
| 2025-08-13 | 13F | Beacon Pointe Advisors, LLC | 31 081 | 689 | ||||||
| 2025-08-13 | 13F | Avestar Capital, LLC | 14 900 | 330 | ||||||
| 2025-08-12 | 13F | Global Retirement Partners, LLC | 5 849 | 130 | ||||||
| 2025-08-14 | 13F | Mml Investors Services, Llc | 18 179 | −9,93 | 0 | |||||
| 2025-08-07 | 13F | CENTRAL TRUST Co | 500 | 11 | ||||||
| 2025-07-01 | 13F | Stonehearth Capital Management, LLC | 10 364 | 230 | ||||||
| 2025-08-13 | 13F | Northwestern Mutual Wealth Management Co | 46 | 1 | ||||||
| 2025-08-14 | 13F | McIlrath & Eck, LLC | 5 627 | 125 | ||||||
| 2025-07-30 | 13F | Pittenger & Anderson Inc | 680 | 15 | ||||||
| 2025-08-13 | 13F | Continuum Advisory, LLC | 0 | −100,00 | 0 | |||||
| 2025-08-04 | 13F | Hantz Financial Services, Inc. | 85 | 0 | ||||||
| 2025-08-11 | 13F | Cornerstone Planning Group LLC | 12 176 | 223 | ||||||
| 2025-07-10 | 13F | Wealth Enhancement Advisory Services, Llc | 69 034 | 77,73 | 1 442 | 82,76 | ||||
| 2025-08-14 | 13F | SIH Partners, LLLP | 108 032 | 2 395 | ||||||
| 2025-08-15 | 13F | CI Private Wealth, LLC | 44 572 | 199,24 | 988 | 227,15 | ||||
| 2025-07-14 | 13F | Proathlete Wealth Management Llc | 188 | 4 | ||||||
| 2025-08-04 | 13F | Migdal Insurance & Financial Holdings Ltd. | 0 | −100,00 | 0 | |||||
| 2025-08-06 | 13F | Legacy Investment Solutions, LLC | 12 048 | 267 | ||||||
| 2025-08-14 | 13F | Coppell Advisory Solutions LLC | 0 | −100,00 | 0 | |||||
| 2025-07-28 | 13F | BRYN MAWR TRUST Co | 6 915 | 26,23 | 153 | 37,84 | ||||
| 2025-08-14 | 13F | Visionary Wealth Advisors | 24 971 | 52,68 | 554 | 66,57 | ||||
| 2025-07-24 | 13F | PDS Planning, Inc | 13 269 | 294 | ||||||
| 2025-08-14 | 13F | Wells Fargo & Company/mn | 4 | 300,00 | 0 | |||||
| 2025-08-14 | 13F | SWAN Capital LLC | 283 | 6 | ||||||
| 2025-08-06 | 13F | Walkner Condon Financial Advisors LLC | 0 | −100,00 | 0 | |||||
| 2025-08-06 | 13F | Wedbush Securities Inc | 12 765 | 0 | ||||||
| 2025-08-11 | 13F | United Advisor Group, LLC | 20 744 | 460 | ||||||
| 2025-08-08 | 13F | Meridian Wealth Management, LLC | 20 451 | 453 | ||||||
| 2025-08-14 | 13F | Raymond James Financial Inc | 1 644 | 36 | ||||||
| 2025-04-09 | 13F | Worth Asset Management, LLC | 0 | −100,00 | 0 | |||||
| 2025-07-21 | 13F | Hilltop National Bank | 87 | 0,00 | 2 | −50,00 | ||||
| 2025-08-14 | 13F | Beaird Harris Wealth Management, LLC | 4 051 | 90 | ||||||
| 2025-08-14 | 13F | Jane Street Group, Llc | Call | 304 100 | −27,78 | 6 742 | −21,25 | |||
| 2025-08-04 | 13F | Wealth Management Associates, Inc. | 10 570 | 234 | ||||||
| 2025-07-28 | 13F | Kiker Wealth Management, LLC | 355 | 25,89 | 8 | 40,00 | ||||
| 2025-08-14 | 13F | Jane Street Group, Llc | Put | 474 700 | 49,94 | 10 524 | 63,52 | |||
| 2025-08-08 | 13F | Creative Planning | 30 689 | 680 | ||||||
| 2025-08-14 | 13F | Toronto Dominion Bank | 5 000 | 150,00 | 111 | 170,73 | ||||
| 2025-08-18 | 13F | Hollencrest Capital Management | 500 | 11 | ||||||
| 2025-08-11 | 13F | BluePath Capital Management, LLC | 54 787 | 23,47 | 1 215 | 34,59 | ||||
| 2025-08-05 | 13F | Simplex Trading, Llc | 206 692 | 68,30 | 5 | 100,00 | ||||
| 2025-05-12 | 13F | Fmr Llc | 0 | −100,00 | 0 | |||||
| 2025-07-28 | 13F | Frazier Financial Advisors, LLC | 25 | 0,00 | 1 | |||||
| 2025-08-15 | 13F | Tower Research Capital LLC (TRC) | 0 | −100,00 | 0 | −100,00 | ||||
| 2025-07-21 | 13F | Ameritas Advisory Services, LLC | 1 718 | 38 | ||||||
| 2025-08-13 | 13F | Kilter Group LLC | 150 | 3 | ||||||
| 2025-07-24 | 13F | Us Bancorp \de\ | 5 650 | 125 | ||||||
| 2025-08-12 | 13F | Jpmorgan Chase & Co | 0 | −100,00 | 0 | −100,00 | ||||
| 2025-07-30 | 13F | Evermay Wealth Management Llc | 202 | 4 | ||||||
| 2025-08-14 | 13F | Citadel Advisors Llc | Put | 474 000 | 33,56 | 10 509 | 45,64 | |||
| 2025-08-14 | 13F | TT Capital Management LLC | 83 000 | 1 843 | ||||||
| 2025-08-14 | 13F | Citadel Advisors Llc | Call | 667 600 | 101,08 | 14 801 | 119,29 | |||
| 2025-06-26 | NP | YMAX - YieldMaxTM Universe Fund of Option Income ETFs | 1 049 840 | 15,24 | 25 553 | 4,47 | ||||
| 2025-08-12 | 13F | SRS Capital Advisors, Inc. | 0 | −100,00 | 0 | −100,00 | ||||
| 2025-08-04 | 13F | Spire Wealth Management | 915 | 71,35 | 20 | 100,00 | ||||
| 2025-08-11 | 13F | Principal Securities, Inc. | 6 499 | 4 937,98 | 144 | 4 700,00 | ||||
| 2025-07-17 | 13F | Investment Research & Advisory Group, Inc. | 50 | 1 | ||||||
| 2025-07-16 | 13F | Signaturefd, Llc | 3 754 | 50,16 | 83 | 66,00 | ||||
| 2025-08-14 | 13F | Prelude Capital Management, Llc | 100 000 | 2 217 | ||||||
| 2025-08-08 | 13F | Avantax Advisory Services, Inc. | 21 263 | −3,03 | 471 | 5,84 | ||||
| 2025-07-21 | 13F | HighMark Wealth Management LLC | 123 | 3 | ||||||
| 2025-05-19 | 13F/A | Jane Street Group, Llc | 0 | −100,00 | 0 | −100,00 | ||||
| 2025-08-14 | 13F | Royal Bank Of Canada | 10 601 | 235 | ||||||
| 2025-08-14 | 13F | Citadel Advisors Llc | 0 | −100,00 | 0 | −100,00 | ||||
| 2025-08-15 | 13F | Captrust Financial Advisors | 15 382 | 341 | ||||||
| 2025-08-13 | 13F | BCJ Capital Management, LLC | 9 525 | 211 | ||||||
| 2025-07-10 | 13F | Redhawk Wealth Advisors, Inc. | 16 513 | 38,75 | 366 | 51,87 | ||||
| 2025-08-14 | 13F | Federation des caisses Desjardins du Quebec | 207 522 | 105,47 | 4 599 | 123,96 | ||||
| 2025-08-14 | 13F | Group One Trading, L.p. | 174 193 | −21,32 | 3 862 | −14,20 | ||||
| 2025-08-05 | 13F | Huntington National Bank | 256 | |||||||
| 2025-08-13 | 13F | Finer Wealth Management, Inc. | 14 874 | 330 | ||||||
| 2025-08-13 | 13F | Lauer Wealth, LLC | 29 845 | 579 | ||||||
| 2025-08-08 | 13F | Everett Harris & Co /ca/ | 10 555 | 234 | ||||||
| 2025-08-14 | 13F | Mariner, LLC | 25 258 | −10,91 | 560 | −2,95 | ||||
| 2025-08-01 | 13F | Winebrenner Capital Management Llc | 10 500 | 0,00 | 233 | 8,92 | ||||
| 2025-08-14 | 13F | Headlands Technologies LLC | 709 | −44,91 | 16 | −42,31 | ||||
| 2025-08-14 | 13F | UBS Group AG | 3 837 | 39,43 | 85 | 54,55 | ||||
| 2025-07-16 | 13F | Legend Financial Advisors, Inc. | 500 | 11 | ||||||
| 2025-08-12 | 13F | Maripau Wealth Management Llc | 45 852 | 1 017 | ||||||
| 2025-08-07 | 13F | Argent Advisors, Inc. | 50 000 | 150,00 | 1 108 | 172,91 | ||||
| 2025-07-31 | 13F | Cambridge Investment Research Advisors, Inc. | 15 906 | −13,66 | 0 | |||||
| 2025-07-08 | 13F | Parallel Advisors, LLC | 667 | 15 | ||||||
| 2025-07-11 | 13F | Kapstone Financial Advisors LLC | 18 077 | 401 | ||||||
| 2025-08-18 | 13F | Geneos Wealth Management Inc. | 623 | 72,58 | 14 | 85,71 | ||||
| 2025-08-08 | 13F | Larson Financial Group LLC | 752 | 26,17 | 17 | 33,33 | ||||
| 2025-05-13 | 13F | SHEPHERD WEALTH MANAGEMENT Ltd LIABILITY Co | 0 | −100,00 | 0 | |||||
| 2025-07-30 | 13F | FNY Investment Advisers, LLC | 8 200 | 355,56 | 0 | |||||
| 2025-08-14 | 13F/A | Rockefeller Capital Management L.P. | 10 000 | 222 | ||||||
| 2025-08-14 | 13F | CoreCap Advisors, LLC | 4 838 | 2 089,14 | 107 | 2 575,00 | ||||
| 2025-07-14 | 13F | Farmers & Merchants Investments Inc | 200 | 4 | ||||||
| 2025-08-12 | 13F | Park Square Financial Group, LLC | 464 | 10 | ||||||
| 2025-08-15 | 13F | Morgan Stanley | 70 810 | 210,73 | 1 570 | 238,88 | ||||
| 2025-07-25 | 13F | Almanack Investment Partners, LLC. | 16 183 | 359 | ||||||
| 2025-07-29 | 13F | Tradewinds Capital Management, LLC | 18 | 0 | ||||||
| 2025-07-10 | 13F | Secure Asset Management, LLC | 71 072 | 1 576 | ||||||
| 2025-08-13 | 13F | Walleye Capital LLC | 20 100 | 446 | ||||||
| 2025-08-07 | 13F | Allworth Financial LP | 1 238 | 27 | ||||||
| 2025-08-14 | 13F | Mercer Global Advisors Inc /adv | 90 315 | 0,21 | 2 002 | 9,28 | ||||
| 2025-07-25 | 13F | Hemington Wealth Management | 4 189 | 0,00 | 0 | |||||
| 2025-08-11 | 13F | Private Advisor Group, LLC | 502 370 | 35,66 | 11 138 | 47,94 | ||||
| 2025-08-15 | 13F | Kestra Advisory Services, LLC | 19 371 | 429 | ||||||
| 2025-07-24 | 13F | Ulland Investment Advisors, LLC | 354 | 0 | ||||||
| 2025-07-17 | 13F | Beacon Capital Management, LLC | 336 | −13,62 | 7 | 0,00 | ||||
| 2025-08-08 | 13F | Pnc Financial Services Group, Inc. | 301 300 | 6 680 | ||||||
| 2025-07-22 | 13F | Merit Financial Group, LLC | 65 361 | 18,53 | 1 449 | 29,26 | ||||
| 2025-06-27 | NP | Tidal Trust II - YieldMax(TM) Dorsey Wright Hybrid 5 Income ETF | 0 | −100,00 | 0 | −100,00 | ||||
| 2025-06-27 | NP | Tidal Trust II - YieldMax(TM) Dorsey Wright Featured 5 Income ETF | 0 | −100,00 | 0 | −100,00 | ||||
| 2025-08-07 | 13F | Kestra Private Wealth Services, Llc | 11 567 | 256 | ||||||
| 2025-08-14 | 13F | Keebeck Wealth Management, LLC | 60 335 | 76,67 | 1 338 | 92,65 | ||||
| 2025-07-07 | 13F | Versant Capital Management, Inc | 1 155 | 26 | ||||||
| 2025-07-30 | 13F | Capital Wealth Alliance, LLC | 15 126 | 335 | ||||||
| 2025-08-13 | 13F | Jump Financial, LLC | 425 060 | 9 424 | ||||||
| 2025-08-11 | 13F | Pin Oak Investment Advisors Inc | 50 | 0 | ||||||
| 2025-05-15 | 13F | Optiver Holding B.V. | 0 | −100,00 | 0 | |||||
| 2025-08-13 | 13F | Barclays Plc | 0 | −100,00 | 0 | |||||
| 2025-08-06 | 13F | Legacy Wealth Managment, LLC/ID | 12 048 | 267 | ||||||
| 2025-07-28 | 13F | Harbour Investments, Inc. | 306 | 146,77 | 7 | 200,00 | ||||
| 2025-08-12 | 13F | Steward Partners Investment Advisory, Llc | 2 886 | 64 | ||||||
| 2025-08-14 | 13F | Old Mission Capital Llc | 270 556 | 5 998 | ||||||
| 2025-07-22 | 13F | Blue Square Asset Management, Llc | 16 000 | 355 | ||||||
| 2025-07-25 | 13F | PrairieView Partners, LLC | 412 | 0 | ||||||
| 2025-09-04 | 13F/A | Advisor Group Holdings, Inc. | 14 059 | −15,44 | 312 | −7,99 | ||||
| 2025-08-05 | 13F | Bank Of Montreal /can/ | 670 | 15 | ||||||
| 2025-08-13 | 13F | M Holdings Securities, Inc. | 12 343 | 0 | ||||||
| 2025-07-31 | 13F | Ssa Swiss Advisors Ag | 4 801 | 101 | ||||||
| 2025-08-18 | 13F | N.E.W. Advisory Services LLC | 88 | 2 | ||||||
| 2025-07-11 | 13F | Farther Finance Advisors, LLC | 27 | 125,00 | 1 | |||||
| 2025-07-18 | 13F | Precision Wealth Strategies, LLC | 9 406 | 209 | ||||||
| 2025-08-12 | 13F | Legacy Financial Group, Inc. | 12 850 | 285 | ||||||
| 2025-08-13 | 13F | EverSource Wealth Advisors, LLC | 0 | −100,00 | 0 | |||||
| 2025-07-07 | 13F | Thurston, Springer, Miller, Herd & Titak, Inc. | 100 | 0,00 | 2 | 0,00 | ||||
| 2025-08-14 | 13F | Schonfeld Strategic Advisors LLC | 9 700 | −51,50 | 215 | −47,04 | ||||
| 2025-07-31 | 13F/A | Avion Wealth | 100 | 0 | ||||||
| 2025-08-08 | 13F | CFO4Life Group, LLC | 17 594 | 390 | ||||||
| 2025-07-22 | 13F | Wealthcare Advisory Partners LLC | 11 007 | 244 | ||||||
| 2025-07-23 | 13F | Evexia Wealth Llc | 53 800 | 1 166 | ||||||
| 2025-08-12 | 13F | Clear Street Markets Llc | 3 800 | 90,00 | 84 | 110,00 | ||||
| 2025-07-09 | 13F | Dynamic Advisor Solutions LLC | 29 991 | 22,89 | 665 | 33,87 | ||||
| 2025-08-01 | 13F | Envestnet Asset Management Inc | 92 335 | 25,41 | 2 047 | 36,83 | ||||
| 2025-07-17 | 13F | Nelson, Van Denburg & Campbell Wealth Management Group, LLC | 9 115 | 202 | ||||||
| 2025-08-14 | 13F | Ausdal Financial Partners, Inc. | 16 262 | 361 | ||||||
| 2025-08-06 | 13F | Commonwealth Equity Services, Llc | 92 418 | 668,36 | 2 | |||||
| 2025-07-22 | 13F | Team Financial Group, LLC | 487 | 11 | ||||||
| 2025-08-12 | 13F | CIBC Private Wealth Group, LLC | 1 760 | 39 | ||||||
| 2025-07-15 | 13F | Regatta Capital Group, Llc | 34 000 | 36,00 | 754 | 48,23 | ||||
| 2025-08-14 | 13F | Arete Wealth Advisors, LLC | 10 935 | 0,29 | 0 | |||||
| 2025-08-14 | 13F | Riggs Asset Managment Co. Inc. | 11 | 0 | ||||||
| 2025-08-04 | 13F | Creative Financial Designs Inc /adv | 316 | 7 | ||||||
| 2025-08-14 | 13F | Bank Of America Corp /de/ | 82 659 | 818,43 | 1 833 | 906,59 | ||||
| 2025-08-14 | 13F | Premier Financial Group | 338 | 7 | ||||||
| 2025-08-19 | 13F | Newbridge Financial Services Group, Inc. | 7 095 | 31,39 | 157 | 44,04 | ||||
| 2025-07-22 | 13F | Berger Financial Group, Inc | 12 934 | 287 | ||||||
| 2025-08-13 | 13F | Renaissance Technologies Llc | 182 800 | 4 053 | ||||||
| 2025-08-04 | 13F | Roble, Belko & Company, Inc | 15 | 0 | ||||||
| 2025-05-15 | 13F | Scientech Research LLC | 0 | −100,00 | 0 | |||||
| 2025-08-01 | 13F | Vision Financial Markets Llc | 1 021 | 139,11 | 23 | 175,00 |