Grundläggande statistik
| Institutionella ägare | 169 total, 166 long only, 0 short only, 3 long/short - change of 27,07% MRQ |
| Genomsnittlig portföljallokering | 0.0779 % - change of 165,15% MRQ |
| Institutionella aktier (lång) | 22 843 705 (ex 13D/G) - change of 3,28MM shares 16,76% MRQ |
| Institutionellt värde (lång) | $ 317 461 USD ($1000) |
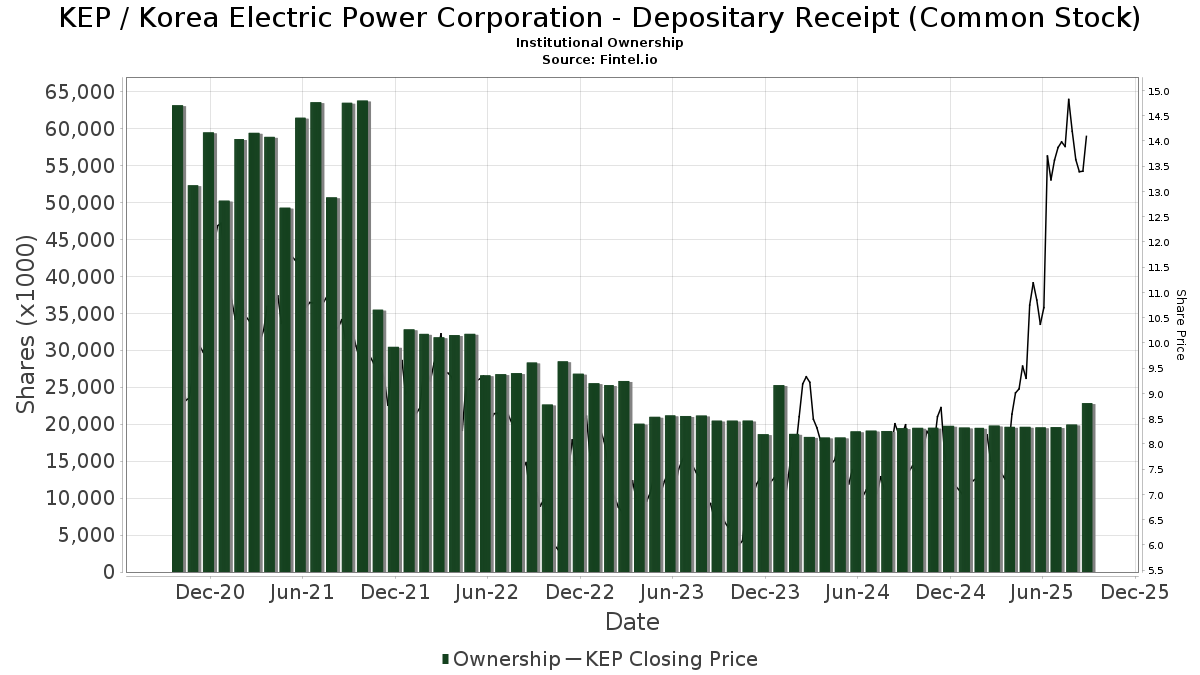
Institutionellt ägande och aktieägare
Korea Electric Power Corporation - Depositary Receipt (Common Stock) (US:KEP) har 169 Institutionella ägare och aktieägare som har lämnat in 13D/G- eller 13F-formulär till Securities Exchange Commission (SEC). Dessa institut innehar totalt 22,843,705 aktier. Största aktieägare inkluderar Morgan Stanley, Vanguard Group Inc, Causeway Capital Management Llc, Arrowstreet Capital, Limited Partnership, BlackRock, Inc., VGTSX - Vanguard Total International Stock Index Fund Investor Shares, Goldman Sachs Group Inc, Northern Trust Corp, State Street Corp, and SPDW - SPDR(R) Portfolio Developed World ex-US ETF .
Korea Electric Power Corporation - Depositary Receipt (Common Stock) (NYSE:KEP) Institutionell ägarstruktur visar institutioners och fonders nuvarande positioner i företaget, samt de senaste förändringarna i positionernas storlek. Större aktieägare kan vara enskilda investerare, fonder, hedgefonder eller institutioner. Bilaga 13D visar att investeraren äger (eller ägde) mer än 5% av företaget och avser (eller avsåg) att aktivt eftersträva en förändring av affärsstrategin. Schedule 13G indikerar en passiv investering på över 5%.
The share price as of September 11, 2025 is 13,73 / share. Previously, on September 12, 2024, the share price was 8,22 / share. This represents an increase of 67,03% over that period.
Fondsentimentets poäng
Fondsentimentet poängen(fka Ägarackumulation-poäng) visar vilka aktier som är mest köpta av fonder. Det är resultatet av en sofistikerad kvantitativ flerfaktormodell som identifierar företag med de högsta nivåerna av institutionell ackumulering. Poängsättningsmodellen använder en kombination av den totala ökningen av redovisade ägare, förändringarna i portföljallokeringarna för dessa ägare och andra mått. Siffran sträcker sig från 0 till 100, där högre siffror indikerar en högre nivå av ackumulering i förhållande till sina konkurrenter, och 50 är genomsnittet.
Uppdateringsfrekvens: Dagligen
Se Ownership Explorer, som innehåller en lista över de högst rankade företagen.
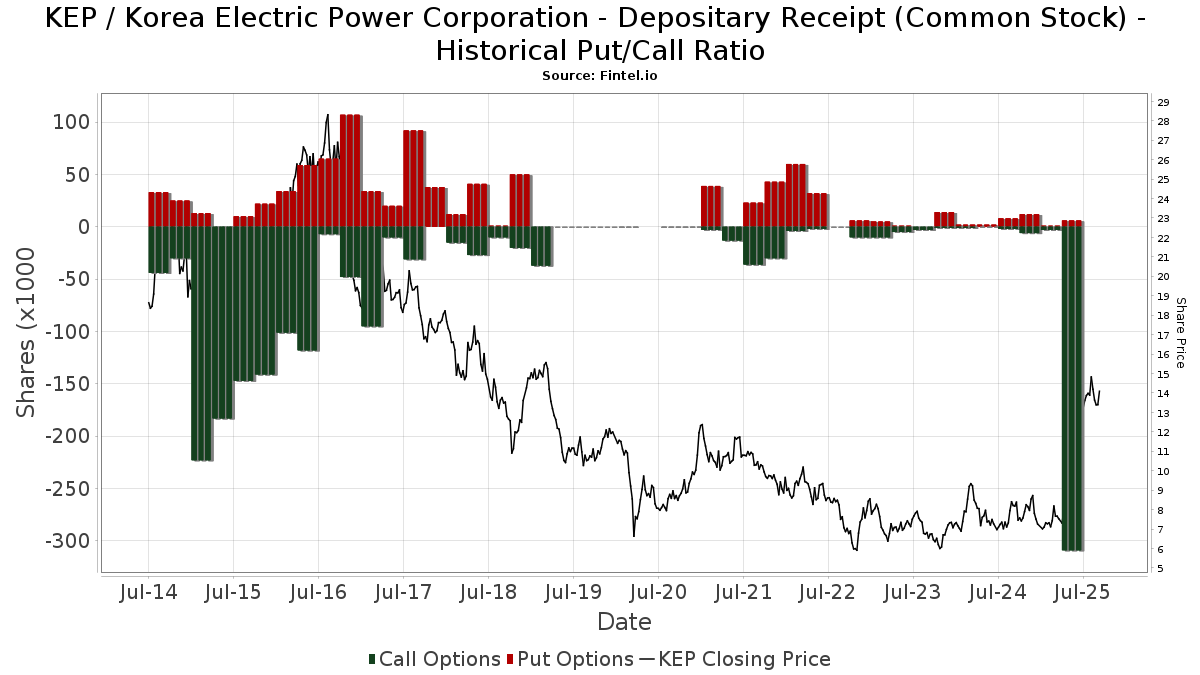
Institutionell sälj/köp-kvot
Förutom att rapportera vanliga eget kapital- och skuldemissioner måste institutioner med mer än 100MM tillgångar under förvaltning också avslöja sina innehav av sälj- och köpoptioner. Eftersom säljoptioner i allmänhet indikerar ett negativt sentiment och köpoptioner indikerar ett positivt sentiment, kan vi få en uppfattning om det övergripande institutionella sentimentet genom att plotta förhållandet mellan säljoptioner och köpoptioner. Diagrammet till höger visar det historiska förhållandet mellan sälj- och köpoptioner för detta instrument.
Genom att använda sälj/köp-kvoten som en indikator på aktieägarnas sentiment undviker man en av de största bristerna med att använda det totala institutionella ägandet, nämligen att en betydande del av de förvaltade tillgångarna investeras passivt för att följa index. Passivt förvaltade fonder köper vanligtvis inte optioner, så indikatorn för sälj/köp-kvoten ger en bättre bild av stämningen i aktivt förvaltade fonder.
13F- och NPORT-arkiveringar
Detaljer om 13F-arkiveringar är gratis. Detaljer om NP-arkiveringar kräver ett premiummedlemskap. Gröna rader indikerar nya positioner. Röda rader indikerar stängda positioner. Klicka på länk symbolen för att se hela transaktionshistoriken.
Uppgradera
för att låsa upp premiumdata och exportera till Excel ![]() .
.
| Fil Datum | Källa | Investerare | Typ | Genomsnittligt pris (beräknat) |
Aktier | Δ Aktier (%) |
Rapporterat värde (1000 USD) |
Δ Värde (%) |
Portföljallokering (%) |
|
|---|---|---|---|---|---|---|---|---|---|---|
| 2025-05-14 | 13F | Trexquant Investment LP | 0 | −100,00 | 0 | |||||
| 2025-08-14 | 13F | Citadel Advisors Llc | Put | 0 | −100,00 | 0 | ||||
| 2025-08-12 | 13F | Global Retirement Partners, LLC | 0 | −100,00 | 0 | |||||
| 2025-08-13 | 13F | Causeway Capital Management Llc | 1 220 320 | 17 194 | ||||||
| 2025-08-11 | 13F | Citigroup Inc | 29 008 | 15,96 | 413 | 123,24 | ||||
| 2025-08-12 | 13F | LPL Financial LLC | 18 109 | 258 | ||||||
| 2025-08-14 | 13F | Raymond James Financial Inc | 44 719 | 637 | ||||||
| 2025-08-15 | 13F | Tower Research Capital LLC (TRC) | 0 | −100,00 | 0 | |||||
| 2025-09-04 | 13F/A | Advisor Group Holdings, Inc. | 3 447 | 1 144,40 | 49 | 2 350,00 | ||||
| 2025-08-12 | 13F | American Century Companies Inc | 530 743 | 19,79 | 7 558 | 130,19 | ||||
| 2025-08-14 | 13F | Two Sigma Investments, Lp | 20 774 | 296 | ||||||
| 2025-08-05 | 13F | NewSquare Capital LLC | 456 | 99,13 | 6 | 500,00 | ||||
| 2025-05-15 | 13F | Centiva Capital, LP | 0 | −100,00 | 0 | −100,00 | ||||
| 2025-08-14 | 13F | Hrt Financial Lp | 63 654 | 1 | ||||||
| 2025-05-15 | 13F | Rise Advisors, LLC | 0 | −100,00 | 0 | |||||
| 2025-08-12 | 13F | Coldstream Capital Management Inc | 12 105 | 21,39 | 172 | 135,62 | ||||
| 2025-08-08 | 13F | Cetera Investment Advisers | 20 162 | −4,54 | 287 | 83,97 | ||||
| 2025-07-11 | 13F | Farther Finance Advisors, LLC | 1 559 | 4,63 | 22 | 120,00 | ||||
| 2025-07-31 | 13F | Nisa Investment Advisors, Llc | 1 500 | 0,00 | 21 | 90,91 | ||||
| 2025-08-08 | 13F/A | Sterling Capital Management LLC | 18 861 | 269 | ||||||
| 2025-08-14 | 13F | Quantinno Capital Management LP | 259 649 | 90,32 | 3 697 | 266,04 | ||||
| 2025-08-13 | 13F | Bare Financial Services, Inc | 551 | 166,18 | 8 | 600,00 | ||||
| 2025-07-21 | 13F | HighMark Wealth Management LLC | 100 | 0,00 | 1 | |||||
| 2025-08-14 | 13F | Diversify Advisory Services, LLC | 25 540 | 360 | ||||||
| 2025-08-04 | 13F | Spire Wealth Management | 187 | 0,00 | 3 | 100,00 | ||||
| 2025-08-08 | 13F | Pnc Financial Services Group, Inc. | 60 668 | 23,46 | 864 | 137,09 | ||||
| 2025-07-18 | 13F | Generali Investments CEE, investicni spolecnost, a.s. | 48 200 | 0,00 | 686 | 92,16 | ||||
| 2025-08-01 | 13F | Envestnet Asset Management Inc | 189 490 | 2 698 | ||||||
| 2025-07-09 | 13F | Sivia Capital Partners, LLC | 16 222 | −9,24 | 231 | 75,00 | ||||
| 2025-07-31 | 13F | Oppenheimer Asset Management Inc. | 49 353 | 703 | ||||||
| 2025-08-28 | NP | IDVO - Amplify International Enhanced Dividend Income ETF | 202 308 | 2 881 | ||||||
| 2025-08-14 | 13F | Bnp Paribas Arbitrage, Sa | 13 274 | −39,82 | 189 | 15,95 | ||||
| 2025-08-13 | 13F | Arrowstreet Capital, Limited Partnership | 1 201 548 | 22,02 | 17 110 | 134,51 | ||||
| 2025-08-29 | NP | Gabelli Dividend & Income Trust | 115 000 | 0,00 | 1 638 | 92,14 | ||||
| 2025-06-18 | NP | RMYAX - Multi-Strategy Income Fund Class A | 3 098 | −35,97 | 28 | −20,00 | ||||
| 2025-08-05 | 13F | Key FInancial Inc | 580 | 0,00 | 8 | 100,00 | ||||
| 2025-05-05 | 13F | Private Advisor Group, LLC | 0 | −100,00 | 0 | |||||
| 2025-07-25 | 13F | Yousif Capital Management, Llc | 23 954 | 21,32 | 341 | 133,56 | ||||
| 2025-08-14 | 13F | Royal Bank Of Canada | 50 387 | 1 579,57 | 717 | 3 159,09 | ||||
| 2025-07-25 | 13F | Sequoia Financial Advisors, LLC | 64 355 | 6,01 | 916 | 104,01 | ||||
| 2025-08-12 | 13F | Dimensional Fund Advisors Lp | 678 329 | 4,92 | 9 655 | 101,50 | ||||
| 2025-08-13 | 13F | GeoWealth Management, LLC | 8 605 | 123 | ||||||
| 2025-08-18 | 13F | Geneos Wealth Management Inc. | 468 | 7 | ||||||
| 2025-07-15 | 13F | Public Employees Retirement System Of Ohio | 33 917 | −41,89 | 483 | 11,57 | ||||
| 2025-05-15 | 13F/A | Orion Portfolio Solutions, LLC | 23 295 | 6,39 | 173 | 14,67 | ||||
| 2025-05-05 | 13F | Lindbrook Capital, Llc | 1 086 | −8,12 | 8 | 0,00 | ||||
| 2025-08-29 | NP | Gabelli Global Utility & Income Trust | 35 000 | 0,00 | 498 | 92,28 | ||||
| 2025-08-28 | NP | SPDW - SPDR(R) Portfolio Developed World ex-US ETF | 717 718 | 2,78 | 10 220 | 97,53 | ||||
| 2025-08-15 | 13F | Morgan Stanley | 6 003 052 | 7,27 | 85 483 | 106,14 | ||||
| 2025-06-26 | NP | DFAX - Dimensional World ex U.S. Core Equity 2 ETF | 18 475 | 0,00 | 168 | 25,56 | ||||
| 2025-07-16 | 13F | Signaturefd, Llc | 23 521 | 0,00 | 335 | 91,95 | ||||
| 2025-07-24 | 13F | Ramirez Asset Management, Inc. | 278 651 | −0,47 | 3 968 | 91,27 | ||||
| 2025-05-06 | 13F | Advisors Preferred, LLC | 0 | −100,00 | 0 | |||||
| 2025-07-25 | 13F | Cwm, Llc | 10 901 | −7,54 | 0 | |||||
| 2025-08-26 | NP | EHLS - Even Herd Long Short ETF | 26 888 | 383 | ||||||
| 2025-06-26 | NP | DFEM - Dimensional Emerging Markets Core Equity 2 ETF | 81 954 | 12,05 | 745 | 40,38 | ||||
| 2025-08-07 | 13F | Vise Technologies, Inc. | 19 844 | 52,79 | 283 | 216,85 | ||||
| 2025-08-14 | 13F | Qube Research & Technologies Ltd | 0 | −100,00 | 0 | |||||
| 2025-04-21 | 13F | Nelson, Van Denburg & Campbell Wealth Management Group, LLC | 0 | −100,00 | 0 | |||||
| 2025-08-05 | 13F | GHP Investment Advisors, Inc. | 0 | −100,00 | 0 | |||||
| 2025-06-26 | NP | DEXC - Dimensional Emerging Markets ex China Core Equity ETF | 8 160 | 19,33 | 74 | 51,02 | ||||
| 2025-07-28 | NP | NSI - National Security Emerging Markets Index ETF | 7 449 | 38,48 | 82 | 110,26 | ||||
| 2025-06-26 | NP | DFAE - Dimensional Emerging Core Equity Market ETF | 98 650 | 29,60 | 897 | 62,61 | ||||
| 2025-08-28 | NP | QEMM - SPDR MSCI Emerging Markets StrategicFactors ETF | 2 984 | 0,00 | 42 | 90,91 | ||||
| 2025-08-13 | 13F | West Family Investments, Inc. | 13 948 | 0,00 | 199 | 92,23 | ||||
| 2025-08-13 | 13F | Walleye Capital LLC | 242 832 | 216,69 | 3 458 | 508,63 | ||||
| 2025-08-14 | 13F | D. E. Shaw & Co., Inc. | 119 425 | −33,03 | 1 701 | 28,69 | ||||
| 2025-08-12 | 13F | Proequities, Inc. | Put | 0 | 0 | |||||
| 2025-08-12 | 13F | Proequities, Inc. | Call | 0 | 0 | |||||
| 2025-08-12 | 13F | Proequities, Inc. | 0 | 0 | ||||||
| 2025-08-14 | 13F | Kopernik Global Investors, LLC | 268 151 | −75,62 | 3 818 | −53,15 | ||||
| 2025-08-04 | 13F | Assetmark, Inc | 30 | 0 | ||||||
| 2025-08-11 | 13F | Principal Securities, Inc. | 186 | 3 | ||||||
| 2025-08-14 | 13F | GWM Advisors LLC | 248 | 0,40 | 4 | 200,00 | ||||
| 2025-07-10 | 13F | Wealth Enhancement Advisory Services, Llc | 15 058 | 201 | ||||||
| 2025-08-13 | 13F | Donald Smith & Co., Inc. | 9 149 | −99,23 | 130 | −98,52 | ||||
| 2025-08-28 | NP | CWI - SPDR(R) MSCI ACWI EX-US ETF | 43 109 | 0,35 | 614 | 92,77 | ||||
| 2025-08-14 | 13F | Bank Of America Corp /de/ | 371 494 | 133,67 | 5 290 | 349,07 | ||||
| 2025-08-07 | 13F | Campbell & CO Investment Adviser LLC | 50 740 | −25,24 | 723 | 43,82 | ||||
| 2025-08-04 | 13F | Simon Quick Advisors, Llc | 10 300 | 147 | ||||||
| 2025-08-12 | 13F | Seeds Investor Llc | 11 176 | 159 | ||||||
| 2025-08-14 | 13F | State Street Corp | 818 515 | 2,47 | 11 656 | 96,91 | ||||
| 2025-08-20 | NP | REMG - Emerging Markets Equity Active ETF | 15 576 | 222 | ||||||
| 2025-08-12 | 13F | Jpmorgan Chase & Co | 790 | −27,99 | 11 | 37,50 | ||||
| 2025-07-14 | 13F | Abound Wealth Management | 63 | −21,25 | 1 | |||||
| 2025-05-16 | 13F | Jones Financial Companies Lllp | 0 | −100,00 | 0 | |||||
| 2025-08-11 | 13F | Bell Investment Advisors, Inc | 469 | 300,85 | 7 | |||||
| 2025-08-12 | 13F | Virtu Financial LLC | 0 | −100,00 | 0 | |||||
| 2025-08-13 | 13F | Gabelli Funds Llc | 381 000 | 0,00 | 5 425 | 92,17 | ||||
| 2025-08-14 | 13F | Atomi Financial Group, Inc. | 16 797 | 4,30 | 239 | 100,84 | ||||
| 2025-08-13 | 13F | Russell Investments Group, Ltd. | 203 420 | −19,80 | 2 897 | 54,12 | ||||
| 2025-06-26 | NP | KGIIX - KOPERNIK INTERNATIONAL FUND CLASS I SHARES | 86 677 | 0,00 | 788 | 25,32 | ||||
| 2025-08-18 | 13F/A | National Bank Of Canada /fi/ | 366 | 5 | ||||||
| 2025-07-24 | 13F | Jfs Wealth Advisors, Llc | 653 | 11,82 | 9 | 125,00 | ||||
| 2025-08-13 | 13F | Twin Peaks Wealth Advisors, LLC | 182 | 3 | ||||||
| 2025-08-14 | 13F | Aqr Capital Management Llc | 59 257 | 102,86 | 844 | 290,28 | ||||
| 2025-08-14 | 13F | Group One Trading, L.p. | Call | 5 600 | 180,00 | 80 | 464,29 | |||
| 2025-08-14 | 13F | Group One Trading, L.p. | 901 | 1 225,00 | 13 | |||||
| 2025-08-14 | 13F | Group One Trading, L.p. | Put | 1 700 | 24 | |||||
| 2025-08-07 | 13F | Connor, Clark & Lunn Investment Management Ltd. | 336 913 | −16,96 | 4 798 | 59,58 | ||||
| 2025-05-09 | 13F | R Squared Ltd | 0 | −100,00 | 0 | |||||
| 2025-08-08 | 13F | Creative Planning | 12 556 | 179 | ||||||
| 2025-08-11 | 13F | WPG Advisers, LLC | 109 | 2 | ||||||
| 2025-07-28 | NP | AVEEX - Avantis Emerging Markets Equity Fund Institutional Class This fund is a listed as child fund of American Century Companies Inc and if that institution has disclosed ownership in this security, then these positions will not be double counted when calculating total shares and total value | 20 470 | 0,00 | 226 | 51,68 | ||||
| 2025-07-08 | 13F | Parallel Advisors, LLC | 1 476 | −11,51 | 21 | 75,00 | ||||
| 2025-08-12 | 13F | Atlas Capital Advisors Llc | 32 952 | 158,77 | 469 | 398,94 | ||||
| 2025-05-12 | 13F | Townsquare Capital Llc | 0 | −100,00 | 0 | |||||
| 2025-07-28 | NP | AVEM - Avantis Emerging Markets Equity ETF This fund is a listed as child fund of American Century Companies Inc and if that institution has disclosed ownership in this security, then these positions will not be double counted when calculating total shares and total value | 493 896 | 21,44 | 5 458 | 83,80 | ||||
| 2025-06-30 | 13F/A | Deutsche Bank Ag\ | 0 | −100,00 | 0 | |||||
| 2025-08-05 | 13F | Simplex Trading, Llc | Put | 600 | 0 | |||||
| 2025-08-26 | NP | EMIF - iShares Emerging Markets Infrastructure ETF | 27 693 | −29,37 | 394 | 29,61 | ||||
| 2025-08-05 | 13F | Simplex Trading, Llc | 77 994 | 1 | ||||||
| 2025-08-13 | 13F | Marshall Wace, Llp | 191 445 | 3,42 | 2 726 | 98,83 | ||||
| 2025-08-05 | 13F | Simplex Trading, Llc | Call | 1 000 | 100,00 | 0 | ||||
| 2025-08-13 | 13F | Cerity Partners LLC | 135 299 | −6,98 | 1 927 | 78,83 | ||||
| 2025-05-01 | 13F | Schechter Investment Advisors, LLC | 0 | −100,00 | 0 | |||||
| 2025-06-30 | NP | VGTSX - Vanguard Total International Stock Index Fund Investor Shares | 956 690 | 0,00 | 8 696 | 25,37 | ||||
| 2025-08-05 | 13F | Huntington National Bank | 1 | 0,00 | 0 | |||||
| 2025-07-07 | 13F | Northwest & Ethical Investments L.P. | 0 | −100,00 | 0 | −100,00 | ||||
| 2025-08-15 | 13F | Binnacle Investments Inc | 59 | 1 | ||||||
| 2025-06-26 | NP | DFCEX - Emerging Markets Core Equity Portfolio - Institutional Class This fund is a listed as child fund of Dimensional Fund Advisors Lp and if that institution has disclosed ownership in this security, then these positions will not be double counted when calculating total shares and total value | 326 264 | 0,00 | 2 966 | 25,37 | ||||
| 2025-08-29 | NP | Gabelli Utility Trust | 38 000 | 0,00 | 541 | 92,53 | ||||
| 2025-08-14 | 13F | Goldman Sachs Group Inc | 859 893 | 1,18 | 12 245 | 94,44 | ||||
| 2025-07-14 | 13F | GAMMA Investing LLC | 15 343 | 169,60 | 218 | 419,05 | ||||
| 2025-08-28 | NP | SPGM - SPDR(R) Portfolio MSCI Global Stock Market ETF | 4 989 | 2,97 | 71 | 102,86 | ||||
| 2025-08-12 | 13F | XTX Topco Ltd | 17 410 | 248 | ||||||
| 2025-07-24 | 13F | Ronald Blue Trust, Inc. | 34 023 | 12,47 | 484 | 116,07 | ||||
| 2025-08-04 | 13F | Hantz Financial Services, Inc. | 2 757 | 204,30 | 0 | |||||
| 2025-07-25 | 13F | JustInvest LLC | 175 690 | 57,21 | 2 502 | 202,05 | ||||
| 2025-08-12 | 13F | BlackRock, Inc. | 1 003 546 | 24,81 | 14 290 | 139,89 | ||||
| 2025-08-13 | 13F | EverSource Wealth Advisors, LLC | 17 187 | −0,54 | 245 | 90,63 | ||||
| 2025-07-28 | NP | AVXC - Avantis Emerging Markets ex-China Equity ETF | 4 725 | 33,14 | 52 | 108,00 | ||||
| 2025-07-30 | NP | APIE - ActivePassive International Equity ETF | 11 530 | 127 | ||||||
| 2025-08-14 | 13F | Kovitz Investment Group Partners, LLC | 11 472 | 163 | ||||||
| 2025-08-29 | NP | GCAEX - The Gabelli Equity Income Fund Class A | 5 000 | 0,00 | 71 | 91,89 | ||||
| 2025-07-31 | 13F | Whipplewood Advisors, LLC | 325 | 5 | ||||||
| 2025-08-12 | 13F | MAI Capital Management | 6 556 | 93 | ||||||
| 2025-07-17 | 13F | Janney Montgomery Scott LLC | 57 896 | 1 | ||||||
| 2025-08-15 | 13F | WealthCollab, LLC | 49 | 0,00 | 1 | |||||
| 2025-08-13 | 13F | Quadrant Capital Group Llc | 171 595 | 369,12 | 2 444 | 801,48 | ||||
| 2025-08-14 | 13F | Wetherby Asset Management Inc | 30 636 | −0,08 | 436 | 107,62 | ||||
| 2025-08-12 | 13F | Summit Global Investments | 44 281 | 1 | ||||||
| 2025-08-14 | 13F | Citadel Advisors Llc | 105 935 | 17,03 | 1 509 | 125,07 | ||||
| 2025-08-14 | 13F | Stifel Financial Corp | 21 505 | 17,84 | 306 | 126,67 | ||||
| 2025-08-14 | 13F | Ieq Capital, Llc | 34 563 | 242,51 | 492 | 564,86 | ||||
| 2025-08-14 | 13F | Citadel Advisors Llc | Call | 12 700 | 1 714,29 | 181 | 3 500,00 | |||
| 2025-08-12 | 13F | Pathstone Holdings, LLC | 166 737 | 431,84 | 2 374 | 923,28 | ||||
| 2025-07-24 | 13F | Us Bancorp \de\ | 9 266 | 0,00 | 132 | 92,65 | ||||
| 2025-08-27 | NP | TIFF INVESTMENT PROGRAM - TIFF Multi-Asset Fund | 66 802 | −37,04 | 951 | 20,99 | ||||
| 2025-08-14 | 13F/A | Skopos Labs, Inc. | 5 979 | 225,12 | 85 | 553,85 | ||||
| 2025-06-26 | NP | DFA INVESTMENT DIMENSIONS GROUP INC - World ex U.S. Core Equity Portfolio Institutional Class Shares | 1 200 | 0,00 | 11 | 25,00 | ||||
| 2025-07-07 | 13F | Thurston, Springer, Miller, Herd & Titak, Inc. | 0 | −100,00 | 0 | |||||
| 2025-05-05 | 13F | Transce3nd, LLC | 0 | −100,00 | 0 | |||||
| 2025-08-14 | 13F | Vident Advisory, LLC | 179 369 | 16,04 | 2 554 | 123,06 | ||||
| 2025-08-07 | 13F | Capital Wealth Planning, LLC | 203 428 | 2 897 | ||||||
| 2025-08-14 | 13F | Toroso Investments, LLC | 26 888 | 383 | ||||||
| 2025-08-12 | 13F | Rhumbline Advisers | 163 208 | 0,73 | 2 324 | 93,67 | ||||
| 2025-08-07 | 13F | Allworth Financial LP | 952 | 0,00 | 14 | 62,50 | ||||
| 2025-08-13 | 13F | Northern Trust Corp | 842 080 | 160,34 | 11 991 | 400,46 | ||||
| 2025-08-14 | 13F | Mariner, LLC | 90 291 | 17,76 | 1 286 | 126,23 | ||||
| 2025-08-14 | 13F | Millennium Management Llc | 0 | −100,00 | 0 | |||||
| 2025-08-14 | 13F | Diversify Wealth Management, Llc | 87 481 | 1 232 | ||||||
| 2025-08-29 | NP | JVANX - International Equity Index Trust NAV | 4 277 | 0,00 | 61 | 93,55 | ||||
| 2025-08-12 | 13F | O'shaughnessy Asset Management, Llc | 20 896 | 8,48 | 298 | 109,15 | ||||
| 2025-06-26 | NP | DAADX - Emerging Markets ex China Core Equity Portfolio Institutional Class | 22 118 | 0,00 | 201 | 25,63 | ||||
| 2025-08-14 | 13F | Ariadne Wealth Management, LP | 14 940 | 212 | ||||||
| 2025-07-28 | 13F | BRYN MAWR TRUST Co | 4 500 | 0,00 | 64 | 93,94 | ||||
| 2025-08-14 | 13F | Susquehanna International Group, Llp | 67 500 | 961 | ||||||
| 2025-06-30 | NP | VEU - Vanguard FTSE All-World ex-US Index Fund ETF Shares | 323 139 | 4,37 | 2 937 | 30,88 | ||||
| 2025-08-13 | 13F | Northwestern Mutual Wealth Management Co | 2 323 | −59,55 | 33 | −21,43 | ||||
| 2025-08-14 | 13F | Sei Investments Co | 142 109 | 122,49 | 2 024 | 327,70 | ||||
| 2025-08-11 | 13F | TD Waterhouse Canada Inc. | 247 | 3 | ||||||
| 2025-08-14 | 13F | Wells Fargo & Company/mn | 1 427 | 367,87 | 20 | 900,00 | ||||
| 2025-08-14 | 13F | Fmr Llc | 143 844 | 54,84 | 2 048 | 197,67 | ||||
| 2025-05-29 | NP | MCTOX - Modern Capital Tactical Opportunities Fund Class A Shares | 57 699 | −17,60 | 428 | −11,23 | ||||
| 2025-08-12 | 13F | SRS Capital Advisors, Inc. | 1 254 | 18 | ||||||
| 2025-08-11 | 13F | Pinnacle Wealth Planning Services, Inc. | 23 465 | 38,96 | 334 | 167,20 | ||||
| 2025-08-27 | 13F/A | Brinker Capital Investments, LLC | 38 871 | 66,86 | 554 | 221,51 | ||||
| 2025-08-11 | 13F | Vanguard Group Inc | 1 346 340 | 2,59 | 19 172 | 97,15 | ||||
| 2025-08-13 | 13F | Natixis Advisors, L.p. | 107 800 | 2 | ||||||
| 2025-05-05 | 13F | IFP Advisors, Inc | 0 | −100,00 | 0 | |||||
| 2025-08-14 | 13F | UBS Group AG | 376 794 | −3,70 | 5 366 | 85,06 | ||||
| 2025-08-15 | 13F | CI Private Wealth, LLC | 153 117 | 1,62 | 2 180 | 95,34 | ||||
| 2025-07-29 | 13F | Wealthstream Advisors, Inc. | 11 867 | 169 | ||||||
| 2025-08-14 | 13F | Jane Street Group, Llc | 242 154 | 3 448 | ||||||
| 2025-08-29 | NP | GAUAX - The Gabelli Utilities Fund Class A | 188 000 | 0,00 | 2 677 | 92,18 | ||||
| 2025-08-11 | 13F | EntryPoint Capital, LLC | 20 351 | −24,65 | 290 | 44,50 | ||||
| 2025-08-14 | 13F | Ameriprise Financial Inc | 13 198 | 27,88 | 188 | 146,05 | ||||
| 2025-08-06 | 13F | True Wealth Design, LLC | 103 | 0,00 | 1 | |||||
| 2025-06-18 | NP | RAZAX - Multi-Asset Growth Strategy Fund Class A | 11 267 | 0,00 | 102 | 25,93 | ||||
| 2025-08-14 | 13F | Cubist Systematic Strategies, LLC | 0 | −100,00 | 0 | |||||
| 2025-05-06 | 13F | Venturi Wealth Management, LLC | 0 | −100,00 | 0 | |||||
| 2025-08-14 | 13F | Barometer Capital Management Inc. | 17 015 | 0,00 | 242 | 92,06 | ||||
| 2025-08-14 | 13F | Smartleaf Asset Management LLC | 0 | −100,00 | 0 | |||||
| 2025-08-11 | 13F | HighTower Advisors, LLC | 13 595 | 194 | ||||||
| 2025-08-13 | 13F | First Trust Advisors Lp | 31 215 | −17,61 | 445 | 58,57 | ||||
| 2025-08-08 | 13F | SBI Securities Co., Ltd. | 3 | −25,00 | 0 | |||||
| 2025-05-15 | 13F | Engineers Gate Manager LP | 0 | −100,00 | 0 | |||||
| 2025-08-07 | 13F | Sierra Ocean, Llc | 1 241 | −10,53 | 18 | 70,00 | ||||
| 2025-08-08 | NP | QGBLX - Quantified Global Fund Investor Class | 26 098 | 372 | ||||||
| 2025-08-11 | 13F | Inspire Advisors, LLC | 16 900 | −14,10 | 241 | 65,52 | ||||
| 2025-07-24 | 13F | PDS Planning, Inc | 26 753 | −0,24 | 381 | 91,92 | ||||
| 2025-08-14 | 13F | Peak6 Llc | Put | 4 000 | 57 | |||||
| 2025-08-14 | 13F | Peak6 Llc | Call | 290 500 | 4 137 |
Other Listings
| DE:KOP | 11,50 € |