Grundläggande statistik
| Institutionella ägare | 100 total, 100 long only, 0 short only, 0 long/short - change of 1,01% MRQ |
| Genomsnittlig portföljallokering | 0.1771 % - change of 20,33% MRQ |
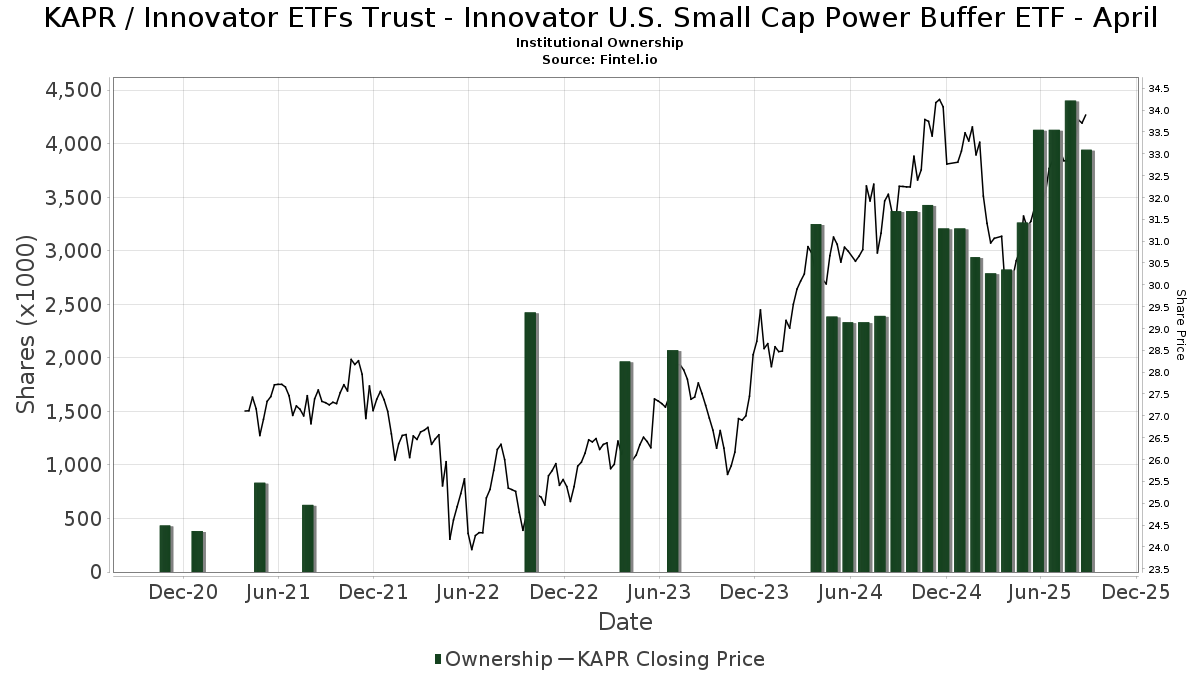
| Institutionella aktier (lång) | 3 944 150 (ex 13D/G) - change of −0,19MM shares −4,51% MRQ |
| Institutionellt värde (lång) | $ 111 711 USD ($1000) |
Institutionellt ägande och aktieägare
Innovator ETFs Trust - Innovator U.S. Small Cap Power Buffer ETF - April (US:KAPR) har 100 Institutionella ägare och aktieägare som har lämnat in 13D/G- eller 13F-formulär till Securities Exchange Commission (SEC). Dessa institut innehar totalt 3,944,150 aktier. Största aktieägare inkluderar Cetera Investment Advisers, Jane Street Group, Llc, Commonwealth Equity Services, Llc, Advisor Group Holdings, Inc., ODonnell Financial Services, LLC, Tradition Wealth Management, LLC, Kestra Advisory Services, LLC, Red Crane Wealth Management, Llc, Berkshire Money Management, Inc., and Blair William & Co/il .
Innovator ETFs Trust - Innovator U.S. Small Cap Power Buffer ETF - April (BATS:KAPR) Institutionell ägarstruktur visar institutioners och fonders nuvarande positioner i företaget, samt de senaste förändringarna i positionernas storlek. Större aktieägare kan vara enskilda investerare, fonder, hedgefonder eller institutioner. Bilaga 13D visar att investeraren äger (eller ägde) mer än 5% av företaget och avser (eller avsåg) att aktivt eftersträva en förändring av affärsstrategin. Schedule 13G indikerar en passiv investering på över 5%.
The share price as of September 10, 2025 is 33,88 / share. Previously, on September 11, 2024, the share price was 31,46 / share. This represents an increase of 7,71% over that period.
Fondsentimentets poäng
Fondsentimentet poängen(fka Ägarackumulation-poäng) visar vilka aktier som är mest köpta av fonder. Det är resultatet av en sofistikerad kvantitativ flerfaktormodell som identifierar företag med de högsta nivåerna av institutionell ackumulering. Poängsättningsmodellen använder en kombination av den totala ökningen av redovisade ägare, förändringarna i portföljallokeringarna för dessa ägare och andra mått. Siffran sträcker sig från 0 till 100, där högre siffror indikerar en högre nivå av ackumulering i förhållande till sina konkurrenter, och 50 är genomsnittet.
Uppdateringsfrekvens: Dagligen
Se Ownership Explorer, som innehåller en lista över de högst rankade företagen.
Institutionell sälj/köp-kvot
Förutom att rapportera vanliga eget kapital- och skuldemissioner måste institutioner med mer än 100MM tillgångar under förvaltning också avslöja sina innehav av sälj- och köpoptioner. Eftersom säljoptioner i allmänhet indikerar ett negativt sentiment och köpoptioner indikerar ett positivt sentiment, kan vi få en uppfattning om det övergripande institutionella sentimentet genom att plotta förhållandet mellan säljoptioner och köpoptioner. Diagrammet till höger visar det historiska förhållandet mellan sälj- och köpoptioner för detta instrument.
Genom att använda sälj/köp-kvoten som en indikator på aktieägarnas sentiment undviker man en av de största bristerna med att använda det totala institutionella ägandet, nämligen att en betydande del av de förvaltade tillgångarna investeras passivt för att följa index. Passivt förvaltade fonder köper vanligtvis inte optioner, så indikatorn för sälj/köp-kvoten ger en bättre bild av stämningen i aktivt förvaltade fonder.
13F- och NPORT-arkiveringar
Detaljer om 13F-arkiveringar är gratis. Detaljer om NP-arkiveringar kräver ett premiummedlemskap. Gröna rader indikerar nya positioner. Röda rader indikerar stängda positioner. Klicka på länk symbolen för att se hela transaktionshistoriken.
Uppgradera
för att låsa upp premiumdata och exportera till Excel ![]() .
.
| Fil Datum | Källa | Investerare | Typ | Genomsnittligt pris (beräknat) |
Aktier | Δ Aktier (%) |
Rapporterat värde (1000 USD) |
Δ Värde (%) |
Portföljallokering (%) |
|
|---|---|---|---|---|---|---|---|---|---|---|
| 2025-08-12 | 13F | LPL Financial LLC | 51 146 | 28,91 | 1 656 | 35,29 | ||||
| 2025-08-12 | 13F | Miller Financial Services LLC | 23 660 | −2,97 | 766 | 1,86 | ||||
| 2025-08-14 | 13F | Helium Advisors LLC | 11 222 | 363 | ||||||
| 2025-07-17 | 13F | Clear Point Advisors Inc. | 15 459 | 5,51 | 501 | 4,38 | ||||
| 2025-07-09 | 13F | Fragasso Group Inc. | 29 566 | 18,35 | 958 | 24,29 | ||||
| 2025-08-14 | 13F | Visionary Wealth Advisors | 9 452 | 306 | ||||||
| 2025-07-22 | 13F | Merit Financial Group, LLC | 16 829 | 545 | ||||||
| 2025-05-09 | 13F | Cary Street Partners Financial Llc | 0 | −100,00 | 0 | |||||
| 2025-07-22 | 13F | Berger Financial Group, Inc | 27 934 | 174,05 | 905 | 187,90 | ||||
| 2025-07-28 | 13F | Harbour Investments, Inc. | 4 221 | 25,96 | 137 | 32,04 | ||||
| 2025-08-14 | 13F | Wells Fargo & Company/mn | 753 | 0,00 | 24 | 4,35 | ||||
| 2025-08-07 | 13F | Allworth Financial LP | 2 553 | −99,61 | 83 | −99,59 | ||||
| 2025-07-30 | 13F | Brookstone Capital Management | 6 456 | 209 | ||||||
| 2025-07-16 | 13F | Crown Wealth Group, LLC | 0 | −100,00 | 0 | |||||
| 2025-08-15 | 13F | Morgan Stanley | 50 | 0,00 | 2 | 0,00 | ||||
| 2025-07-22 | 13F | Diligent Investors, LLC | 31 658 | −11,00 | 1 025 | −6,56 | ||||
| 2025-07-16 | 13F | PFS Partners, LLC | 23 363 | 4,76 | 757 | 10,04 | ||||
| 2025-08-07 | 13F | David R. Rahn & Associates Inc. | 92 851 | 3 007 | ||||||
| 2025-08-13 | 13F | Continuum Advisory, LLC | 0 | −100,00 | 0 | −100,00 | ||||
| 2025-08-11 | 13F | Blue Bell Private Wealth Management, Llc | 1 124 | 36 | ||||||
| 2025-07-31 | 13F | Gill Capital Partners, Llc | 6 808 | 0,00 | 220 | 4,76 | ||||
| 2025-08-14 | 13F | Ambassador Advisors, LLC | 25 905 | 839 | ||||||
| 2025-08-05 | 13F | Bank of New York Mellon Corp | 8 922 | −0,01 | 289 | 4,73 | ||||
| 2025-08-08 | 13F | Wealth Alliance | 23 639 | 5,78 | 766 | 11,03 | ||||
| 2025-08-01 | 13F | Corrado Advisors, Llc | 53 652 | 14,86 | 1 738 | 20,54 | ||||
| 2025-08-06 | 13F | AE Wealth Management LLC | 3 529 | −15,05 | 114 | −10,94 | ||||
| 2025-08-08 | 13F | Collaborative Wealth Managment Inc. | 9 504 | 308 | ||||||
| 2025-08-04 | 13F | Prairie Wealth Advisors, Inc. | 24 983 | 0,00 | 809 | 5,06 | ||||
| 2025-07-30 | 13F | Onyx Bridge Wealth Group LLC | 62 729 | 2 032 | ||||||
| 2025-08-05 | 13F | WorthPointe, LLC | 9 178 | 297 | ||||||
| 2025-07-16 | 13F | Signaturefd, Llc | 4 148 | 0,00 | 134 | 5,51 | ||||
| 2025-08-08 | 13F | Avantax Advisory Services, Inc. | 36 835 | 10,29 | 1 193 | 15,73 | ||||
| 2025-08-12 | 13F | Steward Partners Investment Advisory, Llc | 3 324 | −6,68 | 108 | −1,83 | ||||
| 2025-04-23 | 13F | Retirement Guys Formula Llc | 0 | −100,00 | 0 | −100,00 | ||||
| 2025-08-11 | 13F | Nations Financial Group Inc, /ia/ /adv | 18 061 | −0,86 | 585 | 4,10 | ||||
| 2025-08-12 | 13F | Proequities, Inc. | 0 | 0 | ||||||
| 2025-07-28 | 13F | Compass Advisory Group LLC | 27 343 | −4,54 | 886 | 0,23 | ||||
| 2025-08-08 | 13F | Pnc Financial Services Group, Inc. | 0 | −100,00 | 0 | |||||
| 2025-07-14 | 13F | AdvisorNet Financial, Inc | 17 158 | −0,21 | 556 | 4,72 | ||||
| 2025-08-05 | 13F | Sigma Planning Corp | 6 593 | 0,78 | 214 | 5,97 | ||||
| 2025-08-12 | 13F | Jacobi Capital Management LLC | 20 347 | −5,04 | 659 | −0,30 | ||||
| 2025-07-22 | 13F | Berkshire Money Management, Inc. | 101 740 | 3 295 | ||||||
| 2025-08-12 | 13F | Long Island Wealth Management, Inc. | 11 945 | 0,00 | 387 | 4,89 | ||||
| 2025-07-09 | 13F | Triumph Capital Management | 0 | −100,00 | 0 | |||||
| 2025-08-14 | 13F | Main Street Financial Solutions, LLC | 23 782 | 1,49 | 770 | 6,65 | ||||
| 2025-08-14 | 13F | Old Mission Capital Llc | 19 480 | 631 | ||||||
| 2025-08-06 | 13F | Valtinson Bruner Financial Planning LLC | 16 575 | −80,98 | 537 | −80,05 | ||||
| 2025-07-25 | 13F | Concurrent Investment Advisors, LLC | 13 054 | 0,00 | 423 | 4,98 | ||||
| 2025-07-30 | 13F | Strategic Blueprint, LLC | 9 027 | 0,85 | 292 | 5,80 | ||||
| 2025-08-14 | 13F | Jane Street Group, Llc | 454 632 | 14 724 | ||||||
| 2025-07-02 | 13F | HBW Advisory Services LLC | 0 | −100,00 | 0 | |||||
| 2025-08-14 | 13F | Arete Wealth Advisors, LLC | 8 913 | 10,04 | 0 | |||||
| 2025-08-08 | 13F | Gts Securities Llc | 0 | −100,00 | 0 | |||||
| 2025-08-12 | 13F | Leigh Baldwin & Co., Llc | 11 551 | −6,48 | 374 | −1,84 | ||||
| 2025-08-14 | 13F | Susquehanna International Group, Llp | 13 098 | −98,44 | 424 | −98,37 | ||||
| 2025-08-12 | 13F | Tradition Wealth Management, LLC | 137 984 | −1,08 | 4 469 | 3,83 | ||||
| 2025-08-19 | 13F | Advisory Services Network, LLC | 27 843 | 912 | ||||||
| 2025-07-24 | 13F | IFP Advisors, Inc | 6 123 | 40,89 | 198 | 47,76 | ||||
| 2025-07-18 | 13F | Truist Financial Corp | 16 500 | 0,65 | 534 | 5,74 | ||||
| 2025-08-12 | 13F | Wood Tarver Financial Group, LLC | 43 552 | 26,07 | 1 | −99,91 | ||||
| 2025-07-17 | 13F | Janney Montgomery Scott LLC | 29 093 | 0,87 | 1 | |||||
| 2025-07-17 | 13F | Global Trust Asset Management, LLC | 2 000 | 0,00 | 65 | 4,92 | ||||
| 2025-08-13 | 13F | Capital Analysts, Inc. | 26 202 | 0,00 | 1 | |||||
| 2025-07-22 | 13F | My Personal CFO, LLC | 12 731 | 0,00 | 412 | 5,10 | ||||
| 2025-08-11 | 13F | HighTower Advisors, LLC | 33 354 | −1,57 | 1 080 | 3,35 | ||||
| 2025-05-06 | 13F | Assetmark, Inc | 0 | −100,00 | 0 | |||||
| 2025-07-31 | 13F | Cardinal Point Capital Management, ULC | 7 360 | 0,00 | 238 | 4,85 | ||||
| 2025-08-08 | 13F | Cetera Investment Advisers | 513 384 | 222,77 | 16 626 | 238,89 | ||||
| 2025-07-30 | 13F | Red Crane Wealth Management, Llc | 103 688 | 360,45 | 3 358 | 383,72 | ||||
| 2025-08-14 | 13F | Raymond James Financial Inc | 98 604 | 55,48 | 3 193 | 63,24 | ||||
| 2025-07-21 | 13F | DHJJ Financial Advisors, Ltd. | 25 704 | 14,40 | 832 | 20,06 | ||||
| 2025-07-29 | 13F | Straight Path Wealth Management | 15 184 | 1,57 | 492 | 6,51 | ||||
| 2025-07-10 | 13F | Wealth Enhancement Advisory Services, Llc | 9 457 | 12,24 | 310 | 19,69 | ||||
| 2025-07-21 | 13F | Catalina Capital Group, LLC | 69 797 | 57,51 | 2 260 | 65,33 | ||||
| 2025-07-24 | 13F | Vantage Point Financial LLC | 8 691 | 0,00 | 281 | 4,85 | ||||
| 2025-08-13 | 13F | EverSource Wealth Advisors, LLC | 843 | 0,00 | 27 | 3,85 | ||||
| 2025-08-12 | 13F | NFP Retirement, Inc. | 11 049 | 0,00 | 358 | 5,00 | ||||
| 2025-07-29 | 13F | ODonnell Financial Services, LLC | 138 890 | −3,33 | 4 498 | 1,49 | ||||
| 2025-08-11 | 13F | Bellwether Advisors, LLC | 3 216 | 0,00 | 104 | 5,05 | ||||
| 2025-05-15 | 13F | Talon Private Wealth, LLC | 0 | −100,00 | 0 | −100,00 | ||||
| 2025-07-31 | 13F | Whipplewood Advisors, LLC | 0 | −100,00 | 0 | |||||
| 2025-08-13 | 13F | Townsquare Capital Llc | 0 | −100,00 | 0 | |||||
| 2025-08-14 | 13F | GWM Advisors LLC | 16 615 | 0,00 | 538 | 5,08 | ||||
| 2025-08-06 | 13F | Maltin Wealth Management, Inc. | 16 839 | −9,64 | 545 | −5,05 | ||||
| 2025-08-14 | 13F | Colony Group, LLC | 10 365 | 0,00 | 336 | 5,02 | ||||
| 2025-07-24 | 13F | Blair William & Co/il | 98 700 | −3,83 | 3 196 | 0,95 | ||||
| 2025-07-29 | 13F | Stratos Wealth Advisors, LLC | 12 124 | 0,00 | 393 | 4,81 | ||||
| 2025-07-22 | 13F | Beacon Financial Advisory LLC | 10 681 | 0,00 | 346 | 4,86 | ||||
| 2025-07-25 | 13F | Cwm, Llc | 43 749 | 2,75 | 1 | 0,00 | ||||
| 2025-08-01 | 13F | FSA Advisors, Inc. | 17 811 | 0,00 | 577 | 4,92 | ||||
| 2025-05-15 | 13F | Two Sigma Securities, Llc | 0 | −100,00 | 0 | −100,00 | ||||
| 2025-08-14 | 13F | Citadel Advisors Llc | 0 | −100,00 | 0 | |||||
| 2025-07-24 | 13F | Stonebridge Financial Group, LLC | 0 | −100,00 | 0 | |||||
| 2025-08-15 | 13F | Kestra Advisory Services, LLC | 130 446 | 34,62 | 4 225 | 41,32 | ||||
| 2025-07-15 | 13F | BCS Wealth Management | 14 231 | 20,41 | 0 | |||||
| 2025-08-14 | 13F | Acas, Llc | 18 039 | 7,06 | 604 | 17,09 | ||||
| 2025-07-29 | 13F | BKD Wealth Advisors, LLC | 17 624 | −5,74 | 571 | −1,04 | ||||
| 2025-08-12 | 13F | Weaver Consulting Group | 23 962 | 2,38 | 776 | 7,48 | ||||
| 2025-08-14 | 13F | CoreCap Advisors, LLC | 5 065 | 13,85 | 164 | 19,71 | ||||
| 2025-08-12 | 13F | Jpmorgan Chase & Co | 0 | −100,00 | 0 | |||||
| 2025-08-14 | 13F | EP Wealth Advisors, Inc. | 8 808 | −4,43 | 285 | 0,35 | ||||
| 2025-08-14 | 13F | Sunbelt Securities, Inc. | 22 806 | 0,82 | 746 | 6,89 | ||||
| 2025-07-31 | 13F | Cambridge Investment Research Advisors, Inc. | 56 207 | −21,12 | 2 | −50,00 | ||||
| 2025-08-01 | 13F | Envestnet Asset Management Inc | 17 745 | 6,65 | 575 | 11,89 | ||||
| 2025-08-06 | 13F | Founders Financial Securities Llc | 18 233 | 31,99 | 590 | 39,81 | ||||
| 2025-08-13 | 13F | Virtue Capital Management, LLC | 0 | −100,00 | 0 | |||||
| 2025-08-13 | 13F | Luminist Capital LLC | 7 861 | −5,68 | 255 | −1,17 | ||||
| 2025-08-18 | 13F | Geneos Wealth Management Inc. | 1 500 | 0,00 | 49 | 4,35 | ||||
| 2025-07-30 | 13F | Phoenix Holdings Ltd. | 6 750 | 218 | ||||||
| 2025-05-05 | 13F | Arq Wealth Advisors, Llc | 0 | −100,00 | 0 | |||||
| 2025-08-11 | 13F | Principal Securities, Inc. | 958 | −7,53 | 31 | −6,06 | ||||
| 2025-08-12 | 13F | BlackRock, Inc. | 1 657 | 54 | ||||||
| 2025-08-12 | 13F | Coldstream Capital Management Inc | 0 | −100,00 | 0 | |||||
| 2025-09-04 | 13F/A | Advisor Group Holdings, Inc. | 186 856 | 82,45 | 6 051 | 91,52 | ||||
| 2025-08-12 | 13F | Winnow Wealth Llc | 0 | −100,00 | 0 | −100,00 | ||||
| 2025-08-14 | 13F | Financial Network Wealth Advisors LLC | 9 900 | 0,00 | 321 | 4,92 | ||||
| 2025-08-12 | 13F | Archer Investment Corp | 10 492 | 0,00 | 340 | 4,95 | ||||
| 2025-08-14 | 13F | First Commonwealth Financial Corp /pa/ | 81 890 | 0,27 | 2 652 | 5,28 | ||||
| 2025-08-13 | 13F | SageView Advisory Group, LLC | 65 499 | 40,46 | 2 162 | 50,35 | ||||
| 2025-08-08 | 13F | Capital Investment Advisory Services, LLC | 512 | 0,00 | 17 | 6,67 | ||||
| 2025-08-06 | 13F | Commonwealth Equity Services, Llc | 274 224 | −11,53 | 9 | −11,11 |