Grundläggande statistik
| Institutionella ägare | 101 total, 101 long only, 0 short only, 0 long/short - change of 9,68% MRQ |
| Genomsnittlig portföljallokering | 0.1184 % - change of −1,64% MRQ |
| Institutionella aktier (lång) | 6 189 553 (ex 13D/G) - change of 0,13MM shares 2,06% MRQ |
| Institutionellt värde (lång) | $ 138 735 USD ($1000) |
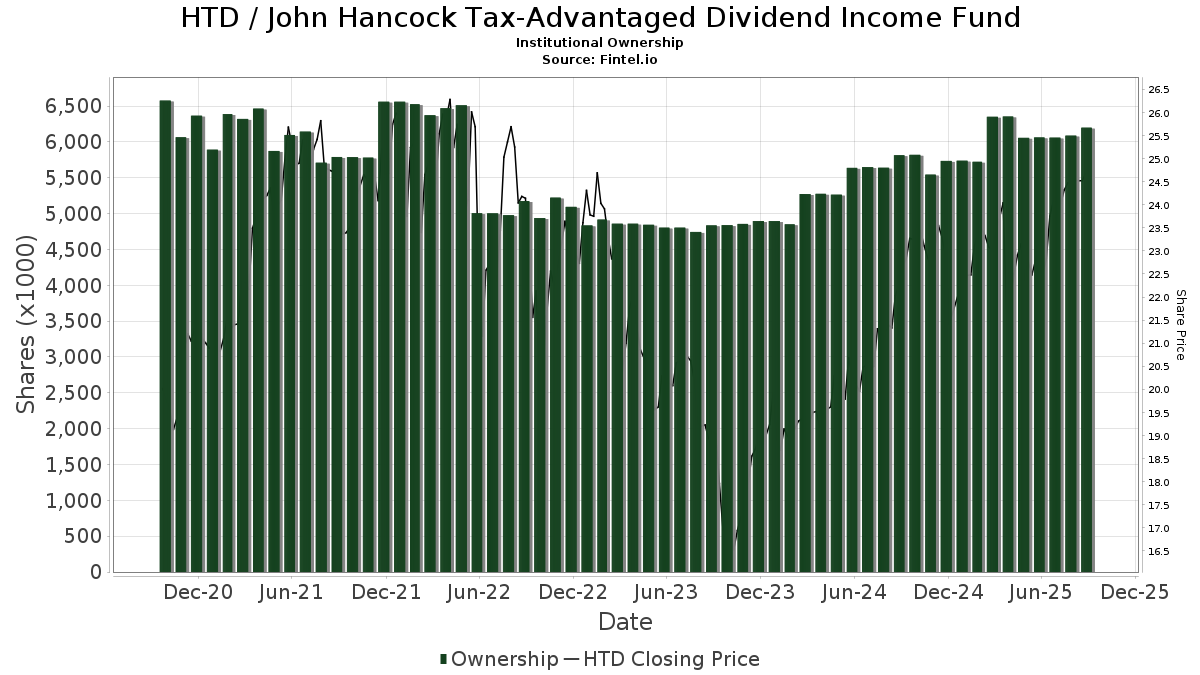
Institutionellt ägande och aktieägare
John Hancock Tax-Advantaged Dividend Income Fund (US:HTD) har 101 Institutionella ägare och aktieägare som har lämnat in 13D/G- eller 13F-formulär till Securities Exchange Commission (SEC). Dessa institut innehar totalt 6,189,553 aktier. Största aktieägare inkluderar UBS Group AG, Invesco Ltd., PCEF - Invesco CEF Income Composite ETF, Captrust Financial Advisors, Morgan Stanley, Guggenheim Capital Llc, Raymond James Financial Inc, Bank Of America Corp /de/, LPL Financial LLC, and Wells Fargo & Company/mn .
John Hancock Tax-Advantaged Dividend Income Fund (NYSE:HTD) Institutionell ägarstruktur visar institutioners och fonders nuvarande positioner i företaget, samt de senaste förändringarna i positionernas storlek. Större aktieägare kan vara enskilda investerare, fonder, hedgefonder eller institutioner. Bilaga 13D visar att investeraren äger (eller ägde) mer än 5% av företaget och avser (eller avsåg) att aktivt eftersträva en förändring av affärsstrategin. Schedule 13G indikerar en passiv investering på över 5%.
The share price as of September 9, 2025 is 24,55 / share. Previously, on September 10, 2024, the share price was 22,11 / share. This represents an increase of 11,04% over that period.
Fondsentimentets poäng
Fondsentimentet poängen(fka Ägarackumulation-poäng) visar vilka aktier som är mest köpta av fonder. Det är resultatet av en sofistikerad kvantitativ flerfaktormodell som identifierar företag med de högsta nivåerna av institutionell ackumulering. Poängsättningsmodellen använder en kombination av den totala ökningen av redovisade ägare, förändringarna i portföljallokeringarna för dessa ägare och andra mått. Siffran sträcker sig från 0 till 100, där högre siffror indikerar en högre nivå av ackumulering i förhållande till sina konkurrenter, och 50 är genomsnittet.
Uppdateringsfrekvens: Dagligen
Se Ownership Explorer, som innehåller en lista över de högst rankade företagen.
Institutionell sälj/köp-kvot
Förutom att rapportera vanliga eget kapital- och skuldemissioner måste institutioner med mer än 100MM tillgångar under förvaltning också avslöja sina innehav av sälj- och köpoptioner. Eftersom säljoptioner i allmänhet indikerar ett negativt sentiment och köpoptioner indikerar ett positivt sentiment, kan vi få en uppfattning om det övergripande institutionella sentimentet genom att plotta förhållandet mellan säljoptioner och köpoptioner. Diagrammet till höger visar det historiska förhållandet mellan sälj- och köpoptioner för detta instrument.
Genom att använda sälj/köp-kvoten som en indikator på aktieägarnas sentiment undviker man en av de största bristerna med att använda det totala institutionella ägandet, nämligen att en betydande del av de förvaltade tillgångarna investeras passivt för att följa index. Passivt förvaltade fonder köper vanligtvis inte optioner, så indikatorn för sälj/köp-kvoten ger en bättre bild av stämningen i aktivt förvaltade fonder.
13F- och NPORT-arkiveringar
Detaljer om 13F-arkiveringar är gratis. Detaljer om NP-arkiveringar kräver ett premiummedlemskap. Gröna rader indikerar nya positioner. Röda rader indikerar stängda positioner. Klicka på länk symbolen för att se hela transaktionshistoriken.
Uppgradera
för att låsa upp premiumdata och exportera till Excel ![]() .
.
| Fil Datum | Källa | Investerare | Typ | Genomsnittligt pris (beräknat) |
Aktier | Δ Aktier (%) |
Rapporterat värde (1000 USD) |
Δ Värde (%) |
Portföljallokering (%) |
|
|---|---|---|---|---|---|---|---|---|---|---|
| 2025-08-08 | 13F | Cornerstone Advisors, LLC | 10 292 | 241 | ||||||
| 2025-07-08 | 13F | Nbc Securities, Inc. | 4 025 | 0,00 | 0 | |||||
| 2025-07-11 | 13F | Seacrest Wealth Management, Llc | 0 | −100,00 | 0 | |||||
| 2025-07-17 | 13F | Presper Financial Architects, LLC | 27 574 | 1 | ||||||
| 2025-08-01 | 13F | Envestnet Asset Management Inc | 20 014 | −11,60 | 468 | −13,49 | ||||
| 2025-07-11 | 13F | Farther Finance Advisors, LLC | 150 | 4 | ||||||
| 2025-07-21 | 13F | Ameriflex Group, Inc. | 500 | 0,00 | 11 | 0,00 | ||||
| 2025-08-14 | 13F | UBS Group AG | 717 942 | −0,79 | 16 793 | −3,03 | ||||
| 2025-07-29 | 13F | Private Trust Co Na | 2 000 | 0,00 | 47 | −2,13 | ||||
| 2025-08-27 | NP | RYDEX VARIABLE TRUST - Multi-Hedge Strategies Fund Variable Annuity | 135 | −19,16 | 3 | 0,00 | ||||
| 2025-08-07 | 13F | Allworth Financial LP | 2 303 | 1,19 | 54 | 3,92 | ||||
| 2025-08-04 | 13F | Wolverine Asset Management Llc | 8 036 | 188 | ||||||
| 2025-08-14 | 13F | Comerica Bank | 3 700 | −13,95 | 87 | −15,69 | ||||
| 2025-08-14 | 13F | Cnh Partners Llc | 119 615 | −24,38 | 2 798 | −25,91 | ||||
| 2025-08-19 | 13F | Newbridge Financial Services Group, Inc. | 96 535 | 2 258 | ||||||
| 2025-08-14 | 13F | Stifel Financial Corp | 127 526 | −0,86 | 2 983 | −3,12 | ||||
| 2025-08-08 | 13F | Avalon Trust Co | 897 | 21 | ||||||
| 2025-08-08 | 13F | Calamos Advisors LLC | 22 448 | −8,00 | 525 | −9,95 | ||||
| 2025-08-13 | 13F | Lido Advisors, LLC | 17 567 | 0,00 | 411 | −2,38 | ||||
| 2025-04-08 | 13F | Parallel Advisors, LLC | 0 | −100,00 | 0 | |||||
| 2025-05-08 | 13F | Endeavor Private Wealth, Inc. | 0 | −100,00 | 0 | |||||
| 2025-07-08 | 13F | Morris Retirement Advisors, LLC | 28 208 | −1,96 | 660 | −4,22 | ||||
| 2025-08-06 | 13F | Founders Financial Securities Llc | 18 915 | 0,00 | 442 | 3,27 | ||||
| 2025-08-13 | 13F | Walleye Capital LLC | 27 100 | 11,71 | 634 | 9,14 | ||||
| 2025-08-08 | 13F | Avantax Advisory Services, Inc. | 12 295 | −2,41 | 288 | −4,65 | ||||
| 2025-07-18 | 13F | PFG Investments, LLC | 14 960 | 24,12 | 350 | 21,18 | ||||
| 2025-08-04 | 13F | Live Oak Private Wealth LLC | 102 602 | 0,00 | 2 400 | −2,28 | ||||
| 2025-07-25 | 13F | Concord Wealth Partners | 83 | 0,00 | 2 | 0,00 | ||||
| 2025-08-22 | NP | Cornerstone Total Return Fund Inc | 6 589 | −40,61 | 154 | −31,25 | ||||
| 2025-04-29 | 13F | Truist Financial Corp | 0 | −100,00 | 0 | |||||
| 2025-08-14 | 13F | Royal Bank Of Canada | 159 735 | −3,56 | 3 736 | −5,75 | ||||
| 2025-07-28 | 13F | Mutual Advisors, LLC | 24 362 | 1,60 | 589 | 8,47 | ||||
| 2025-08-14 | 13F | McIlrath & Eck, LLC | 500 | 0,00 | 12 | 0,00 | ||||
| 2025-08-14 | 13F | Wells Fargo & Company/mn | 270 810 | −2,87 | 6 334 | −5,07 | ||||
| 2025-08-12 | 13F | Proequities, Inc. | 0 | 0 | ||||||
| 2025-07-28 | NP | PCEF - Invesco CEF Income Composite ETF This fund is a listed as child fund of Invesco Ltd. and if that institution has disclosed ownership in this security, then these positions will not be double counted when calculating total shares and total value | 487 719 | −0,71 | 11 247 | −2,56 | ||||
| 2025-08-05 | 13F | GPS Wealth Strategies Group, LLC | 7 502 | 0,00 | 175 | −2,23 | ||||
| 2025-08-08 | 13F | Kingsview Wealth Management, LLC | 12 868 | 1,40 | 301 | −0,99 | ||||
| 2025-08-14 | 13F | Bank Of America Corp /de/ | 295 497 | −1,50 | 6 912 | −3,72 | ||||
| 2025-05-13 | 13F | Elequin Capital Lp | 0 | −100,00 | 0 | |||||
| 2025-08-14 | 13F | 1607 Capital Partners, LLC | 24 431 | −14,97 | 571 | −16,89 | ||||
| 2025-07-31 | 13F | Cambridge Investment Research Advisors, Inc. | 22 705 | −26,09 | 1 | |||||
| 2025-08-12 | 13F | Global Retirement Partners, LLC | 1 764 | −72,79 | 41 | −71,13 | ||||
| 2025-08-14 | 13F | GWM Advisors LLC | 16 802 | 0,54 | 393 | −1,50 | ||||
| 2025-06-27 | NP | Calamos ETF Trust - Calamos CEF Income & Arbitrage ETF | 22 448 | −11,54 | 514 | −10,45 | ||||
| 2025-07-18 | 13F | Institute for Wealth Management, LLC. | 8 992 | 0,00 | 210 | −2,33 | ||||
| 2025-08-11 | 13F | Private Advisor Group, LLC | 13 633 | −0,21 | 319 | −2,45 | ||||
| 2025-08-18 | 13F | Geneos Wealth Management Inc. | 11 700 | 100,00 | 274 | 96,40 | ||||
| 2025-07-15 | 13F | North Star Investment Management Corp. | 1 000 | 0,00 | 23 | 0,00 | ||||
| 2025-07-17 | 13F | Janney Montgomery Scott LLC | 84 010 | 31,41 | 2 | 0,00 | ||||
| 2025-07-29 | 13F | First National Bank of Mount Dora, Trust Investment Services | 27 800 | 0,00 | 650 | −2,26 | ||||
| 2025-08-11 | 13F | Principal Securities, Inc. | 222 | −52,87 | 5 | −50,00 | ||||
| 2025-07-29 | 13F | Mezzasalma Advisors, LLC | 12 039 | 1,82 | 282 | −0,35 | ||||
| 2025-05-06 | 13F | Venturi Wealth Management, LLC | 0 | −100,00 | 0 | |||||
| 2025-09-04 | 13F/A | Advisor Group Holdings, Inc. | 166 155 | 29,95 | 3 887 | 27,03 | ||||
| 2025-08-13 | 13F | Northwestern Mutual Wealth Management Co | 1 517 | −59,87 | 35 | −61,11 | ||||
| 2025-08-12 | 13F | LPL Financial LLC | 275 252 | −5,61 | 6 438 | −7,74 | ||||
| 2025-08-15 | 13F | Captrust Financial Advisors | 476 855 | −2,93 | 11 154 | −5,12 | ||||
| 2025-07-21 | 13F | Ameritas Advisory Services, LLC | 522 | 12 | ||||||
| 2025-08-11 | 13F | Nations Financial Group Inc, /ia/ /adv | 22 090 | 3,51 | 517 | 1,18 | ||||
| 2025-08-14 | 13F | Ausdal Financial Partners, Inc. | 8 764 | −9,51 | 205 | −11,69 | ||||
| 2025-08-07 | 13F | Readystate Asset Management Lp | 26 741 | 625 | ||||||
| 2025-08-14 | 13F | Karpus Management, Inc. | 226 036 | −1,86 | 5 287 | −4,08 | ||||
| 2025-08-15 | 13F | Morgan Stanley | 395 174 | 0,04 | 9 243 | −2,21 | ||||
| 2025-04-09 | 13F | Capital CS Group, LLC | 0 | −100,00 | 0 | |||||
| 2025-07-22 | 13F | Powell Investment Advisors, LLC | 10 100 | 0,00 | 236 | −2,07 | ||||
| 2025-08-06 | 13F | Smh Capital Advisors Inc | 8 728 | −2,19 | 204 | −4,23 | ||||
| 2025-08-22 | NP | Cornerstone Strategic Value Fund Inc | 3 703 | −73,15 | 87 | −71,62 | ||||
| 2025-07-17 | 13F | Beacon Capital Management, LLC | 2 877 | 0,00 | 67 | −1,47 | ||||
| 2025-08-13 | 13F | Jones Financial Companies Lllp | 0 | −100,00 | 0 | |||||
| 2025-07-16 | 13F | St Germain D J Co Inc | 1 917 | 0,00 | 45 | −2,22 | ||||
| 2025-05-15 | 13F | WPG Advisers, LLC | 0 | −100,00 | 0 | |||||
| 2025-07-24 | 13F | Conning Inc. | 11 150 | 0,00 | 261 | −2,26 | ||||
| 2025-08-13 | 13F | Guggenheim Capital Llc | 363 179 | −10,68 | 8 495 | −12,70 | ||||
| 2025-05-13 | 13F | HighTower Advisors, LLC | 0 | −100,00 | 0 | |||||
| 2025-05-15 | 13F | Polar Asset Management Partners Inc. | 0 | −100,00 | 0 | |||||
| 2025-08-20 | NP | ADANX - AQR Diversified Arbitrage Fund Class N | 32 728 | −18,53 | 766 | −20,40 | ||||
| 2025-08-04 | 13F | Creative Financial Designs Inc /adv | 600 | 0,00 | 14 | 0,00 | ||||
| 2025-07-14 | 13F | Argentarii, LLC | 10 823 | 0,00 | 253 | −1,94 | ||||
| 2025-08-05 | 13F | Welch & Forbes Llc | 50 000 | 0,00 | 1 170 | −2,26 | ||||
| 2025-08-19 | 13F | Advisory Services Network, LLC | 9 164 | 0,00 | 222 | 1,37 | ||||
| 2025-08-08 | 13F | Pnc Financial Services Group, Inc. | 5 962 | −26,19 | 139 | −27,98 | ||||
| 2025-07-10 | 13F | Wealth Enhancement Advisory Services, Llc | 42 329 | 0,35 | 1 011 | 0,10 | ||||
| 2025-04-25 | 13F | WASHINGTON TRUST Co | 0 | −100,00 | 0 | |||||
| 2025-08-29 | 13F | Evolution Wealth Management Inc. | 670 | 16 | ||||||
| 2025-08-04 | 13F | Spire Wealth Management | 25 404 | 22,09 | 594 | 19,52 | ||||
| 2025-08-13 | 13F | Congress Wealth Management LLC / DE / | 29 728 | 17,87 | 695 | 15,26 | ||||
| 2025-08-14 | 13F | Cohen & Steers, Inc. | 72 835 | 0,00 | 2 | 0,00 | ||||
| 2025-08-07 | 13F | CENTRAL TRUST Co | 88 223 | 0,00 | 2 064 | −2,27 | ||||
| 2025-08-15 | 13F | Provenance Wealth Advisors, LLC | 0 | −100,00 | 0 | −100,00 | ||||
| 2025-08-14 | 13F | Ameriprise Financial Inc | 24 904 | −3,46 | 583 | −5,67 | ||||
| 2025-08-04 | 13F | Creekmur Asset Management LLC | 0 | 0 | ||||||
| 2025-08-14 | 13F | Wiley Bros.-aintree Capital, Llc | 17 717 | 414 | ||||||
| 2025-08-07 | 13F | Hennion & Walsh Asset Management, Inc. | 42 806 | −2,88 | 1 001 | −5,03 | ||||
| 2025-08-07 | 13F | Samalin Investment Counsel, LLC | 49 758 | −4,10 | 1 164 | −6,29 | ||||
| 2025-08-08 | 13F | Fortis Group Advisors, LLC | 9 090 | 221 | ||||||
| 2025-07-24 | 13F | Us Bancorp \de\ | 10 701 | 0,00 | 250 | −2,34 | ||||
| 2025-07-14 | 13F | Sowell Financial Services LLC | 9 519 | −2,08 | 223 | −4,31 | ||||
| 2025-07-25 | NP | FCEF - First Trust CEF Income Opportunity ETF This fund is a listed as child fund of First Trust Advisors Lp and if that institution has disclosed ownership in this security, then these positions will not be double counted when calculating total shares and total value | 62 098 | 4,86 | 1 432 | 2,88 | ||||
| 2025-08-14 | 13F | Abbot Financial Management, Inc. | 15 600 | 0,00 | 365 | −2,41 | ||||
| 2025-08-13 | 13F | First Trust Advisors Lp | 120 175 | 2,28 | 2 811 | −0,04 | ||||
| 2025-08-05 | 13F | Shaker Financial Services, LLC | 23 443 | 548 | ||||||
| 2025-08-12 | 13F | Steward Partners Investment Advisory, Llc | 7 500 | 1,69 | 175 | −0,57 | ||||
| 2025-08-06 | 13F | Commonwealth Equity Services, Llc | 46 577 | 1,38 | 1 | 0,00 | ||||
| 2025-04-28 | 13F | Redmont Wealth Advisors Llc | 2 612 | 63 | ||||||
| 2025-07-17 | 13F | Oakworth Capital, Inc. | 1 500 | 0,00 | 35 | 0,00 | ||||
| 2025-08-27 | NP | RYMSX - Guggenheim Multi-Hedge Strategies Fund Class P | 80 | −37,50 | 2 | −66,67 | ||||
| 2025-07-21 | 13F | Kennebec Savings Bank | 1 155 | 0,00 | 27 | 0,00 | ||||
| 2025-08-13 | 13F | Invesco Ltd. | 545 627 | 5,18 | 12 762 | 2,81 | ||||
| 2025-07-15 | 13F | Fifth Third Bancorp | 3 958 | 6 724,14 | 93 | 9 100,00 | ||||
| 2025-07-25 | 13F | Cwm, Llc | 500 | 0,00 | 0 | |||||
| 2025-08-12 | 13F | Jpmorgan Chase & Co | 42 | −95,57 | 1 | −100,00 | ||||
| 2025-05-12 | 13F | Fmr Llc | 0 | −100,00 | 0 | |||||
| 2025-08-14 | 13F | Raymond James Financial Inc | 311 297 | 4,25 | 7 281 | 1,90 | ||||
| 2025-04-21 | 13F | ORG Partners LLC | 0 | −100,00 | 0 | |||||
| 2025-08-08 | 13F | Cetera Investment Advisers | 163 056 | 2,19 | 3 814 | −0,13 | ||||
| 2025-08-13 | 13F | Cheviot Value Management, LLC | 200 | 0,00 | 5 | 0,00 | ||||
| 2025-08-06 | 13F | North Capital, Inc. | 1 679 | 0,00 | 39 | −2,50 |