Grundläggande statistik
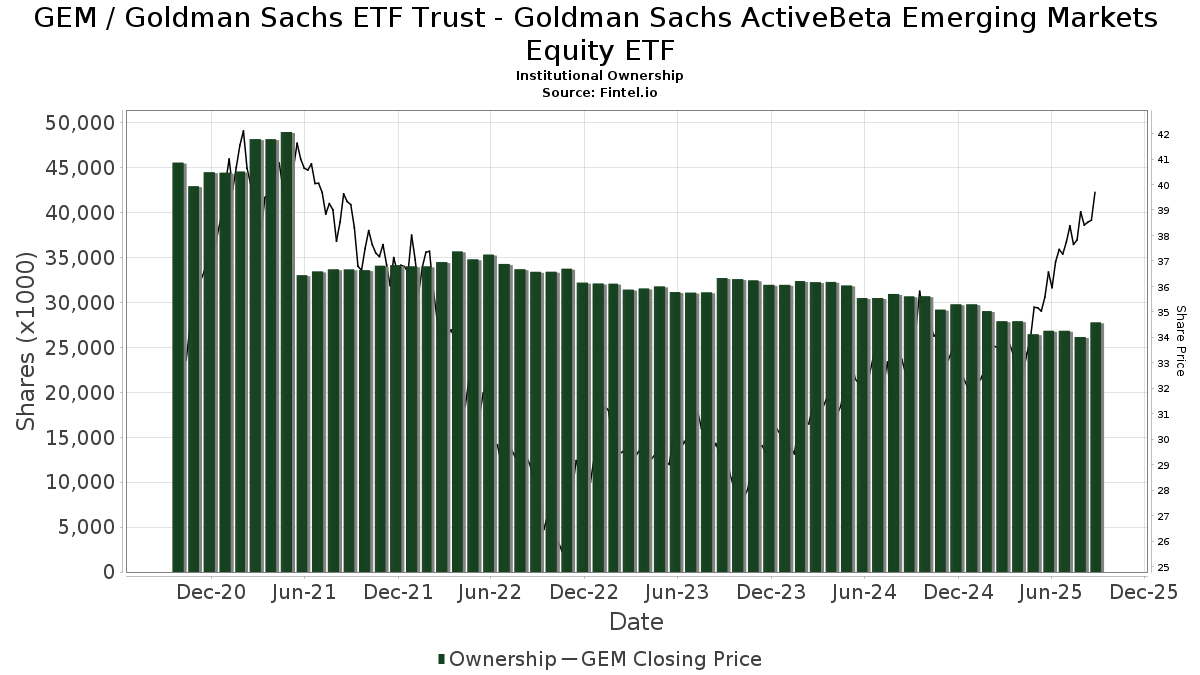
| Institutionella ägare | 154 total, 154 long only, 0 short only, 0 long/short - change of −0,65% MRQ |
| Genomsnittlig portföljallokering | 0.1487 % - change of −0,48% MRQ |
| Institutionella aktier (lång) | 27 782 993 (ex 13D/G) - change of 0,93MM shares 3,47% MRQ |
| Institutionellt värde (lång) | $ 943 601 USD ($1000) |
Institutionellt ägande och aktieägare
Goldman Sachs ETF Trust - Goldman Sachs ActiveBeta Emerging Markets Equity ETF (US:GEM) har 154 Institutionella ägare och aktieägare som har lämnat in 13D/G- eller 13F-formulär till Securities Exchange Commission (SEC). Dessa institut innehar totalt 27,782,993 aktier. Största aktieägare inkluderar Wells Fargo & Company/mn, SigFig Wealth Management, LLC, Goldman Sachs Group Inc, Betterment LLC, LPL Financial LLC, GGMBX - Goldman Sachs Global Managed Beta Fund Institutional Shares, Arvest Bank Trust Division, HB Wealth Management, LLC, State Of Wisconsin Investment Board, and Envestnet Asset Management Inc .
Goldman Sachs ETF Trust - Goldman Sachs ActiveBeta Emerging Markets Equity ETF (ARCA:GEM) Institutionell ägarstruktur visar institutioners och fonders nuvarande positioner i företaget, samt de senaste förändringarna i positionernas storlek. Större aktieägare kan vara enskilda investerare, fonder, hedgefonder eller institutioner. Bilaga 13D visar att investeraren äger (eller ägde) mer än 5% av företaget och avser (eller avsåg) att aktivt eftersträva en förändring av affärsstrategin. Schedule 13G indikerar en passiv investering på över 5%.
The share price as of September 9, 2025 is 39,34 / share. Previously, on September 10, 2024, the share price was 32,31 / share. This represents an increase of 21,76% over that period.
Fondsentimentets poäng
Fondsentimentet poängen(fka Ägarackumulation-poäng) visar vilka aktier som är mest köpta av fonder. Det är resultatet av en sofistikerad kvantitativ flerfaktormodell som identifierar företag med de högsta nivåerna av institutionell ackumulering. Poängsättningsmodellen använder en kombination av den totala ökningen av redovisade ägare, förändringarna i portföljallokeringarna för dessa ägare och andra mått. Siffran sträcker sig från 0 till 100, där högre siffror indikerar en högre nivå av ackumulering i förhållande till sina konkurrenter, och 50 är genomsnittet.
Uppdateringsfrekvens: Dagligen
Se Ownership Explorer, som innehåller en lista över de högst rankade företagen.
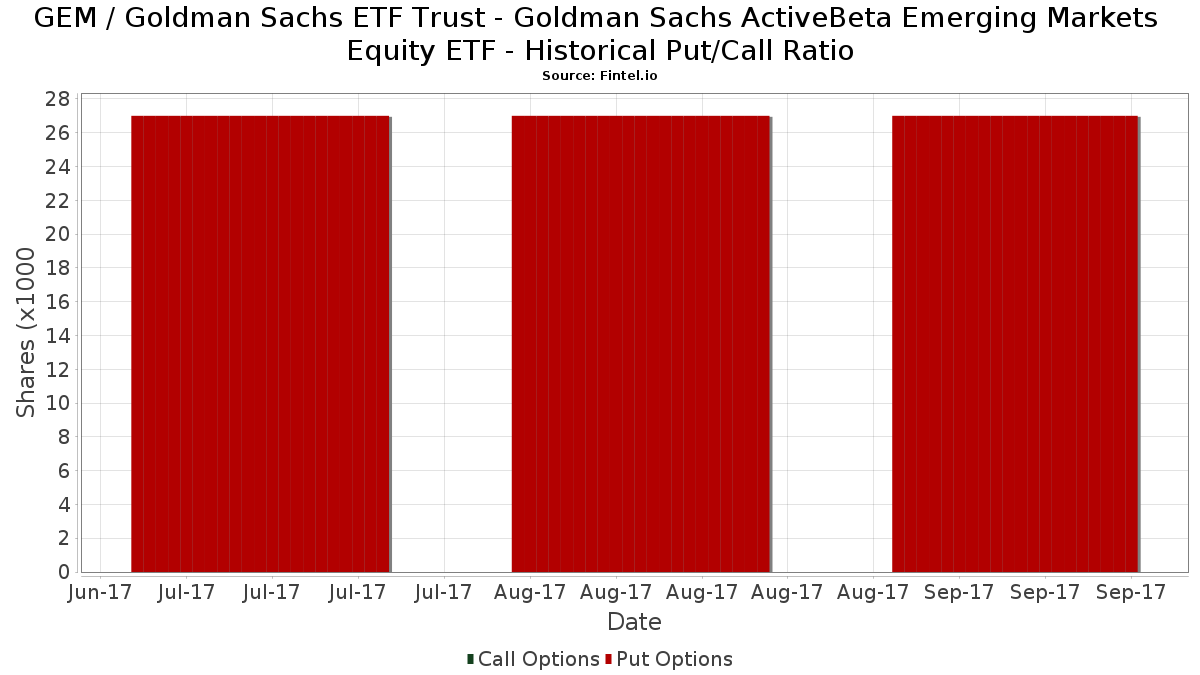
Institutionell sälj/köp-kvot
Förutom att rapportera vanliga eget kapital- och skuldemissioner måste institutioner med mer än 100MM tillgångar under förvaltning också avslöja sina innehav av sälj- och köpoptioner. Eftersom säljoptioner i allmänhet indikerar ett negativt sentiment och köpoptioner indikerar ett positivt sentiment, kan vi få en uppfattning om det övergripande institutionella sentimentet genom att plotta förhållandet mellan säljoptioner och köpoptioner. Diagrammet till höger visar det historiska förhållandet mellan sälj- och köpoptioner för detta instrument.
Genom att använda sälj/köp-kvoten som en indikator på aktieägarnas sentiment undviker man en av de största bristerna med att använda det totala institutionella ägandet, nämligen att en betydande del av de förvaltade tillgångarna investeras passivt för att följa index. Passivt förvaltade fonder köper vanligtvis inte optioner, så indikatorn för sälj/köp-kvoten ger en bättre bild av stämningen i aktivt förvaltade fonder.
13F- och NPORT-arkiveringar
Detaljer om 13F-arkiveringar är gratis. Detaljer om NP-arkiveringar kräver ett premiummedlemskap. Gröna rader indikerar nya positioner. Röda rader indikerar stängda positioner. Klicka på länk symbolen för att se hela transaktionshistoriken.
Uppgradera
för att låsa upp premiumdata och exportera till Excel ![]() .
.
| Fil Datum | Källa | Investerare | Typ | Genomsnittligt pris (beräknat) |
Aktier | Δ Aktier (%) |
Rapporterat värde (1000 USD) |
Δ Värde (%) |
Portföljallokering (%) |
|
|---|---|---|---|---|---|---|---|---|---|---|
| 2025-07-28 | 13F | Kiker Wealth Management, LLC | 337 | −27,06 | 13 | −20,00 | ||||
| 2025-08-14 | 13F | Integrated Wealth Concepts LLC | 14 250 | 6,18 | 530 | 19,10 | ||||
| 2025-05-16 | 13F | Coppell Advisory Solutions LLC | 0 | −100,00 | 0 | |||||
| 2025-07-22 | 13F | HFM Investment Advisors, LLC | 189 | 5,59 | 7 | 40,00 | ||||
| 2025-07-07 | 13F | Nova Wealth Management, Inc. | 19 | −92,31 | 1 | −100,00 | ||||
| 2025-08-13 | 13F | Baird Financial Group, Inc. | 40 263 | −1,00 | 1 498 | 11,05 | ||||
| 2025-07-17 | 13F | HB Wealth Management, LLC | 1 124 949 | −36,81 | 41 859 | −29,13 | ||||
| 2025-08-19 | 13F | Anchor Investment Management, LLC | 116 302 | 6,42 | 4 328 | 19,33 | ||||
| 2025-08-14 | 13F | Citadel Advisors Llc | 289 967 | 3 903,41 | 10 790 | 4 395,42 | ||||
| 2025-08-05 | 13F | Key FInancial Inc | 41 | 0,00 | 2 | 0,00 | ||||
| 2025-08-14 | 13F | State Of Wisconsin Investment Board | 1 091 863 | 0,00 | 40 628 | 12,15 | ||||
| 2025-08-12 | 13F | Proequities, Inc. | 0 | 0 | ||||||
| 2025-04-21 | 13F | ORG Partners LLC | 0 | −100,00 | 0 | |||||
| 2025-08-13 | 13F | Maia Wealth LLC | 11 913 | −2,55 | 443 | 13,01 | ||||
| 2025-07-28 | 13F | Elmwood Wealth Management, Inc. | 25 220 | −0,05 | 938 | 12,07 | ||||
| 2025-08-06 | 13F | Golden State Wealth Management, LLC | 34 402 | −8,61 | 1 280 | 2,48 | ||||
| 2025-08-11 | 13F | Wealthspire Advisors, LLC | 8 796 | −23,21 | 327 | −13,95 | ||||
| 2025-08-08 | 13F | Hartland & Co., LLC | 0 | −100,00 | 0 | |||||
| 2025-08-05 | 13F | Bank of New York Mellon Corp | 25 442 | 3,83 | 947 | 16,36 | ||||
| 2025-07-31 | 13F | Cambridge Investment Research Advisors, Inc. | 9 714 | −2,05 | 0 | |||||
| 2025-08-11 | 13F | Principal Securities, Inc. | 318 162 | 33,42 | 11 839 | 55,54 | ||||
| 2025-07-30 | 13F | Whittier Trust Co Of Nevada Inc | 16 910 | −4,69 | 629 | 6,97 | ||||
| 2025-08-04 | 13F | Spinnaker Trust | 204 634 | −4,97 | 7 614 | 6,58 | ||||
| 2025-08-12 | 13F | AlphaCore Capital LLC | 109 617 | 638,01 | 4 079 | 728,86 | ||||
| 2025-08-14 | 13F | Royal Bank Of Canada | 359 226 | 28,25 | 13 366 | 43,83 | ||||
| 2025-08-14 | 13F | Betterment LLC | 2 098 854 | 19,20 | 78 | 34,48 | ||||
| 2025-08-14 | 13F | Bank Of America Corp /de/ | 483 005 | 0,20 | 17 973 | 12,37 | ||||
| 2025-08-13 | 13F | Continuum Advisory, LLC | 0 | −100,00 | 0 | |||||
| 2025-08-14 | 13F | First Foundation Advisors | 330 790 | 2,55 | 12 309 | 15,00 | ||||
| 2025-07-30 | 13F | Whittier Trust Co | 13 527 | −29,87 | 503 | −21,28 | ||||
| 2025-08-06 | 13F | AE Wealth Management LLC | 141 | 69,88 | 5 | 150,00 | ||||
| 2025-07-30 | 13F | Cullen/frost Bankers, Inc. | 557 | 0,00 | 21 | 11,11 | ||||
| 2025-08-14 | 13F | Glenview Trust Co | 8 897 | −1,36 | 331 | 10,70 | ||||
| 2025-08-13 | 13F | Cheviot Value Management, LLC | 65 | 0,00 | 2 | 0,00 | ||||
| 2025-08-14 | 13F | Qube Research & Technologies Ltd | 1 377 | −62,39 | 51 | −57,85 | ||||
| 2025-07-09 | 13F | Pallas Capital Advisors LLC | 0 | −100,00 | 0 | |||||
| 2025-07-25 | 13F | Prostatis Group LLC | 32 539 | 104,63 | 1 211 | 129,60 | ||||
| 2025-08-14 | 13F | Ameriprise Financial Inc | 0 | −100,00 | 0 | |||||
| 2025-08-19 | 13F | Advisory Services Network, LLC | 6 208 | 1,31 | 232 | 14,29 | ||||
| 2025-05-15 | 13F | Stonehaven Wealth & Tax Solutions, Llc | 0 | −100,00 | 0 | |||||
| 2025-08-14 | 13F | Goldman Sachs Group Inc | 2 941 097 | 7,81 | 109 438 | 20,91 | ||||
| 2025-07-18 | 13F | Truist Financial Corp | 23 996 | 8,69 | 893 | 21,86 | ||||
| 2025-08-11 | 13F | Hexagon Capital Partners LLC | 0 | −100,00 | 0 | |||||
| 2025-08-12 | 13F | Clearwater Capital Advisors, LLC | 9 380 | −92,68 | 349 | −91,80 | ||||
| 2025-07-21 | 13F | Quent Capital, LLC | 0 | −100,00 | 0 | |||||
| 2025-08-11 | 13F | Citigroup Inc | 18 096 | 2,68 | 673 | 15,24 | ||||
| 2025-04-09 | 13F | Signature Securities Group Corporation | 0 | −100,00 | 0 | −100,00 | ||||
| 2025-07-11 | 13F/A | Umb Bank N A/mo | 27 | −90,53 | 1 | −88,89 | ||||
| 2025-07-25 | 13F | Envestnet Portfolio Solutions, Inc. | 129 989 | −0,96 | 4 837 | 11,04 | ||||
| 2025-08-14 | 13F | Susquehanna International Group, Llp | 41 614 | −28,87 | 1 548 | −20,25 | ||||
| 2025-07-30 | 13F | D.a. Davidson & Co. | 7 530 | 0,00 | 280 | 12,45 | ||||
| 2025-08-14 | 13F | LifePlan Investment Advisors, Inc. | 21 652 | 39,04 | 806 | 56,01 | ||||
| 2025-08-14 | 13F | Comerica Bank | 10 386 | −13,02 | 386 | −2,53 | ||||
| 2025-07-29 | 13F | Harbor Asset Planning, Inc. | 327 | 12 | ||||||
| 2025-08-14 | 13F | 10Elms LLP | 1 | 0,00 | 0 | |||||
| 2025-08-07 | 13F | CENTRAL TRUST Co | 104 317 | 4,10 | 3 882 | 16,76 | ||||
| 2025-07-17 | 13F | CogentBlue Wealth Advisors, LLC | 7 457 | −2,85 | 277 | 9,06 | ||||
| 2025-07-24 | 13F | Mengis Capital Management, Inc. | 5 935 | 221 | ||||||
| 2025-08-14 | 13F | Fmr Llc | 1 795 | −14,40 | 67 | −4,35 | ||||
| 2025-08-01 | 13F | Strategic Financial Services, Inc, | 245 844 | 13,79 | 9 148 | 27,61 | ||||
| 2025-08-19 | NP | GAPIX - Goldman Sachs Dynamic Global Equity Fund Institutional | 85 902 | 14,84 | 3 196 | 28,82 | ||||
| 2025-08-06 | 13F | Mark Sheptoff Financial Planning, Llc | 29 | 0,00 | 1 | |||||
| 2025-08-19 | NP | GOIIX - Goldman Sachs Growth and Income Strategy Portfolio Institutional | 130 954 | 0,00 | 4 873 | 12,13 | ||||
| 2025-04-29 | 13F | Callan Capital, LLC | 99 619 | −1,11 | 3 305 | 2,80 | ||||
| 2025-08-01 | 13F | Bank of Jackson Hole Trust | 0 | −100,00 | 0 | |||||
| 2025-07-07 | 13F | Investors Research Corp | 523 | 0,00 | 19 | 11,76 | ||||
| 2025-08-15 | 13F | Equitable Holdings, Inc. | 0 | −100,00 | 0 | |||||
| 2025-08-12 | 13F | Jpmorgan Chase & Co | 11 495 | 989,57 | 428 | 1 120,00 | ||||
| 2025-07-08 | 13F | Parallel Advisors, LLC | 74 | −25,25 | 3 | −33,33 | ||||
| 2025-08-14 | 13F | Raymond James Financial Inc | 392 021 | 1,29 | 14 587 | 13,60 | ||||
| 2025-08-04 | 13F | Assetmark, Inc | 11 | 0 | ||||||
| 2025-09-04 | 13F/A | Advisor Group Holdings, Inc. | 28 852 | 13,35 | 1 073 | 27,13 | ||||
| 2025-04-21 | 13F | Nelson, Van Denburg & Campbell Wealth Management Group, LLC | 0 | −100,00 | 0 | |||||
| 2025-08-27 | 13F/A | Brinker Capital Investments, LLC | 11 109 | 4,68 | 413 | 17,33 | ||||
| 2025-08-08 | 13F | Pnc Financial Services Group, Inc. | 359 | 0,00 | 13 | 18,18 | ||||
| 2025-08-05 | 13F | GPS Wealth Strategies Group, LLC | 349 | 12,94 | 13 | 20,00 | ||||
| 2025-08-13 | 13F | GeoWealth Management, LLC | 62 562 | −4,39 | 2 328 | 7,23 | ||||
| 2025-08-07 | 13F | Vise Technologies, Inc. | 0 | −100,00 | 0 | |||||
| 2025-08-04 | 13F | Creative Financial Designs Inc /adv | 331 | 0,00 | 12 | 20,00 | ||||
| 2025-08-12 | 13F | O'shaughnessy Asset Management, Llc | 405 | −29,07 | 15 | −16,67 | ||||
| 2025-07-03 | 13F | Arvest Investments, Inc. | 446 226 | −2,49 | 16 604 | 9,35 | ||||
| 2025-08-19 | 13F | Asset Dedication, LLC | 47 | 2 | ||||||
| 2025-07-07 | 13F | Thurston, Springer, Miller, Herd & Titak, Inc. | 111 | 4 | ||||||
| 2025-07-28 | 13F | Morris Financial Concepts, Inc. | 11 485 | −0,57 | 427 | 11,49 | ||||
| 2025-08-11 | 13F | Shufro Rose & Co Llc | 42 591 | −0,71 | 1 413 | −0,70 | ||||
| 2025-04-14 | 13F | Greenspring Advisors, LLC | 6 641 | 0,00 | 220 | 4,27 | ||||
| 2025-08-13 | 13F | Jones Financial Companies Lllp | 2 293 | −39,48 | 85 | −32,54 | ||||
| 2025-07-21 | 13F | Monticello Wealth Management, Llc | 78 368 | −4,43 | 2 916 | 7,21 | ||||
| 2025-08-14 | 13F | EP Wealth Advisors, Inc. | 22 118 | −0,01 | 823 | 12,28 | ||||
| 2025-08-14 | 13F | Jane Street Group, Llc | 131 318 | 932,62 | 4 886 | 1 060,57 | ||||
| 2025-07-28 | 13F | Naviter Wealth, LLC | 5 813 | 216 | ||||||
| 2025-08-14 | 13F | GWM Advisors LLC | 22 129 | 11,89 | 823 | 25,46 | ||||
| 2025-08-13 | 13F | StoneX Group Inc. | 0 | −100,00 | 0 | −100,00 | ||||
| 2025-08-13 | 13F | Flow Traders U.s. Llc | 26 289 | 1 | ||||||
| 2025-08-11 | 13F | Aptus Capital Advisors, LLC | 683 | 0,00 | 25 | 13,64 | ||||
| 2025-08-12 | 13F | Steward Partners Investment Advisory, Llc | 1 560 | 171,30 | 58 | 205,26 | ||||
| 2025-07-17 | 13F | Archford Capital Strategies, LLC | 8 849 | −1,52 | 329 | 10,40 | ||||
| 2025-08-13 | 13F | EverSource Wealth Advisors, LLC | 416 | 0,00 | 15 | 15,38 | ||||
| 2025-08-11 | 13F | Heritage Wealth Advisors | 200 | 0,00 | 7 | 16,67 | ||||
| 2025-08-14 | 13F | Wiley Bros.-aintree Capital, Llc | 32 018 | −0,44 | 1 188 | 11,04 | ||||
| 2025-08-14 | 13F | Mariner, LLC | 53 758 | 0,08 | 2 000 | 12,23 | ||||
| 2025-07-16 | 13F | Signaturefd, Llc | 40 | 1 | ||||||
| 2025-07-18 | 13F | Consolidated Portfolio Review Corp | 8 101 | 301 | ||||||
| 2025-08-15 | 13F | Morgan Stanley | 706 273 | −2,10 | 26 280 | 9,80 | ||||
| 2025-07-24 | 13F | Capital Advisors, Ltd. LLC | 2 302 | −8,61 | 0 | |||||
| 2025-08-06 | 13F | Rialto Wealth Management, LLC | 439 | 0,00 | 16 | 14,29 | ||||
| 2025-07-30 | 13F | Syntegra Private Wealth Group, LLC | 16 350 | 90,14 | 608 | 113,33 | ||||
| 2025-07-14 | 13F | Golden State Equity Partners | 29 712 | −13,21 | 1 106 | −2,73 | ||||
| 2025-08-08 | 13F | Strategies Wealth Advisors, LLC | 11 997 | 0,00 | 446 | 12,06 | ||||
| 2025-08-08 | 13F | Altfest L J & Co Inc | 12 693 | −38,69 | 472 | −31,20 | ||||
| 2025-08-13 | 13F | Marshall Wace, Llp | 147 817 | 722,39 | 5 500 | 822,82 | ||||
| 2025-05-13 | 13F | Bokf, Na | 0 | −100,00 | 0 | |||||
| 2025-07-24 | 13F | Us Bancorp \de\ | 454 | 123,65 | 17 | 166,67 | ||||
| 2025-07-31 | 13F | Buckingham Strategic Partners | 10 197 | 15,91 | 379 | 30,24 | ||||
| 2025-07-14 | 13F | U.S. Capital Wealth Advisors, LLC | 5 973 | −1,86 | 222 | 10,45 | ||||
| 2025-08-12 | 13F | MAI Capital Management | 700 | 0,00 | 26 | 13,04 | ||||
| 2025-08-14 | 13F | Strategic Wealth Designers | 0 | 0 | ||||||
| 2025-07-21 | NP | GGMBX - Goldman Sachs Global Managed Beta Fund Institutional Shares | 1 537 577 | 16,39 | 53 508 | 24,17 | ||||
| 2025-07-29 | 13F | Kelman-Lazarov, Inc. | 15 178 | −65,11 | 565 | −60,91 | ||||
| 2025-08-11 | 13F | HighTower Advisors, LLC | 9 205 | 0,00 | 343 | 12,13 | ||||
| 2025-08-05 | 13F | Bank Of Montreal /can/ | 992 | 37 | ||||||
| 2025-08-12 | 13F | Gladstone Institutional Advisory LLC | 104 923 | 0,87 | 3 904 | 13,13 | ||||
| 2025-08-13 | 13F | Northwestern Mutual Wealth Management Co | 388 | 11,49 | 14 | 27,27 | ||||
| 2025-08-06 | 13F | Commonwealth Equity Services, Llc | 157 937 | −0,34 | 6 | 0,00 | ||||
| 2025-07-24 | 13F | GFG Capital, LLC | 151 428 | −4,95 | 5 635 | 6,58 | ||||
| 2025-07-14 | 13F | AdvisorNet Financial, Inc | 143 | 0,00 | 5 | 25,00 | ||||
| 2025-07-16 | 13F | RWM Asset Management, LLC | 163 880 | 3,31 | 6 098 | 15,85 | ||||
| 2025-07-16 | 13F | Kathmere Capital Management, LLC | 6 433 | −0,60 | 239 | 11,68 | ||||
| 2025-08-13 | 13F | Congress Wealth Management LLC / DE / | 0 | −100,00 | 0 | |||||
| 2025-08-13 | 13F | Haverford Trust Co | 11 576 | 0,00 | 431 | 11,98 | ||||
| 2025-07-09 | 13F | Breakwater Investment Management | 75 | 0,00 | 3 | 0,00 | ||||
| 2025-08-14 | 13F | Smartleaf Asset Management LLC | 2 | −98,17 | 0 | −100,00 | ||||
| 2025-07-08 | 13F | Atwood & Palmer Inc | 47 310 | −1,57 | 1 760 | 10,41 | ||||
| 2025-08-13 | 13F | IAG Wealth Partners, LLC | 17 127 | 72,86 | 637 | 94,21 | ||||
| 2025-08-14 | 13F | Wells Fargo & Company/mn | 3 522 921 | 7,48 | 131 088 | 20,53 | ||||
| 2025-05-15 | 13F | Tower Research Capital LLC (TRC) | 0 | −100,00 | 0 | |||||
| 2025-07-28 | 13F | Harbour Investments, Inc. | 822 | −9,77 | 31 | 0,00 | ||||
| 2025-08-08 | 13F | Cetera Investment Advisers | 350 522 | 1,35 | 13 043 | 13,66 | ||||
| 2025-07-10 | 13F | Wealth Enhancement Advisory Services, Llc | 65 136 | −36,46 | 2 448 | −28,05 | ||||
| 2025-08-14 | 13F | CoreCap Advisors, LLC | 132 106 | 2,52 | 4 916 | 14,97 | ||||
| 2025-05-07 | 13F | WMS Partners, LLC | 0 | −100,00 | 0 | |||||
| 2025-07-16 | 13F | American National Bank | 126 967 | −5,30 | 4 724 | 6,21 | ||||
| 2025-08-14 | 13F | Old Mission Capital Llc | 49 008 | 1 824 | ||||||
| 2025-07-08 | 13F | Apella Capital, LLC | 338 287 | −15,74 | 12 530 | −0,79 | ||||
| 2025-08-12 | 13F | LPL Financial LLC | 1 918 529 | 5,94 | 71 388 | 18,81 | ||||
| 2025-08-19 | NP | GGSIX - Goldman Sachs Growth Strategy Portfolio Institutional | 197 259 | 0,00 | 7 340 | 12,15 | ||||
| 2025-05-15 | 13F | Chilton Investment Co Llc | 0 | −100,00 | 0 | |||||
| 2025-07-24 | 13F | Edge Financial Advisors LLC | 20 015 | −10,51 | 745 | 0,27 | ||||
| 2025-08-13 | 13F | Brown Advisory Inc | 0 | −100,00 | 0 | |||||
| 2025-08-14 | 13F | UBS Group AG | 258 100 | 4,17 | 9 604 | 16,81 | ||||
| 2025-07-25 | 13F | Cwm, Llc | 186 | −49,87 | 0 | |||||
| 2025-05-09 | 13F | NewEdge Wealth, LLC | 0 | −100,00 | 0 | |||||
| 2025-08-18 | 13F | Geneos Wealth Management Inc. | 290 | 11 | ||||||
| 2025-08-07 | 13F | Allworth Financial LP | 974 | 0,00 | 36 | 12,50 | ||||
| 2025-08-13 | 13F | SageView Advisory Group, LLC | 15 596 | −1,52 | 589 | 12,19 | ||||
| 2025-07-17 | 13F | Independence Bank of Kentucky | 850 | 32 | ||||||
| 2025-08-12 | 13F | Inscription Capital, LLC | 0 | −100,00 | 0 | |||||
| 2025-08-19 | NP | GIPIX - Goldman Sachs Balanced Strategy Portfolio Institutional | 49 119 | 0,00 | 1 828 | 12,15 | ||||
| 2025-07-17 | 13F | Clay Northam Wealth Management, LLC | 53 457 | 0,00 | 1 989 | 12,18 | ||||
| 2025-07-29 | 13F | Private Trust Co Na | 2 149 | 29,61 | 80 | 43,64 | ||||
| 2025-08-01 | 13F | Envestnet Asset Management Inc | 815 464 | 4,70 | 30 343 | 17,42 | ||||
| 2025-07-30 | 13F | Princeton Global Asset Management LLC | 497 | 0,00 | 18 | 12,50 | ||||
| 2025-07-17 | 13F | Worth Financial Advisory Group, LLC | 13 703 | −4,17 | 510 | 7,38 | ||||
| 2025-08-08 | 13F | Arvest Bank Trust Division | 1 212 184 | −0,59 | 45 105 | 11,48 | ||||
| 2025-08-08 | 13F | Larson Financial Group LLC | 0 | −100,00 | 0 | |||||
| 2025-07-25 | 13F | PrairieView Partners, LLC | 104 | 0,00 | 0 | |||||
| 2025-07-30 | 13F | Gables Capital Management Inc. | 4 | 0,00 | 0 | |||||
| 2025-08-11 | 13F | TD Waterhouse Canada Inc. | 1 075 | −20,37 | 40 | −11,11 | ||||
| 2025-07-28 | 13F | Frazier Financial Advisors, LLC | 10 | 0,00 | 0 | |||||
| 2025-07-10 | 13F | Wedmont Private Capital | 8 000 | 0,00 | 298 | 17,32 | ||||
| 2025-05-15 | 13F | Alexis Investment Partners, LLC | 0 | −100,00 | 0 | |||||
| 2025-08-12 | 13F | Global Retirement Partners, LLC | 8 068 | 19,03 | 300 | 38,89 | ||||
| 2025-08-29 | 13F | Centaurus Financial, Inc. | 4 200 | 11,26 | 0 | |||||
| 2025-07-18 | 13F | SigFig Wealth Management, LLC | 3 303 512 | −1,07 | 122 659 | 10,43 | ||||
| 2025-04-21 | 13F | Ronald Blue Trust, Inc. | 0 | −100,00 | 0 | −100,00 | ||||
| 2025-07-22 | 13F | Coastal Investment Advisors, Inc. | 0 | −100,00 | 0 | |||||
| 2025-08-12 | 13F | Change Path, LLC | 11 209 | −2,96 | 417 | 8,88 | ||||
| 2025-07-25 | 13F | Atria Wealth Solutions, Inc. | 13 771 | −55,86 | 512 | −50,53 | ||||
| 2025-08-13 | 13F | Colonial Trust Co / SC | 208 | 0,00 | 8 | 16,67 | ||||
| 2025-05-15 | 13F/A | Orion Portfolio Solutions, LLC | 10 612 | 40,11 | 352 | 46,06 | ||||
| 2025-07-08 | 13F | Nbc Securities, Inc. | 455 | 0,00 | 0 | |||||
| 2025-07-28 | 13F | BRYN MAWR TRUST Co | 4 410 | −9,59 | 164 | 1,86 | ||||
| 2025-08-14 | 13F | Keebeck Wealth Management, LLC | 30 865 | 1 148 | ||||||
| 2025-07-23 | 13F | West Paces Advisors Inc. | 0 | −100,00 | 0 |
Other Listings
| MX:GEM |