Grundläggande statistik
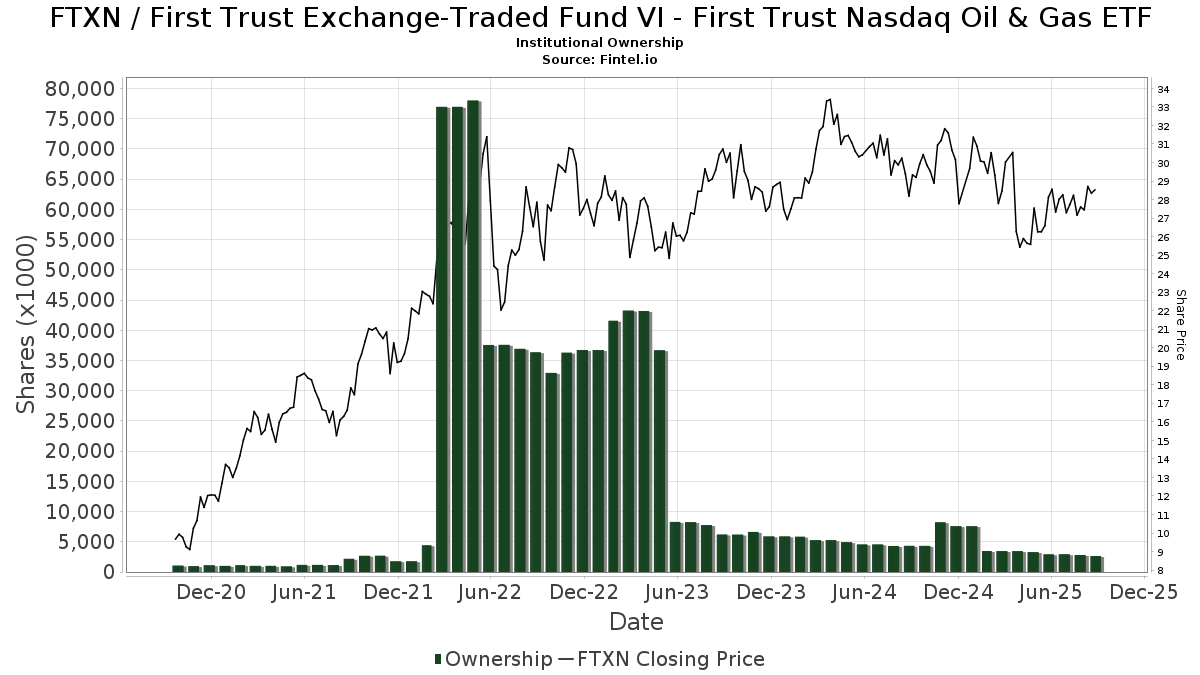
| Institutionella ägare | 76 total, 76 long only, 0 short only, 0 long/short - change of −15,22% MRQ |
| Genomsnittlig portföljallokering | 0.0359 % - change of −24,93% MRQ |
| Institutionella aktier (lång) | 2 635 896 (ex 13D/G) - change of −0,28MM shares −9,65% MRQ |
| Institutionellt värde (lång) | $ 66 999 USD ($1000) |
Institutionellt ägande och aktieägare
First Trust Exchange-Traded Fund VI - First Trust Nasdaq Oil & Gas ETF (US:FTXN) har 76 Institutionella ägare och aktieägare som har lämnat in 13D/G- eller 13F-formulär till Securities Exchange Commission (SEC). Dessa institut innehar totalt 2,635,896 aktier. Största aktieägare inkluderar Morgan Stanley, LPL Financial LLC, Advisor Group Holdings, Inc., Truist Financial Corp, Cetera Investment Advisers, Wells Fargo & Company/mn, Raymond James Financial Inc, SFI Advisors, LLC, Envestnet Asset Management Inc, and Commonwealth Equity Services, Llc .
First Trust Exchange-Traded Fund VI - First Trust Nasdaq Oil & Gas ETF (NasdaqGM:FTXN) Institutionell ägarstruktur visar institutioners och fonders nuvarande positioner i företaget, samt de senaste förändringarna i positionernas storlek. Större aktieägare kan vara enskilda investerare, fonder, hedgefonder eller institutioner. Bilaga 13D visar att investeraren äger (eller ägde) mer än 5% av företaget och avser (eller avsåg) att aktivt eftersträva en förändring av affärsstrategin. Schedule 13G indikerar en passiv investering på över 5%.
The share price as of September 10, 2025 is 28,53 / share. Previously, on September 11, 2024, the share price was 28,19 / share. This represents an increase of 1,21% over that period.
Fondsentimentets poäng
Fondsentimentet poängen(fka Ägarackumulation-poäng) visar vilka aktier som är mest köpta av fonder. Det är resultatet av en sofistikerad kvantitativ flerfaktormodell som identifierar företag med de högsta nivåerna av institutionell ackumulering. Poängsättningsmodellen använder en kombination av den totala ökningen av redovisade ägare, förändringarna i portföljallokeringarna för dessa ägare och andra mått. Siffran sträcker sig från 0 till 100, där högre siffror indikerar en högre nivå av ackumulering i förhållande till sina konkurrenter, och 50 är genomsnittet.
Uppdateringsfrekvens: Dagligen
Se Ownership Explorer, som innehåller en lista över de högst rankade företagen.
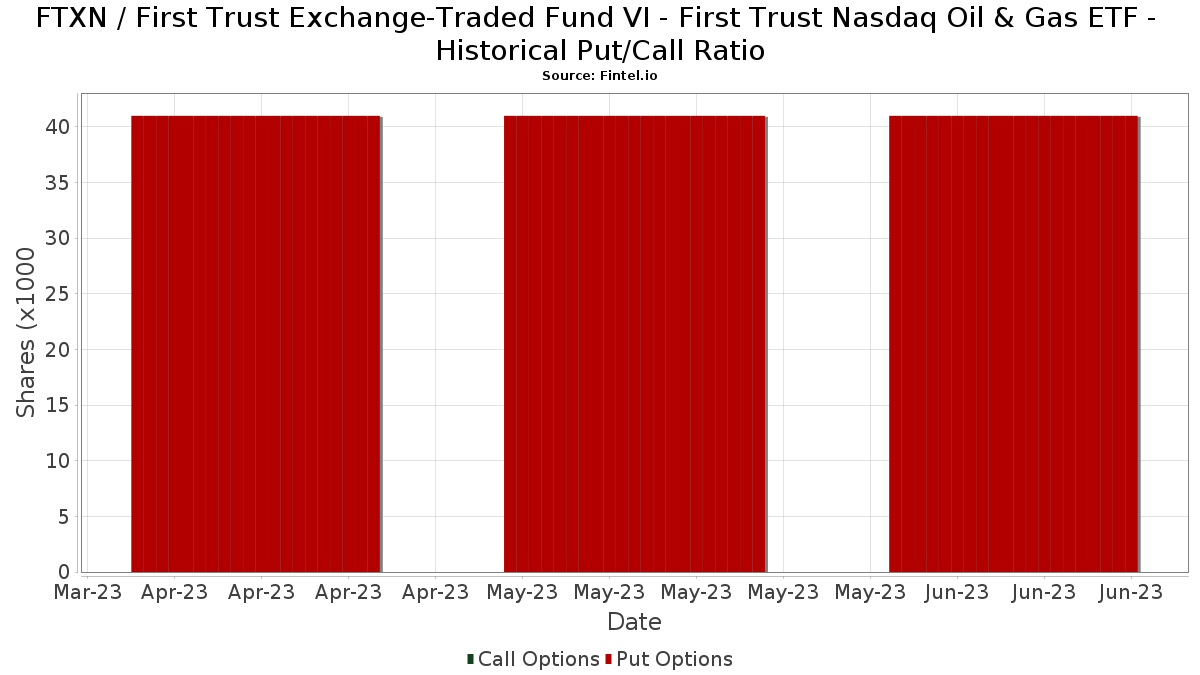
Institutionell sälj/köp-kvot
Förutom att rapportera vanliga eget kapital- och skuldemissioner måste institutioner med mer än 100MM tillgångar under förvaltning också avslöja sina innehav av sälj- och köpoptioner. Eftersom säljoptioner i allmänhet indikerar ett negativt sentiment och köpoptioner indikerar ett positivt sentiment, kan vi få en uppfattning om det övergripande institutionella sentimentet genom att plotta förhållandet mellan säljoptioner och köpoptioner. Diagrammet till höger visar det historiska förhållandet mellan sälj- och köpoptioner för detta instrument.
Genom att använda sälj/köp-kvoten som en indikator på aktieägarnas sentiment undviker man en av de största bristerna med att använda det totala institutionella ägandet, nämligen att en betydande del av de förvaltade tillgångarna investeras passivt för att följa index. Passivt förvaltade fonder köper vanligtvis inte optioner, så indikatorn för sälj/köp-kvoten ger en bättre bild av stämningen i aktivt förvaltade fonder.
13F- och NPORT-arkiveringar
Detaljer om 13F-arkiveringar är gratis. Detaljer om NP-arkiveringar kräver ett premiummedlemskap. Gröna rader indikerar nya positioner. Röda rader indikerar stängda positioner. Klicka på länk symbolen för att se hela transaktionshistoriken.
Uppgradera
för att låsa upp premiumdata och exportera till Excel ![]() .
.
| Fil Datum | Källa | Investerare | Typ | Genomsnittligt pris (beräknat) |
Aktier | Δ Aktier (%) |
Rapporterat värde (1000 USD) |
Δ Värde (%) |
Portföljallokering (%) |
|
|---|---|---|---|---|---|---|---|---|---|---|
| 2025-08-11 | 13F | Principal Securities, Inc. | 3 677 | 31,32 | 100 | 25,00 | ||||
| 2025-08-06 | 13F | Golden State Wealth Management, LLC | 456 | 0,00 | 12 | −7,69 | ||||
| 2025-08-12 | 13F | LPL Financial LLC | 490 829 | −6,92 | 13 355 | −16,36 | ||||
| 2025-08-13 | 13F | Transce3nd, LLC | 8 | 0 | ||||||
| 2025-07-17 | 13F | Wagner Wealth Management, Llc | 1 | 0,00 | 0 | |||||
| 2025-07-31 | 13F | Cambridge Investment Research Advisors, Inc. | 23 726 | −50,97 | 1 | −100,00 | ||||
| 2025-08-08 | 13F | Glassman Wealth Services | 0 | −100,00 | 0 | |||||
| 2025-08-06 | 13F | Commonwealth Equity Services, Llc | 62 779 | −4,28 | 2 | 0,00 | ||||
| 2025-08-06 | 13F | AE Wealth Management LLC | 326 | 71,58 | 9 | 60,00 | ||||
| 2025-08-29 | 13F | Centaurus Financial, Inc. | 10 310 | 6,94 | 0 | |||||
| 2025-04-28 | 13F | Private Trust Co Na | 0 | −100,00 | 0 | |||||
| 2025-07-28 | 13F | Kiker Wealth Management, LLC | 71 | 0,00 | 2 | −50,00 | ||||
| 2025-07-29 | 13F | Activest Wealth Management | 5 524 | 0,00 | 150 | −10,18 | ||||
| 2025-08-14 | 13F | Citadel Advisors Llc | 34 861 | 18,45 | 949 | 6,40 | ||||
| 2025-07-08 | 13F | Nbc Securities, Inc. | 1 848 | 2,61 | 0 | |||||
| 2025-07-25 | 13F | Total Clarity Wealth Management, Inc. | 0 | −100,00 | 0 | |||||
| 2025-08-14 | 13F | Harvest Investment Services, LLC | 15 531 | 1,04 | 423 | −9,25 | ||||
| 2025-08-18 | 13F | Geneos Wealth Management Inc. | 725 | −52,46 | 20 | −58,70 | ||||
| 2025-09-04 | 13F/A | Advisor Group Holdings, Inc. | 245 169 | 155,05 | 6 677 | 129,21 | ||||
| 2025-05-16 | 13F | Laidlaw Wealth Management LLC | 0 | −100,00 | 0 | −100,00 | ||||
| 2025-08-04 | 13F | L.m. Kohn & Company | 9 563 | 0,00 | 260 | −10,03 | ||||
| 2025-07-22 | 13F | DAVENPORT & Co LLC | 21 634 | −24,71 | 589 | −32,41 | ||||
| 2025-07-25 | 13F | Cwm, Llc | 44 822 | −1,24 | 1 | 0,00 | ||||
| 2025-08-14 | 13F | Bank Of America Corp /de/ | 8 548 | −52,48 | 233 | −57,35 | ||||
| 2025-08-12 | 13F | Proequities, Inc. | 0 | 0 | ||||||
| 2025-08-14 | 13F | MGB Wealth Management, LLC | 6 425 | 0,00 | 175 | −10,31 | ||||
| 2025-05-14 | 13F | Rockefeller Capital Management L.P. | 0 | −100,00 | 0 | |||||
| 2025-08-14 | 13F | Royal Bank Of Canada | 30 457 | −40,36 | 829 | −46,38 | ||||
| 2025-08-01 | 13F | Envestnet Asset Management Inc | 86 186 | −6,32 | 2 345 | −15,80 | ||||
| 2025-07-24 | 13F | Insight Inv LLC | 201 | 0,00 | 5 | −16,67 | ||||
| 2025-08-14 | 13F | Financial Advisory Service, Inc. | 2 672 | 0,79 | 73 | −10,00 | ||||
| 2025-08-14 | 13F | Wells Fargo & Company/mn | 111 906 | −9,71 | 3 045 | −18,89 | ||||
| 2025-05-09 | 13F | CoreCap Advisors, LLC | 0 | −100,00 | 0 | |||||
| 2025-04-30 | 13F | Sofos Investments, Inc. | 0 | −100,00 | 0 | −100,00 | ||||
| 2025-08-11 | 13F | Citigroup Inc | 0 | −100,00 | 0 | |||||
| 2025-08-04 | 13F | Creekmur Asset Management LLC | 0 | −100,00 | 0 | |||||
| 2025-08-14 | 13F | UBS Group AG | 619 | −92,84 | 17 | −93,87 | ||||
| 2025-07-17 | 13F | Janney Montgomery Scott LLC | 13 508 | −12,64 | 0 | |||||
| 2025-07-14 | 13F | AdvisorNet Financial, Inc | 0 | −100,00 | 0 | |||||
| 2025-07-14 | 13F | U.S. Capital Wealth Advisors, LLC | 7 999 | 0,00 | 218 | −10,33 | ||||
| 2025-08-14 | 13F | Susquehanna International Group, Llp | 17 313 | −48,90 | 471 | −54,05 | ||||
| 2025-05-16 | 13F | Coppell Advisory Solutions LLC | 0 | −100,00 | 0 | |||||
| 2025-07-07 | 13F | Nova Wealth Management, Inc. | 307 | −92,54 | 8 | −93,55 | ||||
| 2025-08-14 | 13F | Comerica Bank | 181 | 0,00 | 5 | −20,00 | ||||
| 2025-05-29 | 13F | Apeiron RIA LLC | 0 | −100,00 | 0 | |||||
| 2025-08-12 | 13F | Quantum Private Wealth, LLC | 28 985 | −23,70 | 789 | −31,48 | ||||
| 2025-07-30 | 13F | D.a. Davidson & Co. | 0 | −100,00 | 0 | |||||
| 2025-08-13 | 13F | Flow Traders U.s. Llc | 0 | −100,00 | 0 | |||||
| 2025-08-15 | 13F | Tower Research Capital LLC (TRC) | 6 035 | −68,95 | 164 | −72,11 | ||||
| 2025-08-14 | 13F | Goldman Sachs Group Inc | 18 977 | 18,41 | 516 | 6,39 | ||||
| 2025-07-24 | 13F | IFP Advisors, Inc | 171 | −64,89 | 5 | −71,43 | ||||
| 2025-08-12 | 13F | Archer Investment Corp | 67 | 1,52 | 2 | −50,00 | ||||
| 2025-07-25 | 13F | Atria Wealth Solutions, Inc. | 12 489 | 2,46 | 345 | −6,78 | ||||
| 2025-08-14 | 13F | Raymond James Financial Inc | 105 186 | −11,41 | 2 862 | −20,39 | ||||
| 2025-07-18 | 13F | Truist Financial Corp | 139 412 | −10,88 | 3 793 | −19,91 | ||||
| 2025-07-25 | 13F | We Are One Seven, LLC | 8 506 | −6,74 | 231 | −16,30 | ||||
| 2025-08-06 | 13F | Mark Sheptoff Financial Planning, Llc | 333 | 0,00 | 9 | −10,00 | ||||
| 2025-08-12 | 13F | Jpmorgan Chase & Co | 0 | −100,00 | 0 | −100,00 | ||||
| 2025-08-15 | 13F | Morgan Stanley | 541 710 | −4,36 | 14 740 | −14,06 | ||||
| 2025-08-19 | 13F | Anchor Investment Management, LLC | 1 105 | 0,00 | 30 | −9,09 | ||||
| 2025-08-14 | 13F | Tudor Financial Inc. | 0 | −100,00 | 0 | |||||
| 2025-08-05 | 13F | HFG Advisors, Inc. | 9 360 | −3,85 | 255 | −13,61 | ||||
| 2025-04-10 | 13F | Clarus Wealth Advisors | 0 | −100,00 | 0 | |||||
| 2025-08-08 | 13F | Avantax Advisory Services, Inc. | 0 | −100,00 | 0 | |||||
| 2025-08-14 | 13F | EP Wealth Advisors, Inc. | 4 545 | −0,70 | 124 | −10,87 | ||||
| 2025-08-05 | 13F | Westside Investment Management, Inc. | 549 | 0,00 | 15 | −12,50 | ||||
| 2025-08-12 | 13F | Steward Partners Investment Advisory, Llc | 4 619 | −22,82 | 126 | −30,94 | ||||
| 2025-07-21 | 13F | HighMark Wealth Management LLC | 1 150 | 0,00 | 31 | −8,82 | ||||
| 2025-08-11 | 13F | SFI Advisors, LLC | 89 943 | −3,86 | 2 447 | −13,59 | ||||
| 2025-08-08 | 13F | Pnc Financial Services Group, Inc. | 500 | 0,00 | 14 | −13,33 | ||||
| 2025-08-05 | 13F | Sigma Planning Corp | 20 426 | 556 | ||||||
| 2025-07-31 | 13F | Brinker Capital Investments, LLC | 0 | −100,00 | 0 | −100,00 | ||||
| 2025-08-11 | 13F | Private Advisor Group, LLC | 14 371 | −52,55 | 391 | −57,36 | ||||
| 2025-08-14 | 13F | Fmr Llc | 1 267 | 19,08 | 34 | 6,25 | ||||
| 2025-08-14 | 13F | Stifel Financial Corp | 10 132 | −54,36 | 276 | −59,08 | ||||
| 2025-08-12 | 13F | Global Retirement Partners, LLC | 2 262 | −21,87 | 62 | −26,51 | ||||
| 2025-05-14 | 13F | Jane Street Group, Llc | 0 | −100,00 | 0 | |||||
| 2025-05-15 | 13F | StoneX Group Inc. | 0 | −100,00 | 0 | −100,00 | ||||
| 2025-07-28 | 13F | Harbour Investments, Inc. | 6 152 | −2,27 | 167 | −12,11 | ||||
| 2025-08-12 | 13F | J.w. Cole Advisors, Inc. | 7 765 | 2,12 | 211 | −8,26 | ||||
| 2025-07-24 | 13F | Cyndeo Wealth Partners, LLC | 12 439 | 0,00 | 338 | −10,11 | ||||
| 2025-08-14 | 13F | Vivaldi Capital Management, LLC | 0 | −100,00 | 0 | |||||
| 2025-08-14 | 13F | Transamerica Financial Advisors, Inc. | 71 | 0,00 | 2 | |||||
| 2025-08-11 | 13F | Regal Investment Advisors LLC | 9 510 | −6,31 | 259 | −15,96 | ||||
| 2025-07-28 | 13F | Mutual Advisors, LLC | 11 417 | −12,10 | 319 | −6,74 | ||||
| 2025-08-11 | 13F | Y.D. More Investments Ltd | 0 | −100,00 | 0 | |||||
| 2025-08-14 | 13F | Two Sigma Investments, Lp | 0 | −100,00 | 0 | |||||
| 2025-07-08 | 13F | Adamsbrown Wealth Consultants Llc | 9 357 | 11,79 | 255 | 0,40 | ||||
| 2025-08-11 | 13F | HHM Wealth Advisors, LLC | 666 | 0,00 | 18 | −10,00 | ||||
| 2025-08-14 | 13F | GWM Advisors LLC | 2 934 | −73,87 | 80 | −76,70 | ||||
| 2025-08-13 | 13F | Green Harvest Asset Management LLC | 16 849 | −58,58 | 458 | −62,79 | ||||
| 2025-07-29 | 13F | International Assets Investment Management, Llc | 55 748 | −3,69 | 1 517 | −13,47 | ||||
| 2025-08-08 | 13F | Cetera Investment Advisers | 130 120 | 6,55 | 3 541 | −4,25 | ||||
| 2025-08-04 | 13F | Assetmark, Inc | 0 | −100,00 | 0 | |||||
| 2025-08-26 | 13F | Claris Financial LLC | 0 | −100,00 | 0 | |||||
| 2025-07-17 | 13F | HB Wealth Management, LLC | 7 877 | 214 | ||||||
| 2025-07-24 | 13F | Ronald Blue Trust, Inc. | 48 | 0,00 | 1 | 0,00 | ||||
| 2025-08-14 | 13F | Marshall Investment Management, Llc | 0 | −100,00 | 0 | |||||
| 2025-08-14 | 13F | Mml Investors Services, Llc | 16 054 | 4,00 | 0 | |||||
| 2025-08-07 | 13F | Hughes Financial Services, LLC | 330 | 0,00 | 9 | −20,00 | ||||
| 2025-08-14 | 13F | Quantinno Capital Management LP | 23 220 | 19,05 | 632 | 6,95 | ||||
| 2025-05-15 | 13F | National Wealth Management Group, LLC | 0 | −100,00 | 0 | −100,00 | ||||
| 2025-08-12 | 13F | SRS Capital Advisors, Inc. | 0 | −100,00 | 0 | |||||
| 2025-05-12 | 13F | Independent Advisor Alliance | 0 | −100,00 | 0 | |||||
| 2025-05-19 | 13F | Heck Capital Advisors, LLC | 0 | 0 | ||||||
| 2025-08-15 | 13F | Kestra Advisory Services, LLC | 30 368 | 6,95 | 826 | −3,84 | ||||
| 2025-08-05 | 13F | Huntington National Bank | 52 | −41,38 | ||||||
| 2025-08-07 | 13F | Kestra Private Wealth Services, Llc | 0 | −100,00 | 0 | −100,00 | ||||
| 2025-08-01 | 13F | Rossby Financial, LCC | 325 | 0,00 | 9 | 0,00 | ||||
| 2025-07-29 | 13F | Stratos Wealth Partners, LTD. | 14 364 | −24,02 | 391 | −31,82 |