Grundläggande statistik
| Institutionella ägare | 139 total, 139 long only, 0 short only, 0 long/short - change of −2,80% MRQ |
| Genomsnittlig portföljallokering | 0.3661 % - change of 18,34% MRQ |
| Institutionella aktier (lång) | 16 552 628 (ex 13D/G) - change of 0,13MM shares 0,81% MRQ |
| Institutionellt värde (lång) | $ 826 449 USD ($1000) |
Institutionellt ägande och aktieägare
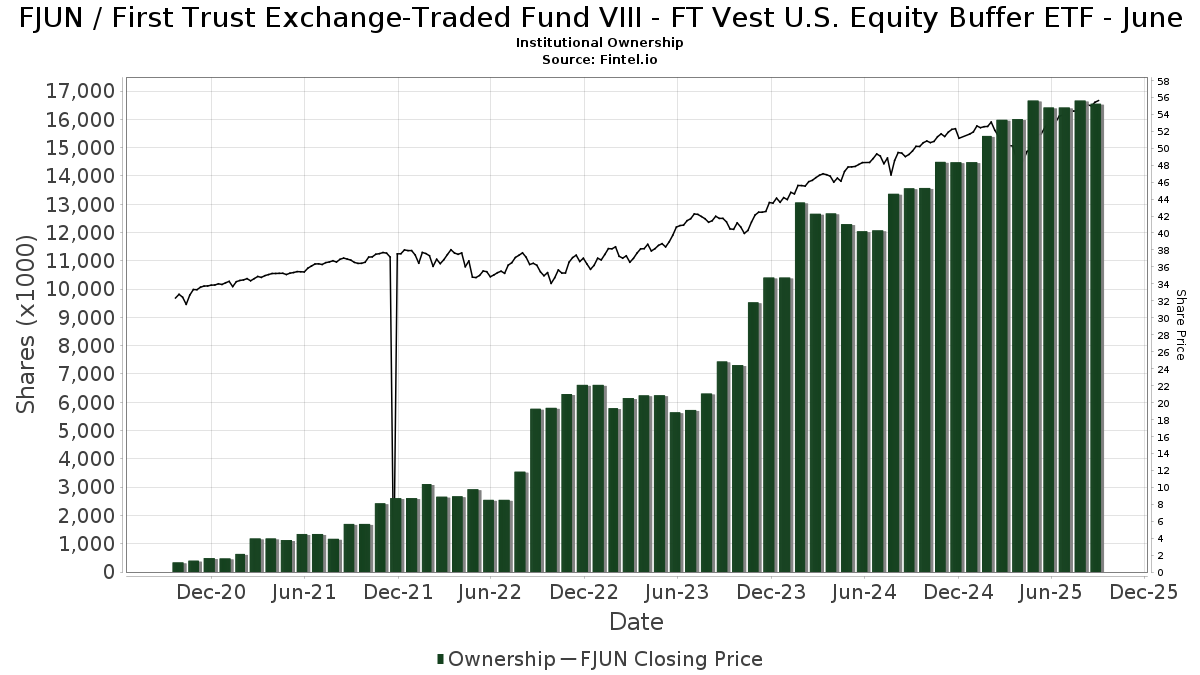
First Trust Exchange-Traded Fund VIII - FT Vest U.S. Equity Buffer ETF - June (US:FJUN) har 139 Institutionella ägare och aktieägare som har lämnat in 13D/G- eller 13F-formulär till Securities Exchange Commission (SEC). Dessa institut innehar totalt 16,552,628 aktier. Största aktieägare inkluderar BUFR - FT Cboe Vest Fund of Buffer ETFs, BUFG - FT Cboe Vest Buffered Allocation Growth ETF, Commonwealth Equity Services, Llc, Envestnet Asset Management Inc, Raymond James Financial Inc, Signal Advisors Wealth, LLC, Foguth Wealth Management, LLC., Advisor Group Holdings, Inc., Keystone Wealth Services, LLC, and LPL Financial LLC .
First Trust Exchange-Traded Fund VIII - FT Vest U.S. Equity Buffer ETF - June (BATS:FJUN) Institutionell ägarstruktur visar institutioners och fonders nuvarande positioner i företaget, samt de senaste förändringarna i positionernas storlek. Större aktieägare kan vara enskilda investerare, fonder, hedgefonder eller institutioner. Bilaga 13D visar att investeraren äger (eller ägde) mer än 5% av företaget och avser (eller avsåg) att aktivt eftersträva en förändring av affärsstrategin. Schedule 13G indikerar en passiv investering på över 5%.
The share price as of September 5, 2025 is 55,17 / share. Previously, on September 9, 2024, the share price was 48,75 / share. This represents an increase of 13,17% over that period.
Fondsentimentets poäng
Fondsentimentet poängen(fka Ägarackumulation-poäng) visar vilka aktier som är mest köpta av fonder. Det är resultatet av en sofistikerad kvantitativ flerfaktormodell som identifierar företag med de högsta nivåerna av institutionell ackumulering. Poängsättningsmodellen använder en kombination av den totala ökningen av redovisade ägare, förändringarna i portföljallokeringarna för dessa ägare och andra mått. Siffran sträcker sig från 0 till 100, där högre siffror indikerar en högre nivå av ackumulering i förhållande till sina konkurrenter, och 50 är genomsnittet.
Uppdateringsfrekvens: Dagligen
Se Ownership Explorer, som innehåller en lista över de högst rankade företagen.
Institutionell sälj/köp-kvot
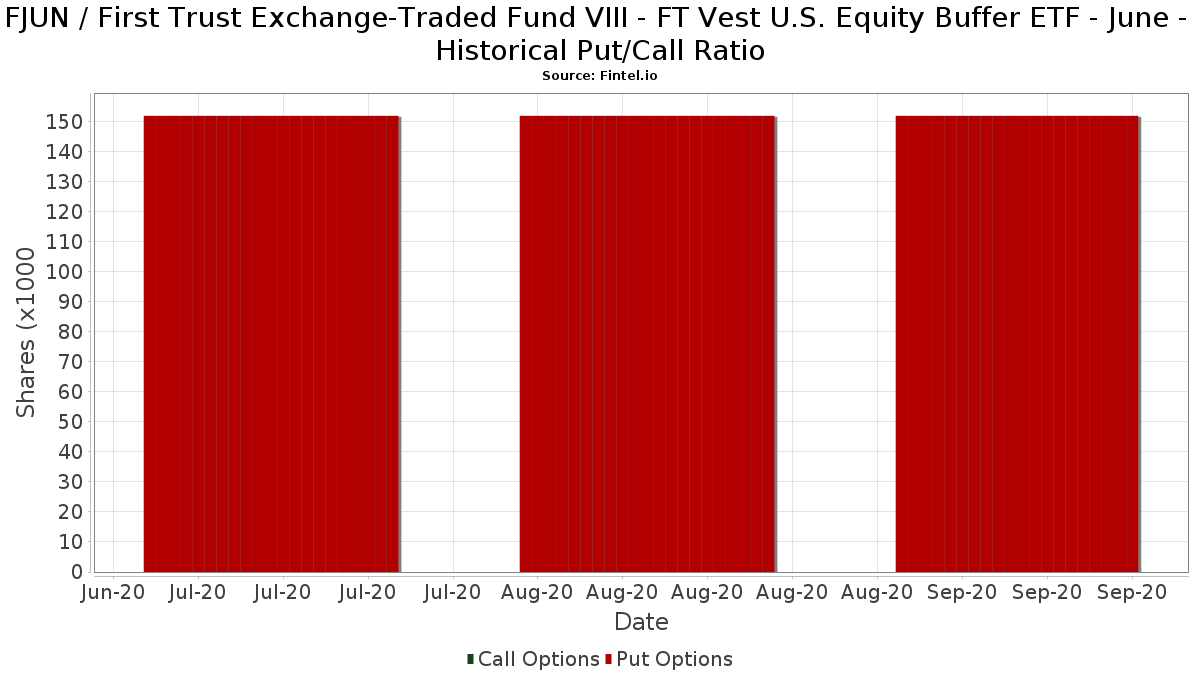
Förutom att rapportera vanliga eget kapital- och skuldemissioner måste institutioner med mer än 100MM tillgångar under förvaltning också avslöja sina innehav av sälj- och köpoptioner. Eftersom säljoptioner i allmänhet indikerar ett negativt sentiment och köpoptioner indikerar ett positivt sentiment, kan vi få en uppfattning om det övergripande institutionella sentimentet genom att plotta förhållandet mellan säljoptioner och köpoptioner. Diagrammet till höger visar det historiska förhållandet mellan sälj- och köpoptioner för detta instrument.
Genom att använda sälj/köp-kvoten som en indikator på aktieägarnas sentiment undviker man en av de största bristerna med att använda det totala institutionella ägandet, nämligen att en betydande del av de förvaltade tillgångarna investeras passivt för att följa index. Passivt förvaltade fonder köper vanligtvis inte optioner, så indikatorn för sälj/köp-kvoten ger en bättre bild av stämningen i aktivt förvaltade fonder.
13D/G-Arkiveringar
Vi presenterar 13D/G-arkiveringar separat från 13F-arkiveringar på grund av att de behandlas olika av SEC. 13D/G-arkiveringar kan lämnas in av grupper av investerare (med en ledare), medan 13F-arkiveringar inte kan det. Detta leder till situationer där en investerare kan lämna in en 13D/G-ansökan med ett värde för de totala aktierna (vilket motsvarar alla aktier som ägs av investerargruppen), men sedan lämna in en 13F-ansökan med ett annat värde för de totala aktierna (vilket motsvarar enbart deras eget ägande). Detta innebär att aktieägandet i 13D/G-arkiveringar och 13F-arkiveringar ofta inte är direkt jämförbara, så vi presenterar dem separat.
Notera: Från och med den 16 maj 2021 visar vi inte längre ägare som inte har lämnat in en 13D/G under det senaste året. Tidigare visade vi hela historiken för 13D/G-arkiveringar. I allmänhet måste enheter som är skyldiga att lämna in 13D/G-arkiveringar lämna in minst en gång per år innan de lämnar in en stängningsarkivering. Fonder avslutar dock ibland positioner utan att lämna in en avslutande arkivering (dvs. de avvecklar), så att visa hela historiken resulterade ibland i förvirring om det nuvarande ägandet. För att förhindra förvirring visar vi nu endast "nuvarande" ägare - det vill säga ägare som har lämnat in en ansökan under det senaste året.
Upgrade to unlock premium data.
| Fil Datum | Formulär | Investerare | Föregående aktier |
Senaste aktier |
Δ Aktier (Procent) |
Ägande (Procent) |
Δ Ägande (Procent) |
|
|---|---|---|---|---|---|---|---|---|
| 2025-07-21 | FIRST TRUST PORTFOLIOS LP | 11,403,949 | 10,702,092 | -6.15 | 62.04 | -2.35 |
13F- och NPORT-arkiveringar
Detaljer om 13F-arkiveringar är gratis. Detaljer om NP-arkiveringar kräver ett premiummedlemskap. Gröna rader indikerar nya positioner. Röda rader indikerar stängda positioner. Klicka på länk symbolen för att se hela transaktionshistoriken.
Uppgradera
för att låsa upp premiumdata och exportera till Excel ![]() .
.
| Fil Datum | Källa | Investerare | Typ | Genomsnittligt pris (beräknat) |
Aktier | Δ Aktier (%) |
Rapporterat värde (1000 USD) |
Δ Värde (%) |
Portföljallokering (%) |
|
|---|---|---|---|---|---|---|---|---|---|---|
| 2025-08-14 | 13F/A | Barclays Plc | 2 578 | −10,95 | 0 | |||||
| 2025-05-14 | 13F | Eqis Capital Management, Inc. | 0 | −100,00 | 0 | −100,00 | ||||
| 2025-08-11 | 13F | United Capital Financial Advisers, Llc | 4 300 | 0,00 | 231 | 7,48 | ||||
| 2025-07-25 | 13F | Apollon Wealth Management, LLC | 24 032 | 1,76 | 1 290 | 9,42 | ||||
| 2025-08-29 | 13F | Centaurus Financial, Inc. | 14 593 | 3,73 | 1 | |||||
| 2025-08-14 | 13F | Glen Eagle Advisors, LLC | 3 750 | 0,00 | 201 | 7,49 | ||||
| 2025-08-14 | 13F | LM Advisors LLC | 44 186 | 700,76 | 2 | |||||
| 2025-07-23 | 13F | Kingswood Wealth Advisors, Llc | 5 678 | −24,10 | 305 | −18,72 | ||||
| 2025-07-25 | 13F | Concurrent Investment Advisors, LLC | 7 252 | 0,00 | 389 | 7,76 | ||||
| 2025-08-04 | 13F | Arbor Capital Management Inc /adv | 4 367 | −3,02 | 236 | 4,44 | ||||
| 2025-08-04 | 13F | Buck Wealth Strategies, LLC | 5 092 | 273 | ||||||
| 2025-08-12 | 13F | Wood Tarver Financial Group, LLC | 3 404 | 0 | ||||||
| 2025-07-18 | 13F | SOA Wealth Advisors, LLC. | 20 165 | 42,45 | 1 082 | 53,26 | ||||
| 2025-08-14 | 13F | Comerica Bank | 427 | 0,00 | 23 | 4,76 | ||||
| 2025-08-14 | 13F | Bank Of America Corp /de/ | 0 | −100,00 | 0 | |||||
| 2025-08-13 | 13F | Capital Analysts, Inc. | 4 761 | 0,00 | 0 | |||||
| 2025-08-14 | 13F | Susquehanna International Group, Llp | 0 | −100,00 | 0 | |||||
| 2025-08-14 | 13F | UBS Group AG | 0 | −100,00 | 0 | |||||
| 2025-08-14 | 13F | Two Sigma Securities, Llc | 0 | −100,00 | 0 | |||||
| 2025-07-15 | 13F | McCarthy & Cox | 30 572 | 0,00 | 1 641 | 7,54 | ||||
| 2025-05-09 | 13F | Atria Wealth Solutions, Inc. | 0 | −100,00 | 0 | |||||
| 2025-08-05 | 13F | EPG Wealth Management LLC | 0 | −100,00 | 0 | |||||
| 2025-08-08 | 13F | Ogorek Anthony Joseph /ny/ /adv | 0 | −100,00 | 0 | |||||
| 2025-08-08 | 13F | Pnc Financial Services Group, Inc. | 9 442 | −12,78 | 507 | −6,30 | ||||
| 2025-08-15 | 13F | Fsb Premier Wealth Management, Inc. | 8 575 | −10,32 | 460 | −3,56 | ||||
| 2025-05-15 | 13F/A | Orion Portfolio Solutions, LLC | 6 290 | 4,21 | 314 | 0,97 | ||||
| 2025-08-08 | 13F | Tanglewood Legacy Advisors, LLC | 35 389 | −5,02 | 1 899 | 2,21 | ||||
| 2025-09-04 | 13F/A | Advisor Group Holdings, Inc. | 210 574 | 25,01 | 11 198 | 33,25 | ||||
| 2025-05-01 | 13F | Key FInancial Inc | 0 | −100,00 | 0 | |||||
| 2025-07-17 | 13F | Nelson, Van Denburg & Campbell Wealth Management Group, LLC | 7 814 | 0,00 | 419 | 7,71 | ||||
| 2025-07-11 | 13F | Farther Finance Advisors, LLC | 12 243 | −0,41 | 657 | 6,66 | ||||
| 2025-05-15 | 13F | Gts Securities Llc | 0 | −100,00 | 0 | |||||
| 2025-07-25 | 13F | Envestnet Portfolio Solutions, Inc. | 7 846 | 44,71 | 421 | 55,93 | ||||
| 2025-08-12 | 13F | CIBC Private Wealth Group, LLC | 0 | −100,00 | 0 | |||||
| 2025-08-12 | 13F | Allen Capital Group, LLC | 3 769 | 202 | ||||||
| 2025-07-25 | 13F | Cwm, Llc | 183 615 | 8,15 | 10 | 12,50 | ||||
| 2025-08-07 | 13F | Resources Investment Advisors, LLC. | 7 952 | −9,68 | 427 | −2,96 | ||||
| 2025-08-12 | 13F | Proequities, Inc. | 0 | 0 | ||||||
| 2025-08-08 | 13F | Foundations Investment Advisors, LLC | 42 159 | 32,56 | 2 263 | 42,62 | ||||
| 2025-08-08 | 13F | Cetera Investment Advisers | 163 286 | −48,58 | 8 764 | −44,68 | ||||
| 2025-08-11 | 13F | Anfield Capital Management, LLC | 1 686 | −34,83 | 90 | −30,23 | ||||
| 2025-07-29 | 13F | AssuredPartners Investment Advisors, LLC | 4 245 | 0,00 | 228 | 7,58 | ||||
| 2025-08-06 | 13F | AE Wealth Management LLC | 5 046 | −64,58 | 271 | −61,97 | ||||
| 2025-08-12 | 13F | Change Path, LLC | 24 137 | −79,40 | 1 295 | −77,84 | ||||
| 2025-08-19 | 13F | National Asset Management, Inc. | 0 | −100,00 | 0 | |||||
| 2025-08-14 | 13F | Mml Investors Services, Llc | 76 563 | −13,20 | 4 | 0,00 | ||||
| 2025-07-31 | 13F | Cambridge Investment Research Advisors, Inc. | 96 631 | −1,70 | 5 | 25,00 | ||||
| 2025-07-30 | 13F | Brookstone Capital Management | 9 001 | −48,55 | 483 | −44,61 | ||||
| 2025-08-14 | 13F | Citadel Advisors Llc | 6 814 | −3,99 | 366 | 3,11 | ||||
| 2025-08-13 | 13F | Mount Yale Investment Advisors, LLC | 2 841 | 152 | ||||||
| 2025-08-05 | 13F | Integrity Financial Corp /WA | 33 185 | 0,49 | 1 781 | 8,14 | ||||
| 2025-05-09 | 13F | GeoWealth Management, LLC | 0 | −100,00 | 0 | |||||
| 2025-08-15 | 13F | Morgan Stanley | 81 | −42,14 | 4 | −33,33 | ||||
| 2025-07-09 | 13F | Keystone Wealth Services, LLC | 204 416 | 10,56 | 10 971 | 18,94 | ||||
| 2025-08-11 | 13F | Principal Securities, Inc. | 19 471 | 0,00 | 1 045 | 4,50 | ||||
| 2025-08-11 | 13F | Aptus Capital Advisors, LLC | 71 907 | −3,85 | 3 859 | 3,46 | ||||
| 2025-07-28 | 13F | RFG Advisory, LLC | 8 541 | 458 | ||||||
| 2025-08-15 | 13F | Kestra Advisory Services, LLC | 111 850 | 2,74 | 6 003 | 10,51 | ||||
| 2025-05-09 | 13F | Chicago Partners Investment Group LLC | 0 | −100,00 | 0 | |||||
| 2025-07-10 | 13F | Kmg Fiduciary Partners, Llc | 25 046 | 0,00 | 1 344 | 7,61 | ||||
| 2025-07-30 | 13F | Strategic Blueprint, LLC | 30 293 | 0,18 | 1 626 | 7,76 | ||||
| 2025-08-12 | 13F | Park Square Financial Group, LLC | 493 | 0,00 | 26 | 8,33 | ||||
| 2025-07-14 | 13F | Signature Securities Group Corporation | 0 | −100,00 | 0 | |||||
| 2025-08-11 | 13F | Plotkin Financial Advisors, LLC | 10 509 | 0,00 | 564 | 7,63 | ||||
| 2025-08-14 | 13F | Ambassador Advisors, LLC | 59 391 | 12,50 | 3 188 | 21,04 | ||||
| 2025-08-12 | 13F | Archer Investment Corp | 9 681 | −0,45 | 520 | 7,01 | ||||
| 2025-05-14 | 13F | Jane Street Group, Llc | 4 194 | −77,56 | 209 | −78,23 | ||||
| 2025-08-14 | 13F | Old Mission Capital Llc | 0 | −100,00 | 0 | |||||
| 2025-08-14 | 13F | CoreCap Advisors, LLC | 12 081 | 7,02 | 648 | 15,10 | ||||
| 2025-07-25 | NP | BUFR - FT Cboe Vest Fund of Buffer ETFs This fund is a listed as child fund of First Trust Advisors Lp and if that institution has disclosed ownership in this security, then these positions will not be double counted when calculating total shares and total value | 10 573 738 | 1,98 | 550 045 | 1,85 | ||||
| 2025-07-16 | 13F | Novem Group | 14 690 | 4,26 | 788 | 12,25 | ||||
| 2025-08-14 | 13F | Modern Wealth Management, LLC | 7 500 | 403 | ||||||
| 2025-07-14 | 13F | Sowell Financial Services LLC | 33 720 | −13,68 | 1 810 | −7,14 | ||||
| 2025-07-30 | 13F | WESPAC Advisors SoCal, LLC | 4 806 | −29,39 | 258 | −24,19 | ||||
| 2025-08-12 | 13F | Jaffetilchin Investment Partners, LLC | 10 864 | 583 | ||||||
| 2025-08-14 | 13F | Mariner, LLC | 135 855 | −2,05 | 7 291 | 5,38 | ||||
| 2025-07-08 | 13F | Nbc Securities, Inc. | 4 966 | 1,22 | 0 | |||||
| 2025-08-13 | 13F | Grantvest Financial Group LLC | 11 829 | 18,73 | 635 | 27,57 | ||||
| 2025-07-14 | 13F | AdvisorNet Financial, Inc | 1 090 | −16,15 | 58 | −9,37 | ||||
| 2025-07-14 | 13F | Chris Bulman Inc | 4 439 | −0,89 | 238 | 6,73 | ||||
| 2025-08-06 | 13F | Valtinson Bruner Financial Planning LLC | 66 954 | −1,92 | 3 593 | 5,52 | ||||
| 2025-05-07 | 13F | Semus Wealth Partners LLC | 0 | −100,00 | 0 | |||||
| 2025-07-22 | 13F | Merit Financial Group, LLC | 4 809 | −32,96 | 258 | −27,73 | ||||
| 2025-08-11 | 13F | United Advisor Group, LLC | 8 255 | −1,29 | 443 | 6,24 | ||||
| 2025-08-12 | 13F | Ameritas Investment Partners, Inc. | 700 | 0,00 | 38 | 8,82 | ||||
| 2025-07-17 | 13F | Janney Montgomery Scott LLC | 27 295 | 1,09 | 1 | 0,00 | ||||
| 2025-08-14 | 13F/A | Rockefeller Capital Management L.P. | 25 307 | −16,42 | 1 358 | −10,07 | ||||
| 2025-07-24 | 13F | IFP Advisors, Inc | 11 096 | −9,44 | 596 | −2,62 | ||||
| 2025-08-15 | 13F | Captrust Financial Advisors | 60 593 | 7,88 | 3 252 | 16,06 | ||||
| 2025-07-22 | 13F | Foguth Wealth Management, LLC. | 221 547 | 88,95 | 11 890 | 103,28 | ||||
| 2025-07-28 | 13F | Holistic Planning, LLC | 7 262 | 7,70 | 390 | 15,77 | ||||
| 2025-08-04 | 13F | Assetmark, Inc | 171 555 | 32,14 | 9 207 | 42,17 | ||||
| 2025-05-16 | 13F | Laidlaw Wealth Management LLC | 0 | −100,00 | 0 | |||||
| 2025-07-18 | 13F | Truist Financial Corp | 31 793 | 3,87 | 1 706 | 11,80 | ||||
| 2025-08-08 | 13F | Citizens Financial Group Inc/ri | 26 263 | 1 410 | ||||||
| 2025-07-02 | 13F | HBW Advisory Services LLC | 6 572 | −10,39 | 353 | −3,56 | ||||
| 2025-08-08 | 13F | Avantax Advisory Services, Inc. | 0 | −100,00 | 0 | |||||
| 2025-08-12 | 13F | LPL Financial LLC | 184 914 | 7,18 | 9 924 | 15,30 | ||||
| 2025-07-15 | 13F | World Equity Group, Inc. | 0 | −100,00 | 0 | |||||
| 2025-07-10 | 13F | Focus Financial Network, Inc. | 4 178 | 0,00 | 224 | 7,69 | ||||
| 2025-08-06 | 13F | Founders Financial Securities Llc | 16 628 | 8,79 | 892 | 18,15 | ||||
| 2025-07-25 | NP | BUFG - FT Cboe Vest Buffered Allocation Growth ETF This fund is a listed as child fund of First Trust Advisors Lp and if that institution has disclosed ownership in this security, then these positions will not be double counted when calculating total shares and total value | 722 956 | 2,49 | 37 608 | 2,36 | ||||
| 2025-07-14 | 13F | Park Avenue Securities Llc | 4 663 | −7,04 | 0 | |||||
| 2025-07-29 | 13F | Swmg, Llc | 12 178 | 0,00 | 664 | 10,32 | ||||
| 2025-08-12 | 13F | NWF Advisory Services Inc. | 4 280 | −9,51 | 214 | −12,35 | ||||
| 2025-08-04 | 13F | Savvy Advisors, Inc. | 4 710 | 253 | ||||||
| 2025-08-12 | 13F | Leigh Baldwin & Co., Llc | 5 970 | −1,65 | 320 | 5,96 | ||||
| 2025-07-30 | 13F | TFB Advisors LLC | 15 590 | −5,15 | 837 | 1,95 | ||||
| 2025-07-14 | 13F | U.S. Capital Wealth Advisors, LLC | 34 158 | 6,09 | 1 833 | 14,13 | ||||
| 2025-08-04 | 13F | Family Wealth Group, LLC | 43 959 | 51,61 | 2 359 | 63,14 | ||||
| 2025-08-06 | 13F | Commonwealth Equity Services, Llc | 340 189 | −1,22 | 18 | 5,88 | ||||
| 2025-08-04 | 13F | Arkadios Wealth Advisors | 25 131 | 38,77 | 1 349 | 49,28 | ||||
| 2025-07-21 | 13F | Ameritas Advisory Services, LLC | 18 119 | −34,30 | 972 | −30,27 | ||||
| 2025-07-29 | 13F | Signature Estate & Investment Advisors Llc | 15 502 | 0,00 | 832 | 7,50 | ||||
| 2025-08-14 | 13F | Money Concepts Capital Corp | 6 424 | 0,00 | 345 | 7,50 | ||||
| 2025-07-25 | 13F | We Are One Seven, LLC | 16 967 | 176,61 | 911 | 197,39 | ||||
| 2025-08-14 | 13F | Horizon Investments, LLC | 16 628 | 16,30 | 892 | 25,11 | ||||
| 2025-08-14 | 13F | Sunbelt Securities, Inc. | 9 750 | 21,01 | 501 | 24,69 | ||||
| 2025-07-17 | 13F | Camelot Portfolios, LLC | 19 000 | −10,57 | 1 020 | −3,78 | ||||
| 2025-07-09 | 13F | Fragasso Group Inc. | 64 151 | −2,82 | 3 443 | 4,52 | ||||
| 2025-07-15 | 13F | Legacy Solutions, Llc | 10 698 | −2,80 | 574 | 4,55 | ||||
| 2025-08-12 | 13F | Insigneo Advisory Services, Llc | 0 | −100,00 | 0 | |||||
| 2025-08-11 | 13F | Blue Bell Private Wealth Management, Llc | 36 213 | −0,69 | 1 944 | 6,82 | ||||
| 2025-08-14 | 13F | Ausdal Financial Partners, Inc. | 6 840 | 3,17 | 367 | 11,21 | ||||
| 2025-07-31 | 13F | Hanlon Investment Management, Inc. | 0 | −100,00 | 0 | |||||
| 2025-08-05 | 13F | Prosperity Consulting Group, LLC | 20 651 | −10,24 | 1 108 | −3,40 | ||||
| 2025-08-07 | 13F | Kestra Private Wealth Services, Llc | 27 891 | 4,95 | 1 497 | 12,91 | ||||
| 2025-08-14 | 13F | Main Street Financial Solutions, LLC | 5 435 | −29,00 | 292 | −23,62 | ||||
| 2025-05-15 | 13F | Advisory Services Network, LLC | 0 | −100,00 | 0 | |||||
| 2025-08-14 | 13F | Gallagher Fiduciary Advisors, LLC | 0 | −100,00 | 0 | |||||
| 2025-08-01 | 13F | Envestnet Asset Management Inc | 265 451 | −51,48 | 14 247 | −47,81 | ||||
| 2025-08-14 | 13F | Financial Network Wealth Advisors LLC | 969 | 0,00 | 52 | 8,33 | ||||
| 2025-08-14 | 13F | Harvest Investment Services, LLC | 10 469 | 60,72 | 562 | 73,15 | ||||
| 2025-08-14 | 13F | Royal Bank Of Canada | 16 769 | 126,49 | 900 | 143,90 | ||||
| 2025-08-27 | 13F/A | Brinker Capital Investments, LLC | 4 108 | −34,69 | 220 | −29,71 | ||||
| 2025-07-15 | 13F | SJS Investment Consulting Inc. | 96 | 5 | ||||||
| 2025-08-12 | 13F | Jpmorgan Chase & Co | 63 | −95,94 | 3 | −96,10 | ||||
| 2025-08-13 | 13F | Legacy Capital Wealth Partners, LLC | 123 036 | 6 603 | ||||||
| 2025-07-22 | 13F | Echo Wealth Management, LLC | 7 652 | 6,04 | 411 | 13,89 | ||||
| 2025-08-12 | 13F | Steward Partners Investment Advisory, Llc | 45 649 | 20,13 | 2 450 | 29,23 | ||||
| 2025-08-05 | 13F | GPS Wealth Strategies Group, LLC | 1 495 | 0,00 | 80 | 8,11 | ||||
| 2025-08-01 | 13F | Transcend Wealth Collective, Llc | 7 280 | 37,36 | 391 | 47,73 | ||||
| 2025-08-06 | 13F | Maltin Wealth Management, Inc. | 5 524 | 0,00 | 296 | 7,64 | ||||
| 2025-05-14 | 13F | GDS Wealth Management | 0 | −100,00 | 0 | |||||
| 2025-08-14 | 13F | Ameriprise Financial Inc | 0 | −100,00 | 0 | |||||
| 2025-08-18 | 13F | N.E.W. Advisory Services LLC | 0 | −100,00 | 0 | |||||
| 2025-07-29 | 13F | Financial Guidance Group, Inc. | 71 859 | −3,85 | 3 857 | 3,43 | ||||
| 2025-07-09 | 13F | Central Valley Advisors, Llc | 8 088 | 2,61 | 434 | 10,43 | ||||
| 2025-07-28 | 13F | Mutual Advisors, LLC | 10 291 | 9,01 | 561 | 20,17 | ||||
| 2025-08-14 | 13F | Raymond James Financial Inc | 245 306 | −2,56 | 13 166 | 4,82 | ||||
| 2025-05-07 | 13F | First Heartland Consultants, Inc. | 0 | −100,00 | 0 | |||||
| 2025-07-23 | 13F | REAP Financial Group, LLC | 63 736 | −4,23 | 3 421 | 3,01 | ||||
| 2025-08-14 | 13F | Icon Wealth Advisors, LLC | 4 489 | −35,56 | 241 | −30,84 | ||||
| 2025-07-28 | 13F | Harbour Investments, Inc. | 47 131 | −5,86 | 2 530 | 1,28 | ||||
| 2025-08-08 | 13F/A | Ignite Planners, LLC | 4 520 | 244 | ||||||
| 2025-07-10 | 13F | Wealth Enhancement Advisory Services, Llc | 61 643 | 15,57 | 3 323 | 24,89 | ||||
| 2025-08-04 | 13F | Atria Investments Llc | 115 926 | −21,80 | 6 222 | −15,89 | ||||
| 2025-08-05 | 13F | Sigma Planning Corp | 7 764 | 4,98 | 417 | 13,04 | ||||
| 2025-07-10 | 13F | Signal Advisors Wealth, LLC | 226 891 | 86,18 | 12 177 | 100,31 | ||||
| 2025-08-14 | 13F | Murphy & Mullick Capital Management Corp | 1 600 | 0,00 | 86 | 7,59 | ||||
| 2025-07-25 | 13F | NorthRock Partners, LLC | 1 400 | 0,00 | 75 | 8,70 | ||||
| 2025-04-14 | 13F | Black Point Wealth Management | 0 | −100,00 | 0 | −100,00 | ||||
| 2025-04-25 | 13F | New Wave Wealth Advisors Llc | 0 | −100,00 | 0 | |||||
| 2025-07-15 | 13F | Armis Advisers, LLC | 57 656 | −3,72 | 3 094 | 3,58 | ||||
| 2025-07-24 | 13F | McKinley Carter Wealth Services, Inc. | 27 673 | 3,51 | 1 485 | 11,40 | ||||
| 2025-05-15 | 13F | Hrt Financial Lp | 0 | −100,00 | 0 | |||||
| 2025-07-29 | 13F | Stephens Inc /ar/ | 113 560 | −0,15 | 6 095 | 7,40 | ||||
| 2025-07-23 | 13F | Avantra Family Wealth, Inc. | 93 083 | 4 996 | ||||||
| 2025-08-14 | 13F | GWM Advisors LLC | 19 677 | −0,86 | 1 056 | 6,67 | ||||
| 2025-07-21 | 13F | DHJJ Financial Advisors, Ltd. | 12 289 | 12,40 | 660 | 20,92 |