Grundläggande statistik
| Institutionella ägare | 101 total, 101 long only, 0 short only, 0 long/short - change of 1,00% MRQ |
| Genomsnittlig portföljallokering | 0.0575 % - change of −0,04% MRQ |
| Institutionella aktier (lång) | 12 400 149 (ex 13D/G) - change of −0,54MM shares −4,18% MRQ |
| Institutionellt värde (lång) | $ 285 523 USD ($1000) |
Institutionellt ägande och aktieägare
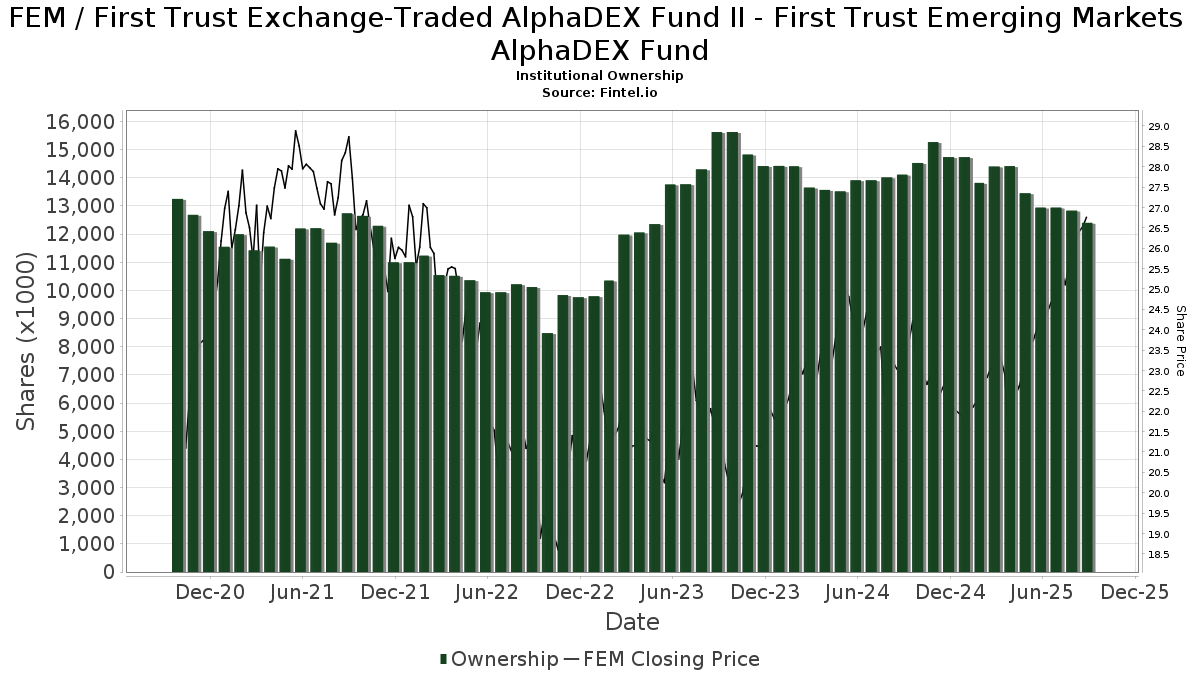
First Trust Exchange-Traded AlphaDEX Fund II - First Trust Emerging Markets AlphaDEX Fund (US:FEM) har 101 Institutionella ägare och aktieägare som har lämnat in 13D/G- eller 13F-formulär till Securities Exchange Commission (SEC). Dessa institut innehar totalt 12,400,149 aktier. Största aktieägare inkluderar Morgan Stanley, LPL Financial LLC, Bank Of America Corp /de/, Royal Bank Of Canada, Wells Fargo & Company/mn, Empirical Financial Services, LLC d.b.a. Empirical Wealth Management, Envestnet Asset Management Inc, UBS Group AG, Cambridge Investment Research Advisors, Inc., and Raymond James Financial Inc .
First Trust Exchange-Traded AlphaDEX Fund II - First Trust Emerging Markets AlphaDEX Fund (NasdaqGM:FEM) Institutionell ägarstruktur visar institutioners och fonders nuvarande positioner i företaget, samt de senaste förändringarna i positionernas storlek. Större aktieägare kan vara enskilda investerare, fonder, hedgefonder eller institutioner. Bilaga 13D visar att investeraren äger (eller ägde) mer än 5% av företaget och avser (eller avsåg) att aktivt eftersträva en förändring av affärsstrategin. Schedule 13G indikerar en passiv investering på över 5%.
The share price as of September 12, 2025 is 27,06 / share. Previously, on September 16, 2024, the share price was 22,59 / share. This represents an increase of 19,81% over that period.
Fondsentimentets poäng
Fondsentimentet poängen(fka Ägarackumulation-poäng) visar vilka aktier som är mest köpta av fonder. Det är resultatet av en sofistikerad kvantitativ flerfaktormodell som identifierar företag med de högsta nivåerna av institutionell ackumulering. Poängsättningsmodellen använder en kombination av den totala ökningen av redovisade ägare, förändringarna i portföljallokeringarna för dessa ägare och andra mått. Siffran sträcker sig från 0 till 100, där högre siffror indikerar en högre nivå av ackumulering i förhållande till sina konkurrenter, och 50 är genomsnittet.
Uppdateringsfrekvens: Dagligen
Se Ownership Explorer, som innehåller en lista över de högst rankade företagen.
Institutionell sälj/köp-kvot
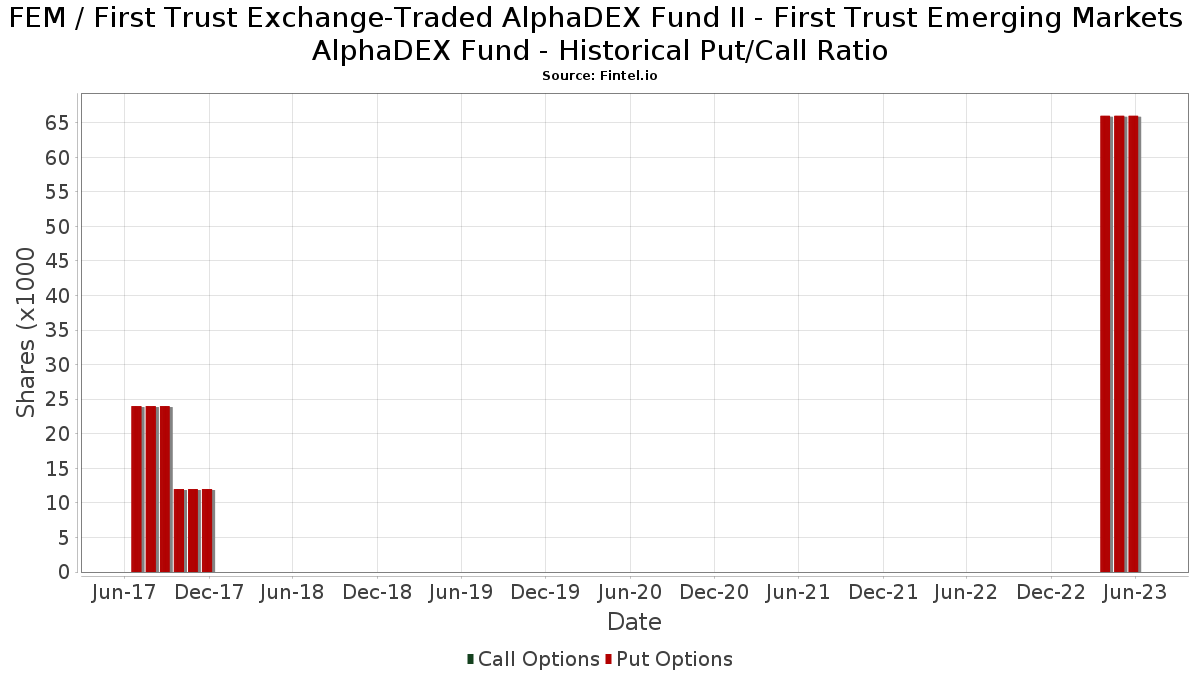
Förutom att rapportera vanliga eget kapital- och skuldemissioner måste institutioner med mer än 100MM tillgångar under förvaltning också avslöja sina innehav av sälj- och köpoptioner. Eftersom säljoptioner i allmänhet indikerar ett negativt sentiment och köpoptioner indikerar ett positivt sentiment, kan vi få en uppfattning om det övergripande institutionella sentimentet genom att plotta förhållandet mellan säljoptioner och köpoptioner. Diagrammet till höger visar det historiska förhållandet mellan sälj- och köpoptioner för detta instrument.
Genom att använda sälj/köp-kvoten som en indikator på aktieägarnas sentiment undviker man en av de största bristerna med att använda det totala institutionella ägandet, nämligen att en betydande del av de förvaltade tillgångarna investeras passivt för att följa index. Passivt förvaltade fonder köper vanligtvis inte optioner, så indikatorn för sälj/köp-kvoten ger en bättre bild av stämningen i aktivt förvaltade fonder.
13F- och NPORT-arkiveringar
Detaljer om 13F-arkiveringar är gratis. Detaljer om NP-arkiveringar kräver ett premiummedlemskap. Gröna rader indikerar nya positioner. Röda rader indikerar stängda positioner. Klicka på länk symbolen för att se hela transaktionshistoriken.
Uppgradera
för att låsa upp premiumdata och exportera till Excel ![]() .
.
| Fil Datum | Källa | Investerare | Typ | Genomsnittligt pris (beräknat) |
Aktier | Δ Aktier (%) |
Rapporterat värde (1000 USD) |
Δ Värde (%) |
Portföljallokering (%) |
|
|---|---|---|---|---|---|---|---|---|---|---|
| 2025-07-23 | 13F | Meitav Dash Investments Ltd | 8 893 | 0,00 | 218 | 7,39 | ||||
| 2025-08-12 | 13F | Richmond Investment Services, LLC | 21 940 | 100,42 | 539 | 115,20 | ||||
| 2025-08-27 | 13F/A | Brinker Capital Investments, LLC | 35 940 | −4,60 | 883 | 2,44 | ||||
| 2025-07-08 | 13F | Nbc Securities, Inc. | 2 438 | −53,75 | 0 | |||||
| 2025-08-08 | 13F | Avantax Advisory Services, Inc. | 58 165 | −3,82 | 1 429 | 3,33 | ||||
| 2025-08-01 | 13F | Rossby Financial, LCC | 1 670 | 0,12 | 41 | 10,81 | ||||
| 2025-08-14 | 13F | Bank Of America Corp /de/ | 1 054 665 | 2,85 | 25 903 | 10,50 | ||||
| 2025-08-08 | 13F | Flaharty Asset Management, LLC | 155 | 4 | ||||||
| 2025-08-15 | 13F | Morgan Stanley | 2 322 153 | 0,06 | 57 032 | 7,51 | ||||
| 2025-08-11 | 13F | Principal Securities, Inc. | 59 360 | 5,16 | 1 458 | 17,22 | ||||
| 2025-08-12 | 13F | Global Retirement Partners, LLC | 7 272 | 1,91 | 179 | 13,38 | ||||
| 2025-04-10 | 13F | TrueWealth Advisors, LLC | 0 | −100,00 | 0 | −100,00 | ||||
| 2025-08-11 | 13F | Citigroup Inc | 500 | 0,00 | 12 | 9,09 | ||||
| 2025-05-16 | 13F/A | Kestra Investment Management, LLC | 0 | −100,00 | 0 | |||||
| 2025-08-05 | 13F | Sebold Capital Management, Inc. | 15 582 | −15,79 | 383 | −9,48 | ||||
| 2025-07-03 | 13F | Higgins & Schmidt Wealth Strategies LLC | 14 382 | 0,00 | 353 | 7,62 | ||||
| 2025-07-22 | 13F | Luken Investment Analytics, LLC | 0 | −100,00 | 0 | |||||
| 2025-07-24 | 13F | Trust Co Of Toledo Na /oh/ | 683 | 17 | ||||||
| 2025-08-12 | 13F | LPL Financial LLC | 1 113 499 | 3,02 | 27 348 | 10,69 | ||||
| 2025-08-06 | 13F | Commonwealth Equity Services, Llc | 53 695 | −1,73 | 1 | 0,00 | ||||
| 2025-05-08 | 13F | Great Valley Advisor Group, Inc. | 0 | −100,00 | 0 | −100,00 | ||||
| 2025-07-21 | 13F | Empirical Financial Services, LLC d.b.a. Empirical Wealth Management | 606 409 | 5,78 | 14 893 | 13,65 | ||||
| 2025-05-12 | 13F | Virtu Financial LLC | 0 | −100,00 | 0 | |||||
| 2025-08-04 | 13F | Spire Wealth Management | 2 369 | 1,33 | 58 | 9,43 | ||||
| 2025-08-08 | 13F | Kingsview Wealth Management, LLC | 128 312 | −3,39 | 3 151 | 3,82 | ||||
| 2025-08-14 | 13F | Snowden Capital Advisors LLC | 39 075 | −0,36 | 960 | 7,03 | ||||
| 2025-08-13 | 13F/A | StoneX Group Inc. | 0 | −100,00 | 0 | −100,00 | ||||
| 2025-08-13 | 13F | Northwestern Mutual Wealth Management Co | 6 732 | −6,85 | 165 | 0,00 | ||||
| 2025-08-14 | 13F | Old Mission Capital Llc | 130 135 | −67,03 | 3 196 | −64,58 | ||||
| 2025-08-14 | 13F | Mariner, LLC | 9 073 | 0,00 | 223 | 7,25 | ||||
| 2025-08-04 | 13F | Assetmark, Inc | 214 673 | 19,55 | 5 272 | 28,46 | ||||
| 2025-08-14 | 13F | Raymond James Financial Inc | 374 921 | 32,81 | 9 208 | 42,69 | ||||
| 2025-08-14 | 13F | Comerica Bank | 28 169 | 1,54 | 692 | 8,99 | ||||
| 2025-08-08 | 13F | Larson Financial Group LLC | 1 339 | −31,16 | 33 | −27,27 | ||||
| 2025-04-09 | 13F | HBW Advisory Services LLC | 0 | −100,00 | 0 | −100,00 | ||||
| 2025-07-17 | 13F | Janney Montgomery Scott LLC | 58 254 | 7,75 | 1 | 0,00 | ||||
| 2025-08-14 | 13F | Wells Fargo & Company/mn | 883 962 | −12,63 | 21 710 | −6,13 | ||||
| 2025-07-25 | 13F | Cwm, Llc | 115 325 | 147,22 | 3 | 100,00 | ||||
| 2025-07-24 | 13F | IFP Advisors, Inc | 49 288 | 4,11 | 1 211 | 11,83 | ||||
| 2025-05-02 | 13F | Capital A Wealth Management, LLC | 0 | −100,00 | 0 | |||||
| 2025-07-16 | 13F | Formidable Asset Management, LLC | 18 943 | 0,00 | 433 | 0,00 | ||||
| 2025-07-14 | 13F | ABLE Financial Group, LLC | 9 091 | −0,68 | 223 | 6,70 | ||||
| 2025-07-21 | 13F | Ameritas Advisory Services, LLC | 4 679 | 115 | ||||||
| 2025-08-07 | 13F | Rathbone Brothers plc | 40 522 | 17,95 | 995 | 26,75 | ||||
| 2025-08-13 | 13F | Capital Analysts, Inc. | 1 514 | 61,93 | 0 | |||||
| 2025-08-06 | 13F | Prospera Financial Services Inc | 66 435 | −0,65 | 1 632 | 6,74 | ||||
| 2025-05-15 | 13F | Baird Financial Group, Inc. | 0 | −100,00 | 0 | |||||
| 2025-08-14 | 13F | Jane Street Group, Llc | 65 151 | −35,14 | 1 600 | −30,31 | ||||
| 2025-08-01 | 13F | Envestnet Asset Management Inc | 555 408 | −1,16 | 13 641 | 6,19 | ||||
| 2025-08-13 | 13F | Jones Financial Companies Lllp | 13 697 | 47,14 | 333 | 55,87 | ||||
| 2025-08-05 | 13F | Bank of New York Mellon Corp | 275 398 | 0,68 | 6 764 | 8,17 | ||||
| 2025-07-14 | 13F | Park Avenue Securities Llc | 38 714 | 1 | ||||||
| 2025-08-13 | 13F | Transce3nd, LLC | 169 | −22,12 | 4 | 0,00 | ||||
| 2025-04-28 | 13F | Private Trust Co Na | 0 | −100,00 | 0 | |||||
| 2025-08-13 | 13F | Twin Peaks Wealth Advisors, LLC | 235 | 6 | ||||||
| 2025-05-15 | 13F/A | Orion Portfolio Solutions, LLC | 37 671 | −1,11 | 861 | 2,62 | ||||
| 2025-07-23 | 13F | Trueblood Wealth Management, LLC | 13 166 | −0,49 | 323 | 6,95 | ||||
| 2025-07-28 | 13F | Harbour Investments, Inc. | 11 994 | 6,04 | 295 | 13,95 | ||||
| 2025-05-13 | 13F | EverSource Wealth Advisors, LLC | 0 | −100,00 | 0 | |||||
| 2025-08-11 | 13F | NewEdge Wealth, LLC | 22 245 | −2,66 | 571 | 9,39 | ||||
| 2025-08-14 | 13F | Sunbelt Securities, Inc. | 258 | −0,39 | 6 | 0,00 | ||||
| 2025-09-04 | 13F/A | Advisor Group Holdings, Inc. | 85 219 | 10,75 | 2 080 | 18,19 | ||||
| 2025-08-04 | 13F | Atria Investments Llc | 92 004 | 26,49 | 2 260 | 35,92 | ||||
| 2025-07-07 | 13F | Thurston, Springer, Miller, Herd & Titak, Inc. | 2 059 | 51 | ||||||
| 2025-08-06 | 13F | AE Wealth Management LLC | 62 581 | −17,63 | 1 537 | −11,52 | ||||
| 2025-08-13 | 13F | First Trust Advisors Lp | 29 034 | −1,84 | 713 | 5,47 | ||||
| 2025-08-26 | NP | FIRST TRUST VARIABLE INSURANCE TRUST - First Trust Dorsey Wright Tactical Core Portfolio Class I This fund is a listed as child fund of First Trust Advisors Lp and if that institution has disclosed ownership in this security, then these positions will not be double counted when calculating total shares and total value | 27 482 | −2,06 | 675 | 5,15 | ||||
| 2025-07-11 | 13F | Farther Finance Advisors, LLC | 35 031 | 0,58 | 860 | 7,50 | ||||
| 2025-04-23 | 13F | Oppenheimer & Co Inc | 0 | −100,00 | 0 | |||||
| 2025-07-17 | 13F | City Holding Co | 1 450 | 0,00 | 36 | 6,06 | ||||
| 2025-08-14 | 13F | Mpwm Advisory Solutions, Llc | 5 716 | 140 | ||||||
| 2025-08-18 | 13F | Geneos Wealth Management Inc. | 1 930 | 26,81 | 47 | 38,24 | ||||
| 2025-08-11 | 13F | HighTower Advisors, LLC | 25 178 | −8,87 | 618 | −2,06 | ||||
| 2025-07-15 | 13F | World Equity Group, Inc. | 40 410 | 992 | ||||||
| 2025-08-14 | 13F | Integrated Wealth Concepts LLC | 25 862 | −11,09 | 635 | −4,37 | ||||
| 2025-08-12 | 13F | Jpmorgan Chase & Co | 21 | −79,81 | 1 | −100,00 | ||||
| 2025-08-14 | 13F | Pinnacle Family Advisors, LLC | 10 242 | 2,16 | 251 | 9,61 | ||||
| 2025-07-23 | 13F | Element Wealth, LLC | 8 910 | −0,09 | 219 | 7,39 | ||||
| 2025-07-25 | 13F | Atria Wealth Solutions, Inc. | 0 | −100,00 | 0 | |||||
| 2025-08-12 | 13F | Steward Partners Investment Advisory, Llc | 41 931 | 0,04 | 1 030 | 7,41 | ||||
| 2025-08-08 | 13F | MTM Investment Management, LLC | 540 | 13 | ||||||
| 2025-07-29 | 13F | Signature Estate & Investment Advisors Llc | 13 624 | −16,11 | 335 | −9,97 | ||||
| 2025-05-14 | 13F | Legend Financial Advisors, Inc. | 0 | −100,00 | 0 | |||||
| 2025-08-14 | 13F | UBS Group AG | 527 030 | −14,67 | 12 944 | −8,32 | ||||
| 2025-08-14 | 13F | Benjamin Edwards Inc | 63 643 | 19,50 | 1 563 | 28,43 | ||||
| 2025-08-14 | 13F | GWM Advisors LLC | 0 | −100,00 | 0 | |||||
| 2025-07-15 | 13F | Traction Financial Partners, LLC | 9 208 | 226 | ||||||
| 2025-08-11 | 13F | Private Advisor Group, LLC | 182 070 | −2,37 | 4 472 | 4,88 | ||||
| 2025-08-05 | 13F | Dunhill Financial, LLC | 120 | 0,00 | 3 | 0,00 | ||||
| 2025-07-18 | 13F | Midwest Financial Group LLC | 91 546 | −3,66 | 2 248 | 3,50 | ||||
| 2025-08-12 | 13F | Proequities, Inc. | 0 | 0 | ||||||
| 2025-07-16 | 13F | American National Bank | 136 | 0,00 | 3 | 0,00 | ||||
| 2025-07-24 | 13F | Cyndeo Wealth Partners, LLC | 10 343 | 0,00 | 254 | 7,63 | ||||
| 2025-08-14 | 13F | Susquehanna International Group, Llp | 24 987 | −6,56 | 614 | 0,33 | ||||
| 2025-07-24 | 13F | Us Bancorp \de\ | 782 | 19 | ||||||
| 2025-08-14 | 13F | State Of Wisconsin Investment Board | 313 808 | 0,00 | 7 707 | 7,44 | ||||
| 2025-08-15 | 13F | Kestra Advisory Services, LLC | 39 731 | 4,62 | 976 | 12,33 | ||||
| 2025-08-07 | 13F | PFG Advisors | 13 922 | −36,46 | 342 | −31,80 | ||||
| 2025-08-12 | 13F | OneAscent Financial Services LLC | 40 288 | 4,06 | 1 | |||||
| 2025-07-25 | 13F | Envestnet Portfolio Solutions, Inc. | 14 091 | −61,88 | 346 | −59,00 | ||||
| 2025-07-30 | 13F | D.a. Davidson & Co. | 31 317 | −2,78 | 769 | 4,48 | ||||
| 2025-08-14 | 13F | Aprio Wealth Management, LLC | 31 100 | 0,00 | 764 | 7,46 | ||||
| 2025-08-14 | 13F | Mml Investors Services, Llc | 25 992 | −33,34 | 1 | |||||
| 2025-07-15 | 13F | FLP Wealth Management, LLC | 0 | −100,00 | 0 | |||||
| 2025-04-16 | 13F/A | Western Wealth Management, LLC | 0 | −100,00 | 0 | |||||
| 2025-08-05 | 13F | EPG Wealth Management LLC | 0 | −100,00 | 0 | |||||
| 2025-07-31 | 13F | Cambridge Investment Research Advisors, Inc. | 422 559 | 117,13 | 10 | 150,00 | ||||
| 2025-05-15 | 13F | Citadel Advisors Llc | 0 | −100,00 | 0 | |||||
| 2025-08-08 | 13F | Rockefeller Capital Management L.P. | 0 | −100,00 | 0 | |||||
| 2025-08-11 | 13F | Tidemark, LLC | 1 131 | −13,86 | 28 | −10,00 | ||||
| 2025-08-14 | 13F | Royal Bank Of Canada | 1 003 521 | −4,20 | 24 646 | 2,92 | ||||
| 2025-07-28 | 13F | RFG Advisory, LLC | 10 518 | −1,17 | 258 | 6,17 | ||||
| 2025-07-29 | 13F | Chicago Partners Investment Group LLC | 38 248 | 0,65 | 974 | 11,84 | ||||
| 2025-04-23 | 13F | Golden State Equity Partners | 0 | −100,00 | 0 | |||||
| 2025-07-14 | 13F | GAMMA Investing LLC | 2 883 | −25,92 | 71 | −20,45 | ||||
| 2025-08-08 | 13F | Cetera Investment Advisers | 251 955 | −3,19 | 6 188 | 4,00 | ||||
| 2025-08-20 | 13F/A | Coppell Advisory Solutions LLC | 39 594 | −36,28 | 962 | −31,48 | ||||
| 2025-07-14 | 13F | Iams Wealth Management, Llc | 29 042 | 0,14 | 713 | 7,70 | ||||
| 2025-08-11 | 13F | Synergy Investment Management, LLC | 0 | −100,00 | 0 | |||||
| 2025-08-14 | 13F | Stifel Financial Corp | 42 162 | −4,05 | 1 035 | 3,09 | ||||
| 2025-05-15 | 13F | Tower Research Capital LLC (TRC) | 0 | −100,00 | 0 | |||||
| 2025-08-14 | 13F | LaSalle St. Investment Advisors, LLC | 12 027 | 5,96 | 0 | |||||
| 2025-08-12 | 13F | Clearwater Capital Advisors, LLC | 0 | −100,00 | 0 | |||||
| 2025-08-14 | 13F | Fmr Llc | 348 | 270,21 | 9 | 300,00 | ||||
| 2025-08-13 | 13F | Gateway Wealth Partners, LLC | 40 034 | −3,23 | 983 | 4,02 | ||||
| 2025-08-15 | 13F | Fsb Premier Wealth Management, Inc. | 9 953 | 4,92 | 244 | 12,96 |
Other Listings
| MX:FEM |