Grundläggande statistik
| Institutionella ägare | 93 total, 92 long only, 0 short only, 1 long/short - change of −2,08% MRQ |
| Genomsnittlig portföljallokering | 0.0716 % - change of −11,13% MRQ |
| Institutionella aktier (lång) | 6 196 260 (ex 13D/G) - change of −0,37MM shares −5,68% MRQ |
| Institutionellt värde (lång) | $ 519 658 USD ($1000) |
Institutionellt ägande och aktieägare
Invesco Exchange-Traded Fund Trust II - Invesco Dorsey Wright SmallCap Momentum ETF (US:DWAS) har 93 Institutionella ägare och aktieägare som har lämnat in 13D/G- eller 13F-formulär till Securities Exchange Commission (SEC). Dessa institut innehar totalt 6,196,260 aktier. Största aktieägare inkluderar Wealth Enhancement Advisory Services, Llc, Morgan Stanley, Bank Of America Corp /de/, LPL Financial LLC, Bank Of America Corp /de/, Royal Bank Of Canada, UBS Group AG, Wells Fargo & Company/mn, Raymond James Financial Inc, and Goldman Sachs Group Inc .
Invesco Exchange-Traded Fund Trust II - Invesco Dorsey Wright SmallCap Momentum ETF (NasdaqGM:DWAS) Institutionell ägarstruktur visar institutioners och fonders nuvarande positioner i företaget, samt de senaste förändringarna i positionernas storlek. Större aktieägare kan vara enskilda investerare, fonder, hedgefonder eller institutioner. Bilaga 13D visar att investeraren äger (eller ägde) mer än 5% av företaget och avser (eller avsåg) att aktivt eftersträva en förändring av affärsstrategin. Schedule 13G indikerar en passiv investering på över 5%.
The share price as of September 12, 2025 is 90,03 / share. Previously, on September 16, 2024, the share price was 90,90 / share. This represents a decline of 0,95% over that period.

Fondsentimentets poäng
Fondsentimentet poängen(fka Ägarackumulation-poäng) visar vilka aktier som är mest köpta av fonder. Det är resultatet av en sofistikerad kvantitativ flerfaktormodell som identifierar företag med de högsta nivåerna av institutionell ackumulering. Poängsättningsmodellen använder en kombination av den totala ökningen av redovisade ägare, förändringarna i portföljallokeringarna för dessa ägare och andra mått. Siffran sträcker sig från 0 till 100, där högre siffror indikerar en högre nivå av ackumulering i förhållande till sina konkurrenter, och 50 är genomsnittet.
Uppdateringsfrekvens: Dagligen
Se Ownership Explorer, som innehåller en lista över de högst rankade företagen.
Institutionell sälj/köp-kvot
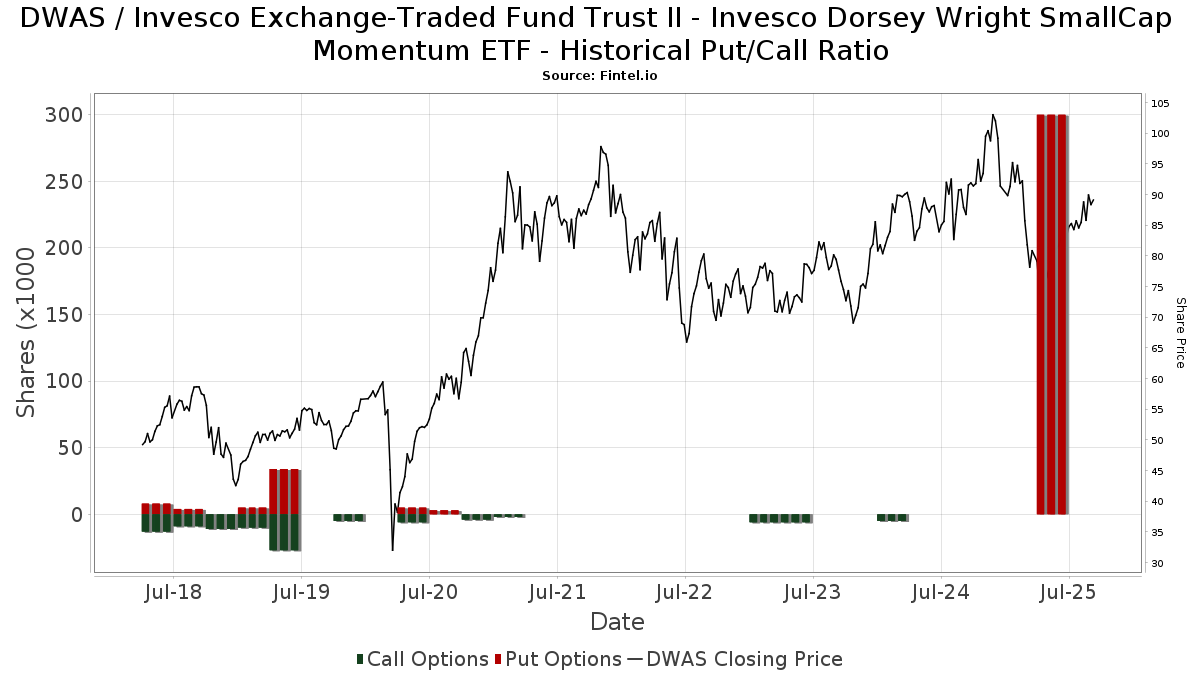
Förutom att rapportera vanliga eget kapital- och skuldemissioner måste institutioner med mer än 100MM tillgångar under förvaltning också avslöja sina innehav av sälj- och köpoptioner. Eftersom säljoptioner i allmänhet indikerar ett negativt sentiment och köpoptioner indikerar ett positivt sentiment, kan vi få en uppfattning om det övergripande institutionella sentimentet genom att plotta förhållandet mellan säljoptioner och köpoptioner. Diagrammet till höger visar det historiska förhållandet mellan sälj- och köpoptioner för detta instrument.
Genom att använda sälj/köp-kvoten som en indikator på aktieägarnas sentiment undviker man en av de största bristerna med att använda det totala institutionella ägandet, nämligen att en betydande del av de förvaltade tillgångarna investeras passivt för att följa index. Passivt förvaltade fonder köper vanligtvis inte optioner, så indikatorn för sälj/köp-kvoten ger en bättre bild av stämningen i aktivt förvaltade fonder.
13F- och NPORT-arkiveringar
Detaljer om 13F-arkiveringar är gratis. Detaljer om NP-arkiveringar kräver ett premiummedlemskap. Gröna rader indikerar nya positioner. Röda rader indikerar stängda positioner. Klicka på länk symbolen för att se hela transaktionshistoriken.
Uppgradera
för att låsa upp premiumdata och exportera till Excel ![]() .
.
| Fil Datum | Källa | Investerare | Typ | Genomsnittligt pris (beräknat) |
Aktier | Δ Aktier (%) |
Rapporterat värde (1000 USD) |
Δ Värde (%) |
Portföljallokering (%) |
|
|---|---|---|---|---|---|---|---|---|---|---|
| 2025-04-21 | 13F | Nelson, Van Denburg & Campbell Wealth Management Group, LLC | 0 | −100,00 | 0 | |||||
| 2025-07-17 | 13F | Janney Montgomery Scott LLC | 25 932 | −4,71 | 2 | 0,00 | ||||
| 2025-07-22 | 13F | Belpointe Asset Management LLC | 2 411 | 205 | ||||||
| 2025-08-14 | 13F | Mercer Global Advisors Inc /adv | 3 728 | −16,19 | 316 | −8,67 | ||||
| 2025-04-23 | 13F | Pinnacle Bancorp, Inc. | 0 | −100,00 | 0 | |||||
| 2025-08-13 | 13F | Flow Traders U.s. Llc | 3 706 | −26,90 | 0 | |||||
| 2025-05-14 | 13F | Kestra Advisory Services, LLC | 0 | −100,00 | 0 | |||||
| 2025-08-12 | 13F | Global Retirement Partners, LLC | 37 | 0,00 | 3 | 0,00 | ||||
| 2025-08-14 | 13F | Goldman Sachs Group Inc | 91 386 | 89,87 | 7 755 | 106,63 | ||||
| 2025-08-06 | 13F | Prospera Financial Services Inc | 32 015 | 11,22 | 2 717 | 21,08 | ||||
| 2025-08-14 | 13F | IHT Wealth Management, LLC | 4 680 | −65,97 | 397 | −62,97 | ||||
| 2025-05-12 | 13F | Independent Advisor Alliance | 0 | −100,00 | 0 | |||||
| 2025-08-14 | 13F | Aqr Capital Management Llc | 5 655 | 53,04 | 480 | 66,32 | ||||
| 2025-07-16 | 13F | Register Financial Advisors LLC | 0 | −100,00 | 0 | |||||
| 2025-04-15 | 13F | Simplicity Wealth,LLC | 0 | −100,00 | 0 | |||||
| 2025-07-10 | 13F | Wealth Enhancement Advisory Services, Llc | 4 154 304 | −1,16 | 357 353 | 9,03 | ||||
| 2025-08-12 | 13F | BlackRock, Inc. | 3 024 | −10,05 | 257 | −2,29 | ||||
| 2025-08-15 | 13F | Tower Research Capital LLC (TRC) | 0 | −100,00 | 0 | |||||
| 2025-08-08 | 13F | MTM Investment Management, LLC | 2 329 | 0,00 | 198 | 9,44 | ||||
| 2025-08-14 | 13F | UBS Group AG | 141 263 | 25,05 | 11 988 | 36,08 | ||||
| 2025-08-14 | 13F | Mml Investors Services, Llc | 12 137 | −18,84 | 1 | 0,00 | ||||
| 2025-07-11 | 13F | Farther Finance Advisors, LLC | 16 702 | −9,09 | 1 417 | −0,63 | ||||
| 2025-08-19 | 13F | Newbridge Financial Services Group, Inc. | 430 | 0,00 | 36 | 9,09 | ||||
| 2025-08-04 | 13F | Assetmark, Inc | 221 | 8,33 | 19 | 20,00 | ||||
| 2025-07-28 | 13F | Harbour Investments, Inc. | 377 | −74,63 | 32 | −73,04 | ||||
| 2025-04-28 | 13F | Private Trust Co Na | 0 | −100,00 | 0 | |||||
| 2025-07-22 | 13F | Partners Wealth Management, Llc | 5 448 | −4,39 | 423 | −4,95 | ||||
| 2025-07-31 | 13F | LJI Wealth Management, LLC | 0 | −100,00 | 0 | |||||
| 2025-08-12 | 13F | Nemes Rush Group LLC | 5 392 | −36,30 | 458 | −30,76 | ||||
| 2025-08-06 | 13F | Centerpoint Advisory Group | 0 | −100,00 | 0 | |||||
| 2025-04-07 | 13F | AdvisorNet Financial, Inc | 0 | −100,00 | 0 | |||||
| 2025-07-30 | 13F | Family Capital Trust Co | 55 312 | 0,46 | 4 694 | 9,34 | ||||
| 2025-07-22 | 13F | Coastal Investment Advisors, Inc. | 200 | −89,22 | 17 | −88,89 | ||||
| 2025-08-14 | 13F | GWM Advisors LLC | 3 390 | −17,82 | 288 | −10,59 | ||||
| 2025-08-04 | 13F | Spire Wealth Management | 1 785 | −6,05 | 151 | 2,03 | ||||
| 2025-05-09 | 13F | Thoroughbred Financial Services, Llc | 0 | −100,00 | 0 | |||||
| 2025-07-22 | 13F | Strid Group, LLC | 4 007 | 0,02 | 340 | 8,65 | ||||
| 2025-07-31 | 13F | Oppenheimer & Co Inc | 16 784 | −18,10 | 1 424 | −10,89 | ||||
| 2025-08-18 | 13F/A | National Bank Of Canada /fi/ | 2 550 | 0,00 | 217 | 9,09 | ||||
| 2025-05-12 | 13F | Blueprint Investment Partners LLC | 0 | −100,00 | 0 | |||||
| 2025-08-04 | 13F | Atria Investments Llc | 21 321 | −51,27 | 1 809 | −46,97 | ||||
| 2025-08-14 | 13F/A | Barclays Plc | 300 | 0,00 | 0 | |||||
| 2025-05-12 | 13F | Founders Financial Alliance, LLC | 0 | −100,00 | 0 | −100,00 | ||||
| 2025-08-14 | 13F | Fwl Investment Management, Llc | 332 | 0,00 | 28 | 12,00 | ||||
| 2025-04-22 | 13F | Synergy Financial Management, LLC | 0 | −100,00 | 0 | |||||
| 2025-07-30 | 13F | Nottingham Advisors, Inc. | 13 149 | 0,00 | 1 116 | 8,78 | ||||
| 2025-07-22 | 13F | Red Tortoise LLC | 255 | 22 | ||||||
| 2025-07-24 | 13F | IFP Advisors, Inc | 3 436 | 28,74 | 292 | 39,90 | ||||
| 2025-08-14 | 13F | Great Valley Advisor Group, Inc. | 3 116 | 13,64 | 264 | 23,94 | ||||
| 2025-08-12 | 13F | Jpmorgan Chase & Co | 946 | 951,11 | 80 | 1 042,86 | ||||
| 2025-08-14 | 13F | Raymond James Financial Inc | 92 603 | −57,55 | 7 858 | −53,80 | ||||
| 2025-08-07 | 13F | Vise Technologies, Inc. | 43 258 | 28,07 | 3 671 | 19,04 | ||||
| 2025-08-14 | 13F | Citadel Advisors Llc | 4 022 | −68,12 | 341 | −65,31 | ||||
| 2025-08-13 | 13F | Scotia Capital Inc. | 3 557 | 0,00 | 302 | 8,66 | ||||
| 2025-08-12 | 13F | Steward Partners Investment Advisory, Llc | 2 579 | 0,00 | 219 | 8,46 | ||||
| 2025-08-14 | 13F | Snowden Capital Advisors LLC | 15 954 | −5,83 | 1 354 | 2,42 | ||||
| 2025-07-17 | 13F | Fifth Third Securities, Inc. | 0 | −100,00 | 0 | |||||
| 2025-08-14 | 13F | Wells Fargo & Company/mn | 135 511 | −32,47 | 11 500 | −26,52 | ||||
| 2025-08-01 | 13F | Bessemer Group Inc | 432 | 0 | ||||||
| 2025-07-09 | 13F | Dynamic Advisor Solutions LLC | 0 | −100,00 | 0 | |||||
| 2025-07-10 | 13F | Kmg Fiduciary Partners, Llc | 26 650 | 13,18 | 2 262 | 23,15 | ||||
| 2025-08-14 | 13F | Bank Of America Corp /de/ | Put | 300 000 | 25 458 | |||||
| 2025-08-01 | 13F | Envestnet Asset Management Inc | 15 004 | −21,43 | 1 273 | −14,51 | ||||
| 2025-07-10 | 13F | NorthCrest Asset Manangement, LLC | 15 044 | 29,96 | 1 294 | 43,46 | ||||
| 2025-07-15 | 13F | Financial Partners Group, Inc | 7 474 | −0,01 | 634 | 8,93 | ||||
| 2025-07-24 | 13F | Capital Advisors, Ltd. LLC | 0 | −100,00 | 0 | |||||
| 2025-08-13 | 13F | Jones Financial Companies Lllp | 476 | 32,59 | 40 | 48,15 | ||||
| 2025-08-14 | 13F | Bank Of America Corp /de/ | 144 875 | −1,19 | 12 294 | 7,53 | ||||
| 2025-08-14 | 13F | Mariner, LLC | 2 427 | 206 | ||||||
| 2025-04-25 | 13F | Kendall Capital Management | 0 | −100,00 | 0 | |||||
| 2025-08-14 | 13F | EP Wealth Advisors, Inc. | 9 223 | 0,00 | 783 | 8,76 | ||||
| 2025-07-24 | 13F | Ronald Blue Trust, Inc. | 0 | −100,00 | 0 | |||||
| 2025-07-25 | 13F | LRI Investments, LLC | 200 | 0,00 | 17 | 6,67 | ||||
| 2025-08-14 | 13F | Stifel Financial Corp | 22 227 | −4,33 | 1 886 | 4,14 | ||||
| 2025-04-23 | 13F | GHP Investment Advisors, Inc. | 0 | −100,00 | 0 | |||||
| 2025-08-08 | 13F | Pnc Financial Services Group, Inc. | 50 | −72,38 | 4 | −71,43 | ||||
| 2025-07-23 | 13F | Trueblood Wealth Management, LLC | 9 432 | 0,01 | 800 | 8,84 | ||||
| 2025-08-14 | 13F | Ameriprise Financial Inc | 3 520 | −0,40 | 299 | 8,36 | ||||
| 2025-07-25 | 13F | Cwm, Llc | 8 552 | −68,20 | 1 | −100,00 | ||||
| 2025-08-11 | 13F | Citigroup Inc | 66 | 0,00 | 6 | 0,00 | ||||
| 2025-08-14 | 13F | Old Mission Capital Llc | 3 321 | 47 342,86 | 282 | |||||
| 2025-08-08 | 13F | Gts Securities Llc | 4 336 | 368 | ||||||
| 2025-08-11 | 13F | Principal Securities, Inc. | 23 | 2 | ||||||
| 2025-08-14 | 13F | CoreCap Advisors, LLC | 1 123 | 0,18 | 95 | 9,20 | ||||
| 2025-08-05 | 13F | Key FInancial Inc | 108 | 0,00 | 9 | 12,50 | ||||
| 2025-08-11 | 13F | Nations Financial Group Inc, /ia/ /adv | 2 487 | −11,71 | 211 | −3,65 | ||||
| 2025-08-14 | 13F | Susquehanna International Group, Llp | 9 456 | −42,63 | 802 | −37,59 | ||||
| 2025-07-21 | 13F | Monticello Wealth Management, Llc | 15 730 | −3,08 | 1 335 | 5,45 | ||||
| 2025-08-14 | 13F | Royal Bank Of Canada | 141 663 | −22,46 | 12 021 | −15,62 | ||||
| 2025-07-29 | 13F | Stratos Wealth Partners, LTD. | 3 938 | −2,14 | 334 | 6,71 | ||||
| 2025-07-31 | 13F | Cambridge Investment Research Advisors, Inc. | 63 415 | −1,01 | 5 | 25,00 | ||||
| 2025-08-18 | 13F | Geneos Wealth Management Inc. | 8 388 | 1,62 | 712 | 10,58 | ||||
| 2025-08-14 | 13F | Jane Street Group, Llc | 0 | −100,00 | 0 | |||||
| 2025-08-14 | 13F | Comerica Bank | 115 | −12,21 | 10 | −10,00 | ||||
| 2025-08-11 | 13F | Pineridge Advisors LLC | 64 | −56,76 | 5 | −54,55 | ||||
| 2025-07-25 | 13F | Hemington Wealth Management | 912 | 0,00 | 0 | |||||
| 2025-08-05 | 13F | Bank Of Montreal /can/ | 306 | 26 | ||||||
| 2025-08-12 | 13F | LPL Financial LLC | 155 818 | −10,55 | 13 223 | −2,66 | ||||
| 2025-08-01 | 13F | MorganRosel Wealth Management, LLC | 7 579 | 28,48 | 643 | 39,78 | ||||
| 2025-08-11 | 13F | Cornerstone Planning Group LLC | 4 140 | 10,11 | 353 | 25,62 | ||||
| 2025-07-21 | 13F | HighMark Wealth Management LLC | 47 256 | −0,03 | 4 009 | 8,74 | ||||
| 2025-08-06 | 13F | Legacy Wealth Managment, LLC/ID | 0 | −100,00 | 0 | |||||
| 2025-08-08 | 13F | Biondo Investment Advisors, LLC | 25 480 | 4,82 | 2 162 | 14,09 | ||||
| 2025-08-14 | 13F | Two Sigma Investments, Lp | 9 500 | 806 | ||||||
| 2025-08-08 | 13F | Creative Planning | 3 704 | 0,00 | 314 | 9,03 | ||||
| 2025-08-12 | 13F | Proequities, Inc. | 0 | 0 | ||||||
| 2025-05-14 | 13F | Huntington National Bank | 16 | −11,11 | ||||||
| 2025-09-04 | 13F/A | Advisor Group Holdings, Inc. | 9 925 | −11,78 | 841 | −4,10 | ||||
| 2025-08-06 | 13F | Commonwealth Equity Services, Llc | 13 282 | 19,95 | 1 | |||||
| 2025-04-16 | 13F | New Century Financial Group, LLC | 0 | −100,00 | 0 | −100,00 | ||||
| 2025-08-13 | 13F | Baird Financial Group, Inc. | 31 863 | 1,92 | 2 704 | 10,92 | ||||
| 2025-08-14 | 13F | Fmr Llc | 1 569 | −45,06 | 133 | −40,09 | ||||
| 2025-07-21 | 13F | Creative Capital Management Investments LLC | 147 | 12 | ||||||
| 2025-08-15 | 13F | Morgan Stanley | 340 583 | −6,55 | 28 902 | 1,70 | ||||
| 2025-07-07 | 13F | Investors Research Corp | 44 | 0,00 | 4 | 0,00 | ||||
| 2025-08-08 | 13F | Cetera Investment Advisers | 19 723 | −6,67 | 1 674 | 1,58 | ||||
| 2025-07-10 | 13F | Focus Financial Network, Inc. | 2 791 | −27,41 | 237 | −21,07 | ||||
| 2025-05-05 | 13F | Eagle Bay Advisors LLC | 0 | −100,00 | 0 | −100,00 | ||||
| 2025-08-15 | 13F | ROSS\JOHNSON & Associates LLC | 0 | −100,00 | 0 | |||||
| 2025-04-15 | 13F | Redhawk Wealth Advisors, Inc. | 0 | −100,00 | 0 | |||||
| 2025-08-11 | 13F | Private Advisor Group, LLC | 22 548 | −24,24 | 1 913 | −17,54 | ||||
| 2025-08-14 | 13F | Colony Group, LLC | 3 516 | 0,03 | 298 | 8,76 | ||||
| 2025-05-14 | 13F | CIBC Private Wealth Group, LLC | 0 | −100,00 | 0 | |||||
| 2025-05-09 | 13F | Comprehensive Financial Planning, Inc./PA | 0 | −100,00 | 0 | |||||
| 2025-08-13 | 13F | Northwestern Mutual Wealth Management Co | 40 211 | 10,37 | 3 412 | 20,10 |