Grundläggande statistik
| Institutionella ägare | 104 total, 104 long only, 0 short only, 0 long/short - change of −4,55% MRQ |
| Genomsnittlig portföljallokering | 0.0184 % - change of −6,75% MRQ |
| Institutionella aktier (lång) | 1 232 962 (ex 13D/G) - change of −0,24MM shares −16,40% MRQ |
| Institutionellt värde (lång) | $ 29 831 USD ($1000) |
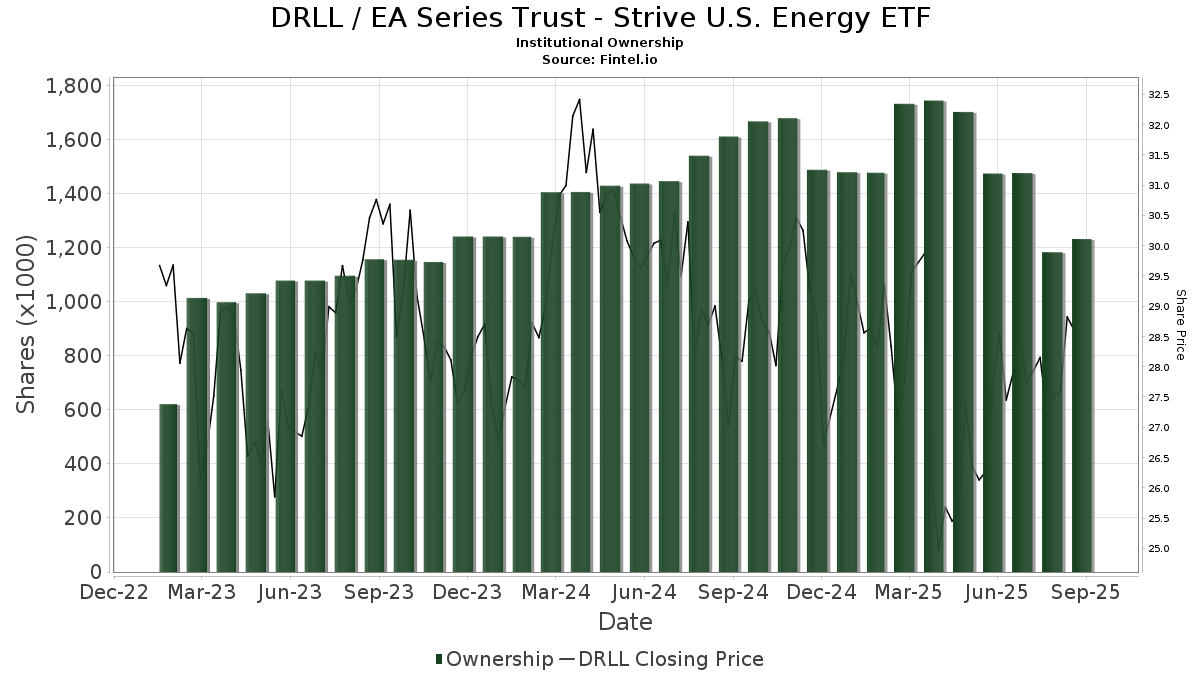
Institutionellt ägande och aktieägare
EA Series Trust - Strive U.S. Energy ETF (US:DRLL) har 104 Institutionella ägare och aktieägare som har lämnat in 13D/G- eller 13F-formulär till Securities Exchange Commission (SEC). Dessa institut innehar totalt 1,232,962 aktier. Största aktieägare inkluderar Raymond James Financial Inc, LPL Financial LLC, Gts Securities Llc, Susquehanna International Group, Llp, Financial Management Network Inc, Cambridge Investment Research Advisors, Inc., Stifel Financial Corp, UBS Group AG, Bank Of America Corp /de/, and Visionary Wealth Advisors .
EA Series Trust - Strive U.S. Energy ETF (NYSE:DRLL) Institutionell ägarstruktur visar institutioners och fonders nuvarande positioner i företaget, samt de senaste förändringarna i positionernas storlek. Större aktieägare kan vara enskilda investerare, fonder, hedgefonder eller institutioner. Bilaga 13D visar att investeraren äger (eller ägde) mer än 5% av företaget och avser (eller avsåg) att aktivt eftersträva en förändring av affärsstrategin. Schedule 13G indikerar en passiv investering på över 5%.
The share price as of September 9, 2025 is 28,31 / share. Previously, on September 10, 2024, the share price was 27,21 / share. This represents an increase of 4,04% over that period.
Fondsentimentets poäng
Fondsentimentet poängen(fka Ägarackumulation-poäng) visar vilka aktier som är mest köpta av fonder. Det är resultatet av en sofistikerad kvantitativ flerfaktormodell som identifierar företag med de högsta nivåerna av institutionell ackumulering. Poängsättningsmodellen använder en kombination av den totala ökningen av redovisade ägare, förändringarna i portföljallokeringarna för dessa ägare och andra mått. Siffran sträcker sig från 0 till 100, där högre siffror indikerar en högre nivå av ackumulering i förhållande till sina konkurrenter, och 50 är genomsnittet.
Uppdateringsfrekvens: Dagligen
Se Ownership Explorer, som innehåller en lista över de högst rankade företagen.
Institutionell sälj/köp-kvot
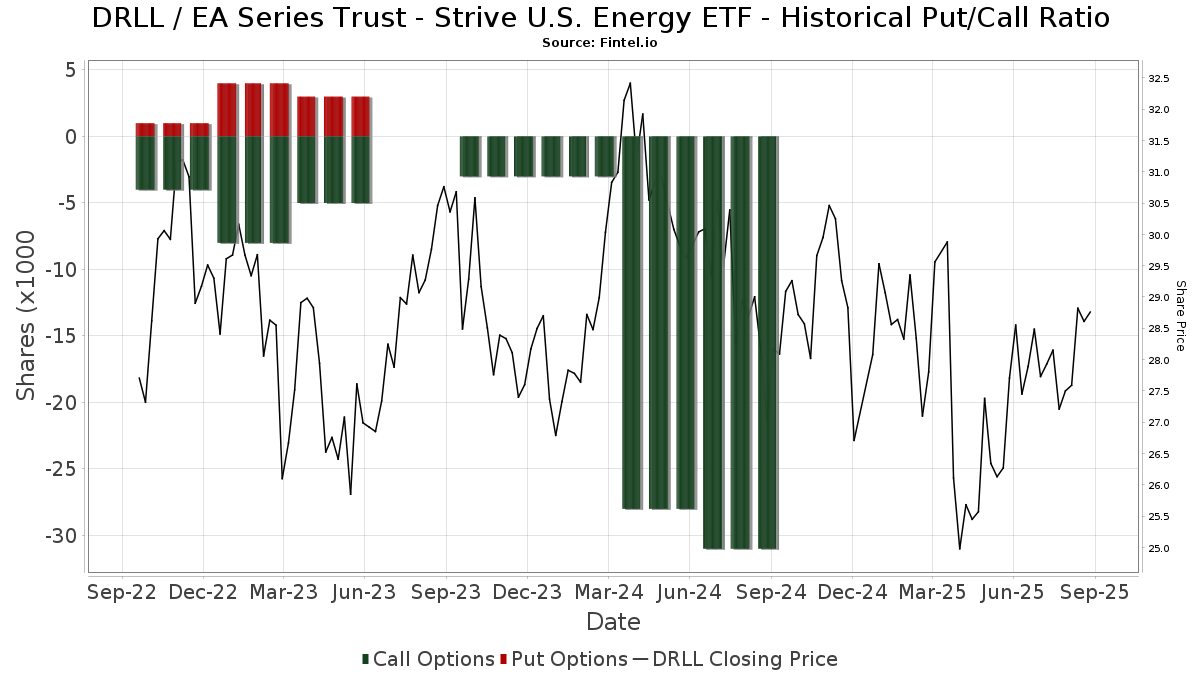
Förutom att rapportera vanliga eget kapital- och skuldemissioner måste institutioner med mer än 100MM tillgångar under förvaltning också avslöja sina innehav av sälj- och köpoptioner. Eftersom säljoptioner i allmänhet indikerar ett negativt sentiment och köpoptioner indikerar ett positivt sentiment, kan vi få en uppfattning om det övergripande institutionella sentimentet genom att plotta förhållandet mellan säljoptioner och köpoptioner. Diagrammet till höger visar det historiska förhållandet mellan sälj- och köpoptioner för detta instrument.
Genom att använda sälj/köp-kvoten som en indikator på aktieägarnas sentiment undviker man en av de största bristerna med att använda det totala institutionella ägandet, nämligen att en betydande del av de förvaltade tillgångarna investeras passivt för att följa index. Passivt förvaltade fonder köper vanligtvis inte optioner, så indikatorn för sälj/köp-kvoten ger en bättre bild av stämningen i aktivt förvaltade fonder.
13F- och NPORT-arkiveringar
Detaljer om 13F-arkiveringar är gratis. Detaljer om NP-arkiveringar kräver ett premiummedlemskap. Gröna rader indikerar nya positioner. Röda rader indikerar stängda positioner. Klicka på länk symbolen för att se hela transaktionshistoriken.
Uppgradera
för att låsa upp premiumdata och exportera till Excel ![]() .
.
| Fil Datum | Källa | Investerare | Typ | Genomsnittligt pris (beräknat) |
Aktier | Δ Aktier (%) |
Rapporterat värde (1000 USD) |
Δ Värde (%) |
Portföljallokering (%) |
|
|---|---|---|---|---|---|---|---|---|---|---|
| 2025-08-11 | 13F | Strategic Wealth Partners, Ltd. | 32 | 1 | ||||||
| 2025-07-17 | 13F | HB Wealth Management, LLC | 0 | −100,00 | 0 | −100,00 | ||||
| 2025-08-14 | 13F | Susquehanna International Group, Llp | 65 911 | 69,20 | 1 789 | 54,67 | ||||
| 2025-08-11 | 13F | Greykasell Wealth Strategies, Inc. | 0 | −100,00 | 0 | |||||
| 2025-04-16 | 13F | Wealth Enhancement Advisory Services, Llc | 0 | −100,00 | 0 | |||||
| 2025-07-16 | 13F | Signaturefd, Llc | 1 130 | 0,71 | 31 | −9,09 | ||||
| 2025-08-14 | 13F | Wells Fargo & Company/mn | 101 | 4 950,00 | 3 | |||||
| 2025-07-24 | 13F | Us Bancorp \de\ | 39 040 | 0,00 | 1 060 | −8,63 | ||||
| 2025-07-07 | 13F | Versant Capital Management, Inc | 310 | 8 | ||||||
| 2025-07-10 | 13F | Oliver Lagore Vanvalin Investment Group | 345 | 1,47 | 10 | 11,11 | ||||
| 2025-08-12 | 13F | WealthTrak Capital Management LLC | 2 004 | 0,00 | 54 | −8,47 | ||||
| 2025-08-18 | 13F | Hollencrest Capital Management | 375 | 0,00 | 10 | −9,09 | ||||
| 2025-08-13 | 13F | Jones Financial Companies Lllp | 23 661 | 13,23 | 647 | 5,21 | ||||
| 2025-07-16 | 13F | ORG Partners LLC | 200 | 0,00 | 5 | 0,00 | ||||
| 2025-07-10 | 13F | Financial Management Network Inc | 60 710 | −7,90 | 1 701 | 4,10 | ||||
| 2025-07-28 | 13F | Harbour Investments, Inc. | 8 534 | 50,72 | 232 | 37,50 | ||||
| 2025-05-12 | 13F | Richard W. Paul & Associates, LLC | 0 | −100,00 | 0 | −100,00 | ||||
| 2025-07-14 | 13F | Whitener Capital Management, Inc. | 9 320 | 10,17 | 253 | 0,40 | ||||
| 2025-08-14 | 13F | Fmr Llc | 163 | −43,99 | 4 | −50,00 | ||||
| 2025-08-14 | 13F | EP Wealth Advisors, Inc. | 19 251 | 0,89 | 522 | −7,77 | ||||
| 2025-08-14 | 13F | Raymond James Financial Inc | 89 205 | 2,10 | 2 421 | −6,67 | ||||
| 2025-08-04 | 13F | IFG Advisory, LLC | 19 708 | 15,58 | 535 | 5,53 | ||||
| 2025-07-08 | 13F | Parallel Advisors, LLC | 725 | −40,82 | 20 | −47,22 | ||||
| 2025-08-14 | 13F | Visionary Wealth Advisors | 43 172 | −47,08 | 1 172 | −51,65 | ||||
| 2025-08-08 | 13F | Comprehensive Financial Planning, Inc./PA | 0 | −100,00 | 0 | |||||
| 2025-07-11 | 13F | Farther Finance Advisors, LLC | 600 | 16 | ||||||
| 2025-07-22 | 13F | Rocky Mountain Advisers, Llc | 334 | 0,00 | 9 | 0,00 | ||||
| 2025-08-08 | 13F | Capital Investment Advisory Services, LLC | 2 153 | 0,00 | 58 | −7,94 | ||||
| 2025-05-13 | 13F | Bank Of Montreal /can/ | 0 | −100,00 | 0 | |||||
| 2025-08-14 | 13F | Bank Of America Corp /de/ | 43 542 | 5,43 | 1 182 | −3,67 | ||||
| 2025-08-14 | 13F | UBS Group AG | 52 578 | 33,82 | 1 427 | 22,30 | ||||
| 2025-08-12 | 13F | Global Retirement Partners, LLC | 260 | 2 500,00 | 7 | |||||
| 2025-08-13 | 13F | StoneX Group Inc. | 22 040 | 8,38 | 600 | −0,66 | ||||
| 2025-08-13 | 13F | Transce3nd, LLC | 25 | 212,50 | 1 | |||||
| 2025-04-17 | 13F | Highline Wealth Partners Llc | 0 | −100,00 | 0 | −100,00 | ||||
| 2025-08-12 | 13F | Howe & Rusling Inc | 1 875 | 0,00 | 51 | −9,09 | ||||
| 2025-07-17 | 13F | Sound Income Strategies, LLC | 35 | 0,00 | 1 | −100,00 | ||||
| 2025-08-13 | 13F | Capital Analysts, Inc. | 91 | 0,00 | 0 | |||||
| 2025-05-16 | 13F | Coppell Advisory Solutions LLC | 0 | −100,00 | 0 | |||||
| 2025-05-09 | 13F | Delta Asset Management Llc/tn | 0 | −100,00 | 0 | |||||
| 2025-07-16 | 13F/A | CX Institutional | 153 | 0,00 | 0 | |||||
| 2025-07-28 | 13F | Mowery & Schoenfeld Wealth Management, LLC | 9 | 0,00 | 0 | |||||
| 2025-07-08 | 13F/A | Salem Investment Counselors Inc | 200 | 0,00 | 5 | 0,00 | ||||
| 2025-08-12 | 13F | Winnow Wealth Llc | 0 | −100,00 | 0 | −100,00 | ||||
| 2025-07-25 | 13F | Concurrent Investment Advisors, LLC | 10 671 | −8,71 | 290 | −16,71 | ||||
| 2025-07-23 | 13F | Heck Capital Advisors, LLC | 0 | −100,00 | 0 | |||||
| 2025-08-12 | 13F | CIBC Private Wealth Group, LLC | 14 133 | 0,00 | 384 | 12,65 | ||||
| 2025-05-09 | 13F | Pathway Financial Advisers, LLC | 0 | −100,00 | 0 | |||||
| 2025-07-30 | 13F | Demars Financial Group, LLC | 8 355 | −95,93 | 227 | 3 666,67 | ||||
| 2025-08-13 | 13F | Flow Traders U.s. Llc | 29 931 | 1 | ||||||
| 2025-04-29 | 13F | Lee Danner & Bass Inc | 0 | −100,00 | 0 | |||||
| 2025-07-07 | 13F | Trust Co | 355 | 0,00 | 10 | −10,00 | ||||
| 2025-08-07 | 13F | McClarren Financial Advisors, Inc. | 0 | −100,00 | 0 | |||||
| 2025-08-14 | 13F | GWM Advisors LLC | 34 | 0,00 | 1 | −100,00 | ||||
| 2025-07-23 | 13F | Indiana Trust & Investment Management CO | 1 140 | −60,07 | 31 | −64,29 | ||||
| 2025-08-14 | 13F | Mariner, LLC | 15 374 | 0,25 | 417 | −8,35 | ||||
| 2025-05-01 | 13F | WESPAC Advisors, LLC | 0 | −100,00 | 0 | |||||
| 2025-07-24 | 13F | IFP Advisors, Inc | 2 039 | 2,93 | 55 | −5,17 | ||||
| 2025-08-14 | 13F | McIlrath & Eck, LLC | 31 279 | 16,60 | 849 | 6,53 | ||||
| 2025-08-15 | 13F | Kestra Advisory Services, LLC | 17 014 | 28,12 | 462 | 17,01 | ||||
| 2025-08-14 | 13F | Goldman Sachs Group Inc | 9 739 | −30,72 | 264 | −36,69 | ||||
| 2025-07-21 | 13F | Ameritas Advisory Services, LLC | 941 | 26 | ||||||
| 2025-08-14 | 13F | Stifel Financial Corp | 52 991 | −12,96 | 1 438 | −20,46 | ||||
| 2025-08-29 | 13F | Total Investment Management Inc | 370 | 10 | ||||||
| 2025-08-12 | 13F | MAI Capital Management | 1 619 | 0,25 | 44 | −8,51 | ||||
| 2025-08-04 | 13F | Creative Financial Designs Inc /adv | 861 | 0,58 | 23 | −8,00 | ||||
| 2025-08-08 | 13F | Pnc Financial Services Group, Inc. | 0 | −100,00 | 0 | −100,00 | ||||
| 2025-07-15 | 13F | Fifth Third Bancorp | 816 | 0,00 | 22 | −8,33 | ||||
| 2025-07-29 | 13F | Tradewinds Capital Management, LLC | 54 | 0,00 | 1 | 0,00 | ||||
| 2025-08-14 | 13F | Harwood Advisory Group, LLC | 208 | 0,00 | 6 | 0,00 | ||||
| 2025-07-10 | 13F | Family Legacy Financial Solutions, LLC | 1 021 | 28 | ||||||
| 2025-07-23 | 13F | RMG Wealth Management LLC | 98 | 3 | ||||||
| 2025-08-12 | 13F | Nemes Rush Group LLC | 0 | −100,00 | 0 | |||||
| 2025-04-17 | 13F | Copia Wealth Management | 0 | −100,00 | 0 | |||||
| 2025-08-11 | 13F | Principal Securities, Inc. | 2 821 | 3,37 | 77 | 2,70 | ||||
| 2025-07-24 | 13F | JNBA Financial Advisors | 172 | 0,00 | 5 | −20,00 | ||||
| 2025-08-19 | 13F | Anchor Investment Management, LLC | 1 100 | 0,00 | 30 | −9,37 | ||||
| 2025-05-15 | 13F | Old Mission Capital Llc | 0 | −100,00 | 0 | −100,00 | ||||
| 2025-07-28 | 13F | Duncker Streett & Co Inc | 500 | 0,00 | 14 | −7,14 | ||||
| 2025-08-14 | 13F | Mml Investors Services, Llc | 12 101 | −4,76 | 0 | |||||
| 2025-08-08 | 13F | Avantax Advisory Services, Inc. | 29 291 | −1,63 | 795 | −10,18 | ||||
| 2025-08-15 | 13F | Morgan Stanley | 2 281 | −36,52 | 62 | −42,45 | ||||
| 2025-07-24 | 13F | Ronald Blue Trust, Inc. | 541 | 0,00 | 15 | −12,50 | ||||
| 2025-08-07 | 13F | Allworth Financial LP | 1 038 | 4,43 | 28 | 12,00 | ||||
| 2025-07-10 | 13F | Pacific Asset Management, LLC | 8 247 | 0,82 | 224 | −7,85 | ||||
| 2025-08-04 | 13F | Spire Wealth Management | 825 | −26,67 | 22 | −33,33 | ||||
| 2025-07-17 | 13F | Beacon Capital Management, LLC | 940 | 0,00 | 26 | −7,41 | ||||
| 2025-07-18 | 13F | Vigilare Wealth Management | 13 470 | 0,31 | 366 | −8,29 | ||||
| 2025-07-29 | 13F | Woodard & Co Asset Management Group Inc /adv | 1 000 | 0,00 | 27 | −6,90 | ||||
| 2025-07-14 | 13F | AdvisorNet Financial, Inc | 154 | −89,69 | 4 | −90,91 | ||||
| 2025-07-07 | 13F | Nova Wealth Management, Inc. | 100 | 0,00 | 3 | 0,00 | ||||
| 2025-08-04 | 13F | Covey Capital Advisors, LLC | 10 000 | 0,00 | 271 | −8,75 | ||||
| 2025-08-12 | 13F | Steward Partners Investment Advisory, Llc | 6 384 | −12,26 | 173 | −19,91 | ||||
| 2025-07-08 | 13F | Nbc Securities, Inc. | 519 | 0,00 | 0 | |||||
| 2025-07-28 | 13F | Holistic Planning, LLC | 21 714 | 0,14 | 589 | −8,54 | ||||
| 2025-08-08 | 13F | Gts Securities Llc | 68 431 | 228,68 | 1 857 | 200,49 | ||||
| 2025-07-25 | 13F | Cwm, Llc | 3 940 | 0,00 | 0 | |||||
| 2025-07-31 | 13F | Cambridge Investment Research Advisors, Inc. | 55 426 | −42,39 | 2 | −50,00 | ||||
| 2025-08-15 | 13F | Captrust Financial Advisors | 0 | −100,00 | 0 | |||||
| 2025-07-30 | 13F | Gables Capital Management Inc. | 5 960 | 53,41 | 162 | 40,00 | ||||
| 2025-08-13 | 13F | Continuum Advisory, LLC | 0 | −100,00 | 0 | |||||
| 2025-08-15 | 13F | Semmax Financial Advisors Inc. | 81 | 1,25 | 2 | 0,00 | ||||
| 2025-04-22 | 13F | Castleview Partners, Llc | 0 | −100,00 | 0 | |||||
| 2025-08-12 | 13F | Jpmorgan Chase & Co | 0 | −100,00 | 0 | |||||
| 2025-08-18 | 13F | Tactive Advisors, LLC | 0 | −100,00 | 0 | |||||
| 2025-09-04 | 13F/A | Advisor Group Holdings, Inc. | 29 883 | −5,76 | 811 | −13,82 | ||||
| 2025-07-10 | 13F | Farmers & Merchants Trust Co of Chambersburg PA | 100 | 0,00 | 0 | |||||
| 2025-08-14 | 13F | CoreCap Advisors, LLC | 677 | 0,00 | 18 | −10,00 | ||||
| 2025-08-18 | 13F | Geneos Wealth Management Inc. | 14 474 | 69,74 | 393 | 54,94 | ||||
| 2025-07-15 | 13F | Mather Group, Llc. | 0 | −100,00 | 0 | |||||
| 2025-05-14 | 13F | Northwestern Mutual Wealth Management Co | 0 | −100,00 | 0 | |||||
| 2025-08-06 | 13F | Commonwealth Equity Services, Llc | 31 725 | −12,30 | 1 | −100,00 | ||||
| 2025-07-31 | 13F | Oppenheimer & Co Inc | 0 | −100,00 | 0 | |||||
| 2025-08-08 | 13F | Cetera Investment Advisers | 29 783 | 1,46 | 808 | −7,23 | ||||
| 2025-07-30 | 13F | Brookstone Capital Management | 0 | −100,00 | 0 | |||||
| 2025-08-14 | 13F | Sunbelt Securities, Inc. | 506 | 0,00 | 14 | −13,33 | ||||
| 2025-08-01 | 13F | Envestnet Asset Management Inc | 14 861 | −28,88 | 403 | −35,00 | ||||
| 2025-04-21 | 13F | Nelson, Van Denburg & Campbell Wealth Management Group, LLC | 0 | −100,00 | 0 | |||||
| 2025-08-12 | 13F | Proequities, Inc. | 0 | 0 | ||||||
| 2025-07-23 | 13F | Friedenthal Financial | 0 | −100,00 | 0 | |||||
| 2025-08-14 | 13F | Heritage Wealth Management, Inc. | 11 504 | 312 | ||||||
| 2025-07-23 | 13F | Godsey & Gibb Associates | 410 | 0,00 | 11 | −8,33 | ||||
| 2025-07-25 | 13F | Atria Wealth Solutions, Inc. | 9 341 | 0,00 | 262 | −5,78 | ||||
| 2025-05-14 | 13F | Jane Street Group, Llc | 0 | −100,00 | 0 | |||||
| 2025-07-07 | 13F | Horizons Wealth Management | 19 | 0,00 | 1 | |||||
| 2025-05-14 | 13F | Change Path, LLC | 0 | −100,00 | 0 | |||||
| 2025-08-14 | 13F | Royal Bank Of Canada | 27 447 | −42,46 | 745 | −47,39 | ||||
| 2025-08-08 | 13F | WASHINGTON TRUST Co | 0 | −100,00 | 0 | |||||
| 2025-08-11 | 13F | Aptus Capital Advisors, LLC | 1 893 | 0,00 | 51 | −8,93 | ||||
| 2025-04-10 | 13F | Park Edge Advisors, LLC | 0 | −100,00 | 0 | |||||
| 2025-05-15 | 13F | Two Sigma Securities, Llc | 0 | −100,00 | 0 | |||||
| 2025-08-05 | 13F | Simplex Trading, Llc | 557 | 0 | ||||||
| 2025-08-07 | 13F | King Luther Capital Management Corp | 258 | −8,87 | ||||||
| 2025-07-08 | 13F | Advance Capital Management, Inc. | 0 | −100,00 | 0 | |||||
| 2025-07-16 | 13F | Brown, Lisle/cummings, Inc. | 100 | 0,00 | 3 | 0,00 | ||||
| 2025-07-25 | 13F | Stephens Consulting, LLC | 957 | 0,00 | 26 | −10,71 | ||||
| 2025-07-28 | 13F | Kiker Wealth Management, LLC | 2 810 | 462,00 | 76 | 442,86 | ||||
| 2025-08-12 | 13F | LPL Financial LLC | 86 056 | −2,45 | 2 336 | −10,88 | ||||
| 2025-08-06 | 13F | AE Wealth Management LLC | 4 084 | 20,58 | 111 | 10,00 | ||||
| 2025-07-17 | 13F | Global Trust Asset Management, LLC | 500 | 0,00 | 14 | −7,14 | ||||
| 2025-04-18 | 13F | Pacific Capital Wealth Advisors, Inc | 0 | −100,00 | 0 | −100,00 | ||||
| 2025-08-11 | 13F | HighTower Advisors, LLC | 11 014 | 4,30 | 299 | −4,79 | ||||
| 2025-07-16 | 13F | Evergreen Private Wealth LLC | 390 | 0,00 | 11 | −9,09 |