Grundläggande statistik
| Institutionella ägare | 81 total, 81 long only, 0 short only, 0 long/short - change of 9,33% MRQ |
| Genomsnittlig portföljallokering | 0.1311 % - change of −36,25% MRQ |
| Institutionella aktier (lång) | 10 157 276 (ex 13D/G) - change of 0,07MM shares 0,72% MRQ |
| Institutionellt värde (lång) | $ 152 487 USD ($1000) |
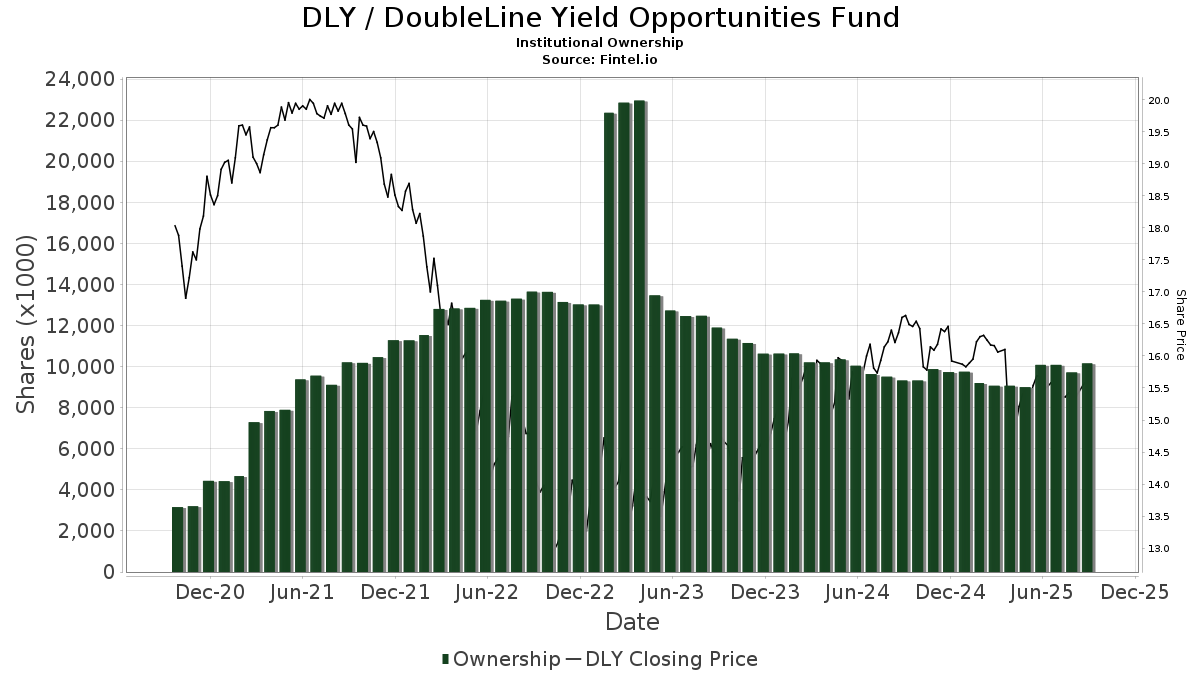
Institutionellt ägande och aktieägare
DoubleLine Yield Opportunities Fund (US:DLY) har 81 Institutionella ägare och aktieägare som har lämnat in 13D/G- eller 13F-formulär till Securities Exchange Commission (SEC). Dessa institut innehar totalt 10,157,276 aktier. Största aktieägare inkluderar Morgan Stanley, Wells Fargo & Company/mn, UBS Group AG, Royal Bank Of Canada, LeConte Wealth Management, LLC, HighTower Advisors, LLC, Raymond James Financial Inc, Polar Asset Management Partners Inc., Journey Advisory Group, LLC, and Pensionmark Financial Group, Llc .
DoubleLine Yield Opportunities Fund (NYSE:DLY) Institutionell ägarstruktur visar institutioners och fonders nuvarande positioner i företaget, samt de senaste förändringarna i positionernas storlek. Större aktieägare kan vara enskilda investerare, fonder, hedgefonder eller institutioner. Bilaga 13D visar att investeraren äger (eller ägde) mer än 5% av företaget och avser (eller avsåg) att aktivt eftersträva en förändring av affärsstrategin. Schedule 13G indikerar en passiv investering på över 5%.
The share price as of September 12, 2025 is 15,55 / share. Previously, on September 16, 2024, the share price was 16,62 / share. This represents a decline of 6,44% over that period.
Fondsentimentets poäng
Fondsentimentet poängen(fka Ägarackumulation-poäng) visar vilka aktier som är mest köpta av fonder. Det är resultatet av en sofistikerad kvantitativ flerfaktormodell som identifierar företag med de högsta nivåerna av institutionell ackumulering. Poängsättningsmodellen använder en kombination av den totala ökningen av redovisade ägare, förändringarna i portföljallokeringarna för dessa ägare och andra mått. Siffran sträcker sig från 0 till 100, där högre siffror indikerar en högre nivå av ackumulering i förhållande till sina konkurrenter, och 50 är genomsnittet.
Uppdateringsfrekvens: Dagligen
Se Ownership Explorer, som innehåller en lista över de högst rankade företagen.
Institutionell sälj/köp-kvot
Förutom att rapportera vanliga eget kapital- och skuldemissioner måste institutioner med mer än 100MM tillgångar under förvaltning också avslöja sina innehav av sälj- och köpoptioner. Eftersom säljoptioner i allmänhet indikerar ett negativt sentiment och köpoptioner indikerar ett positivt sentiment, kan vi få en uppfattning om det övergripande institutionella sentimentet genom att plotta förhållandet mellan säljoptioner och köpoptioner. Diagrammet till höger visar det historiska förhållandet mellan sälj- och köpoptioner för detta instrument.
Genom att använda sälj/köp-kvoten som en indikator på aktieägarnas sentiment undviker man en av de största bristerna med att använda det totala institutionella ägandet, nämligen att en betydande del av de förvaltade tillgångarna investeras passivt för att följa index. Passivt förvaltade fonder köper vanligtvis inte optioner, så indikatorn för sälj/köp-kvoten ger en bättre bild av stämningen i aktivt förvaltade fonder.
13F- och NPORT-arkiveringar
Detaljer om 13F-arkiveringar är gratis. Detaljer om NP-arkiveringar kräver ett premiummedlemskap. Gröna rader indikerar nya positioner. Röda rader indikerar stängda positioner. Klicka på länk symbolen för att se hela transaktionshistoriken.
Uppgradera
för att låsa upp premiumdata och exportera till Excel ![]() .
.
| Fil Datum | Källa | Investerare | Typ | Genomsnittligt pris (beräknat) |
Aktier | Δ Aktier (%) |
Rapporterat värde (1000 USD) |
Δ Värde (%) |
Portföljallokering (%) |
|
|---|---|---|---|---|---|---|---|---|---|---|
| 2025-07-30 | 13F | Avidian Wealth Solutions, LLC | 14 000 | 0,00 | 218 | −3,11 | ||||
| 2025-07-31 | 13F | Oppenheimer & Co Inc | 12 430 | −34,51 | 194 | −36,72 | ||||
| 2025-08-12 | 13F | CIBC Private Wealth Group, LLC | 12 815 | 35,48 | 200 | 45,26 | ||||
| 2025-05-15 | 13F | FSA Wealth Management LLC | 0 | −100,00 | 0 | |||||
| 2025-08-08 | 13F | Larson Financial Group LLC | 2 169 | 0,05 | 34 | −2,94 | ||||
| 2025-07-16 | 13F | St Germain D J Co Inc | 680 | 0,00 | 11 | 0,00 | ||||
| 2025-08-12 | 13F | Global Retirement Partners, LLC | 0 | −100,00 | 0 | |||||
| 2025-04-29 | 13F | Lee Danner & Bass Inc | 0 | −100,00 | 0 | −100,00 | ||||
| 2025-07-25 | 13F | Total Clarity Wealth Management, Inc. | 0 | −100,00 | 0 | |||||
| 2025-07-15 | 13F | LeConte Wealth Management, LLC | 520 722 | −46,48 | 8 118 | −48,17 | ||||
| 2025-05-16 | 13F/A | Kestra Investment Management, LLC | 0 | −100,00 | 0 | |||||
| 2025-08-04 | 13F | Creekmur Asset Management LLC | 15 | 0 | ||||||
| 2025-08-04 | 13F | Pensionmark Financial Group, Llc | 178 410 | −40,40 | 2 781 | −42,29 | ||||
| 2025-08-14 | 13F | Polar Asset Management Partners Inc. | 278 950 | 4 349 | ||||||
| 2025-07-31 | 13F | Optimum Investment Advisors | 7 983 | −32,34 | 124 | −34,39 | ||||
| 2025-05-08 | 13F | Harbour Investments, Inc. | 0 | −100,00 | 0 | |||||
| 2025-08-15 | 13F | Kestra Advisory Services, LLC | 0 | −100,00 | 0 | |||||
| 2025-08-14 | 13F | LM Advisors LLC | 0 | −100,00 | 0 | |||||
| 2025-07-28 | 13F | IFC Advisors LLC | 27 883 | 435 | ||||||
| 2025-07-16 | 13F | Maridea Wealth Management LLC | 106 589 | 3,81 | 1 662 | 0,48 | ||||
| 2025-08-15 | 13F | Morgan Stanley | 2 093 650 | 1,58 | 32 640 | −1,64 | ||||
| 2025-08-14 | 13F | GWM Advisors LLC | 44 365 | 26,22 | 692 | 22,30 | ||||
| 2025-08-19 | 13F | National Asset Management, Inc. | 0 | −100,00 | 0 | |||||
| 2025-08-14 | 13F | Cohen & Steers, Inc. | 175 007 | 0,00 | 3 | 0,00 | ||||
| 2025-07-14 | 13F | Westend Capital Management LLC | 13 807 | 1,96 | 215 | −1,38 | ||||
| 2025-08-21 | 13F | Pathway Financial Advisers, LLC | 37 394 | −0,91 | 583 | −4,12 | ||||
| 2025-05-05 | 13F | Hollencrest Capital Management | 0 | −100,00 | 0 | −100,00 | ||||
| 2025-08-14 | 13F | Wells Fargo & Company/mn | 2 000 342 | 5,69 | 31 185 | 2,34 | ||||
| 2025-08-05 | 13F | Aviance Capital Partners, LLC | 29 978 | 17,19 | 467 | 13,63 | ||||
| 2025-08-01 | 13F | Redwood Park Advisors LLC | 10 674 | 26,29 | 166 | 22,06 | ||||
| 2025-08-14 | 13F | Stifel Financial Corp | 69 759 | −4,26 | 1 088 | −7,33 | ||||
| 2025-07-29 | 13F | Creekside Partners | 116 059 | 0,61 | 1 809 | −2,58 | ||||
| 2025-08-05 | 13F | Fourth Dimension Wealth, LLC | 2 800 | −9,68 | 44 | −12,24 | ||||
| 2025-08-13 | 13F | First Trust Advisors Lp | 18 311 | 9,75 | 285 | 6,34 | ||||
| 2025-08-14 | 13F | UBS Group AG | 1 043 867 | −7,78 | 16 274 | −10,70 | ||||
| 2025-07-30 | 13F | Journey Advisory Group, LLC | 196 673 | −0,52 | 3 066 | −3,68 | ||||
| 2025-08-14 | 13F | Comerica Bank | 29 816 | 0,16 | 465 | −3,13 | ||||
| 2025-08-07 | 13F | Allworth Financial LP | 385 | 0,00 | 6 | 20,00 | ||||
| 2025-07-18 | 13F | Consolidated Portfolio Review Corp | 176 405 | 4,12 | 2 750 | 0,84 | ||||
| 2025-08-14 | 13F | Raymond James Financial Inc | 314 553 | 15,30 | 4 904 | 11,63 | ||||
| 2025-08-14 | 13F | Bank Of America Corp /de/ | 163 247 | 0,81 | 2 545 | −2,38 | ||||
| 2025-08-12 | 13F | Walled Lake Planning & Wealth Management, Llc | 40 142 | 0,00 | 626 | −3,25 | ||||
| 2025-08-13 | 13F | Cerity Partners LLC | 10 000 | 156 | ||||||
| 2025-08-07 | 13F | Hennion & Walsh Asset Management, Inc. | 74 920 | −0,12 | 1 168 | −3,23 | ||||
| 2025-07-25 | NP | FCEF - First Trust CEF Income Opportunity ETF This fund is a listed as child fund of First Trust Advisors Lp and if that institution has disclosed ownership in this security, then these positions will not be double counted when calculating total shares and total value | 5 737 | 0,00 | 90 | −3,23 | ||||
| 2025-08-07 | 13F | Evoke Wealth, Llc | 96 685 | 4,32 | 1 507 | 1,01 | ||||
| 2025-07-22 | 13F | Belpointe Asset Management LLC | 13 775 | 0,00 | 215 | −3,17 | ||||
| 2025-08-18 | 13F | Geneos Wealth Management Inc. | 450 | 0,00 | 7 | 0,00 | ||||
| 2025-08-12 | 13F | Proequities, Inc. | 0 | 0 | ||||||
| 2025-08-14 | 13F | Integrated Wealth Concepts LLC | 11 095 | 173 | ||||||
| 2025-07-29 | 13F | Activest Wealth Management | 7 652 | 0,00 | 119 | −3,25 | ||||
| 2025-08-14 | 13F | Jane Street Group, Llc | 12 767 | 199 | ||||||
| 2025-05-15 | 13F | Hrt Financial Lp | 0 | −100,00 | 0 | |||||
| 2025-08-08 | 13F | Calamos Advisors LLC | 20 251 | 316 | ||||||
| 2025-08-11 | 13F | Elequin Capital Lp | 17 451 | 272 | ||||||
| 2025-08-08 | 13F | Schwarz Dygos Wheeler Investment Advisors Llc | 67 358 | 2,49 | 1 050 | −0,76 | ||||
| 2025-08-07 | 13F | Summit X, LLC | 10 087 | −42,28 | 157 | −44,13 | ||||
| 2025-07-21 | 13F | Catalina Capital Group, LLC | 13 518 | −0,20 | 211 | −3,67 | ||||
| 2025-08-12 | 13F | LPL Financial LLC | 92 688 | 4,13 | 1 445 | 0,84 | ||||
| 2025-07-22 | 13F | Wealthcare Advisory Partners LLC | 15 265 | 2,11 | 238 | −1,25 | ||||
| 2025-08-13 | 13F | Invesco Ltd. | 30 552 | 5,25 | 476 | 1,93 | ||||
| 2025-07-14 | 13F | Gridiron Partners, LLC | 27 066 | 0,00 | 422 | −3,22 | ||||
| 2025-08-13 | 13F | Allie Family Office LLC | 20 000 | 0,00 | 312 | −3,42 | ||||
| 2025-08-04 | 13F | Bay Colony Advisory Group, Inc d/b/a Bay Colony Advisors | 11 098 | 2,69 | 173 | 0,00 | ||||
| 2025-08-06 | 13F | Moors & Cabot, Inc. | 0 | −100,00 | 0 | |||||
| 2025-08-15 | 13F | Captrust Financial Advisors | 35 599 | −63,34 | 555 | −64,56 | ||||
| 2025-08-11 | 13F | HighTower Advisors, LLC | 463 403 | 1,92 | 7 224 | −1,31 | ||||
| 2025-07-15 | 13F | Financial Management Professionals, Inc. | 1 396 | 2,27 | 22 | 0,00 | ||||
| 2025-08-01 | 13F | Envestnet Asset Management Inc | 23 784 | 35,23 | 371 | 30,74 | ||||
| 2025-08-14 | 13F | Balyasny Asset Management Llc | 25 354 | 395 | ||||||
| 2025-07-31 | 13F | Glass Jacobson Investment Advisors llc | 0 | −100,00 | 0 | −100,00 | ||||
| 2025-05-05 | 13F | Lindbrook Capital, Llc | 4 100 | 0,00 | 66 | 3,13 | ||||
| 2025-04-29 | 13F | Raleigh Capital Management Inc. | 0 | −100,00 | 0 | |||||
| 2025-08-14 | 13F | Susquehanna International Group, Llp | 32 447 | 506 | ||||||
| 2025-08-14 | 13F | Sunbelt Securities, Inc. | 1 000 | 0,00 | 16 | −6,25 | ||||
| 2025-08-14 | 13F | Mpwm Advisory Solutions, Llc | 10 778 | 0,76 | 168 | −2,33 | ||||
| 2025-08-15 | 13F | CI Private Wealth, LLC | 18 841 | 294 | ||||||
| 2025-07-31 | 13F | Cambridge Investment Research Advisors, Inc. | 19 200 | 0 | ||||||
| 2025-07-25 | 13F | Atria Wealth Solutions, Inc. | 62 055 | 16,56 | 967 | 12,84 | ||||
| 2025-08-11 | 13F | Private Advisor Group, LLC | 19 532 | 0,52 | 305 | −2,56 | ||||
| 2025-05-15 | 13F | Citadel Advisors Llc | 0 | −100,00 | 0 | |||||
| 2025-07-25 | 13F | We Are One Seven, LLC | 35 149 | 548 | ||||||
| 2025-09-04 | 13F/A | Advisor Group Holdings, Inc. | 61 319 | 22,94 | 956 | 19,05 | ||||
| 2025-08-06 | 13F | Wedbush Securities Inc | 120 468 | 8,04 | 2 | 0,00 | ||||
| 2025-08-14 | 13F | Royal Bank Of Canada | 593 922 | 2,47 | 9 259 | −0,77 | ||||
| 2025-04-22 | 13F | Synergy Financial Management, LLC | 0 | −100,00 | 0 | |||||
| 2025-08-12 | 13F | Journey Strategic Wealth Llc | 37 561 | 6,72 | 586 | 3,36 | ||||
| 2025-05-15 | 13F | Advisory Services Network, LLC | 0 | −100,00 | 0 | |||||
| 2025-07-16 | 13F | Moisand Fitzgerald Tamayo, LLC | 500 | 0,00 | 8 | −12,50 | ||||
| 2025-08-06 | 13F | Commonwealth Equity Services, Llc | 59 504 | −42,80 | 1 | −100,00 | ||||
| 2025-06-30 | NP | CVY - Invesco Zacks Multi-Asset Income ETF This fund is a listed as child fund of Invesco Ltd. and if that institution has disclosed ownership in this security, then these positions will not be double counted when calculating total shares and total value | 29 649 | −27,10 | 451 | −31,30 | ||||
| 2025-07-21 | 13F | Precedent Wealth Partners, Llc | 11 828 | −5,22 | 184 | −8,00 | ||||
| 2025-08-05 | 13F | Shaker Financial Services, LLC | 83 413 | 1 300 | ||||||
| 2025-08-08 | 13F | Cetera Investment Advisers | 25 535 | 8,26 | 398 | 5,01 | ||||
| 2025-05-14 | 13F | Northwestern Mutual Wealth Management Co | 0 | −100,00 | 0 | |||||
| 2025-08-12 | 13F | Jpmorgan Chase & Co | 638 | −90,84 | 10 | −91,96 | ||||
| 2025-08-07 | 13F | Readystate Asset Management Lp | 78 893 | 518,33 | 1 230 | 499,51 | ||||
| 2025-08-19 | 13F | Asset Dedication, LLC | 1 944 | 0,00 | 30 | −3,23 | ||||
| 2025-08-14 | 13F/A | Rockefeller Capital Management L.P. | 32 802 | −5,68 | 511 | −8,59 | ||||
| 2025-05-12 | 13F | Virtu Financial LLC | 0 | −100,00 | 0 | |||||
| 2025-05-14 | 13F | Huntington National Bank | 32 | |||||||
| 2025-08-11 | 13F | Tidemark, LLC | 3 753 | 0,00 | 59 | −3,33 |