Grundläggande statistik
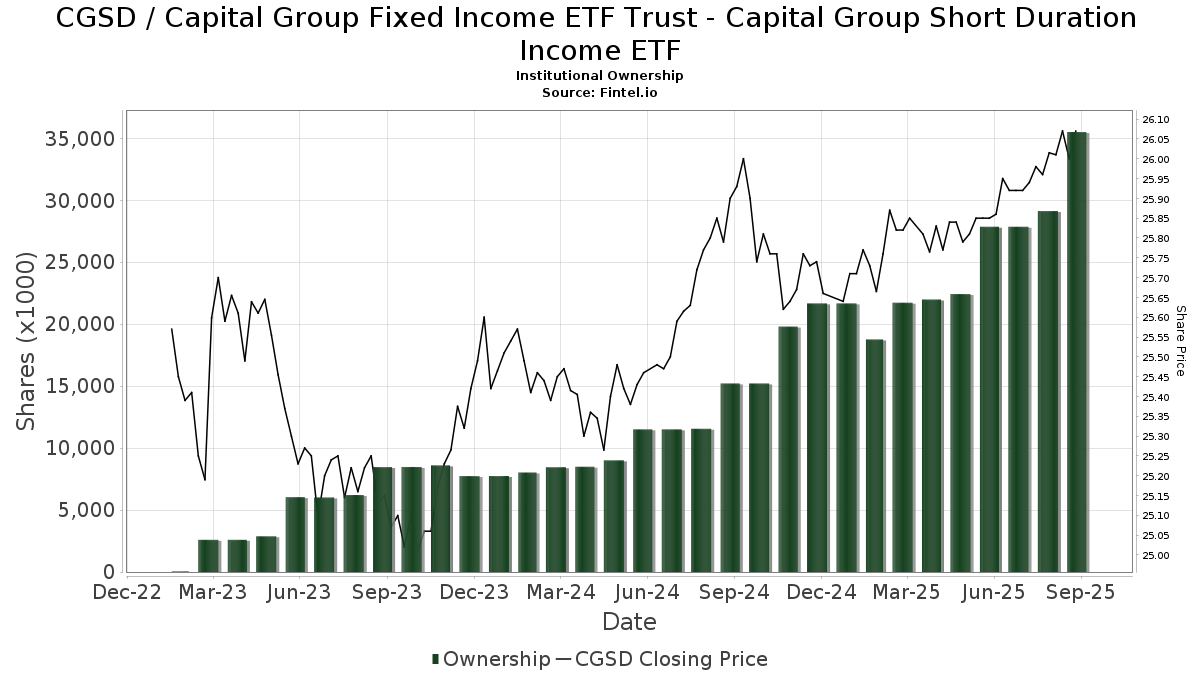
| Institutionella ägare | 147 total, 147 long only, 0 short only, 0 long/short - change of 8,82% MRQ |
| Genomsnittlig portföljallokering | 0.3855 % - change of 2,54% MRQ |
| Institutionella aktier (lång) | 35 507 500 (ex 13D/G) - change of 7,65MM shares 27,44% MRQ |
| Institutionellt värde (lång) | $ 840 352 USD ($1000) |
Institutionellt ägande och aktieägare
Capital Group Fixed Income ETF Trust - Capital Group Short Duration Income ETF (US:CGSD) har 147 Institutionella ägare och aktieägare som har lämnat in 13D/G- eller 13F-formulär till Securities Exchange Commission (SEC). Dessa institut innehar totalt 35,507,500 aktier. Största aktieägare inkluderar Morgan Stanley, LPL Financial LLC, Capital Group Private Client Services, Inc., Commonwealth Equity Services, Llc, Cetera Investment Advisers, McIlrath & Eck, LLC, Advisor Group Holdings, Inc., Envestnet Asset Management Inc, WNY Asset Management, LLC, and Raymond James Financial Inc .
Capital Group Fixed Income ETF Trust - Capital Group Short Duration Income ETF (ARCA:CGSD) Institutionell ägarstruktur visar institutioners och fonders nuvarande positioner i företaget, samt de senaste förändringarna i positionernas storlek. Större aktieägare kan vara enskilda investerare, fonder, hedgefonder eller institutioner. Bilaga 13D visar att investeraren äger (eller ägde) mer än 5% av företaget och avser (eller avsåg) att aktivt eftersträva en förändring av affärsstrategin. Schedule 13G indikerar en passiv investering på över 5%.
The share price as of September 11, 2025 is 26,08 / share. Previously, on September 12, 2024, the share price was 25,88 / share. This represents an increase of 0,75% over that period.
Fondsentimentets poäng
Fondsentimentet poängen(fka Ägarackumulation-poäng) visar vilka aktier som är mest köpta av fonder. Det är resultatet av en sofistikerad kvantitativ flerfaktormodell som identifierar företag med de högsta nivåerna av institutionell ackumulering. Poängsättningsmodellen använder en kombination av den totala ökningen av redovisade ägare, förändringarna i portföljallokeringarna för dessa ägare och andra mått. Siffran sträcker sig från 0 till 100, där högre siffror indikerar en högre nivå av ackumulering i förhållande till sina konkurrenter, och 50 är genomsnittet.
Uppdateringsfrekvens: Dagligen
Se Ownership Explorer, som innehåller en lista över de högst rankade företagen.
Institutionell sälj/köp-kvot
Förutom att rapportera vanliga eget kapital- och skuldemissioner måste institutioner med mer än 100MM tillgångar under förvaltning också avslöja sina innehav av sälj- och köpoptioner. Eftersom säljoptioner i allmänhet indikerar ett negativt sentiment och köpoptioner indikerar ett positivt sentiment, kan vi få en uppfattning om det övergripande institutionella sentimentet genom att plotta förhållandet mellan säljoptioner och köpoptioner. Diagrammet till höger visar det historiska förhållandet mellan sälj- och köpoptioner för detta instrument.
Genom att använda sälj/köp-kvoten som en indikator på aktieägarnas sentiment undviker man en av de största bristerna med att använda det totala institutionella ägandet, nämligen att en betydande del av de förvaltade tillgångarna investeras passivt för att följa index. Passivt förvaltade fonder köper vanligtvis inte optioner, så indikatorn för sälj/köp-kvoten ger en bättre bild av stämningen i aktivt förvaltade fonder.
13F- och NPORT-arkiveringar
Detaljer om 13F-arkiveringar är gratis. Detaljer om NP-arkiveringar kräver ett premiummedlemskap. Gröna rader indikerar nya positioner. Röda rader indikerar stängda positioner. Klicka på länk symbolen för att se hela transaktionshistoriken.
Uppgradera
för att låsa upp premiumdata och exportera till Excel ![]() .
.
| Fil Datum | Källa | Investerare | Typ | Genomsnittligt pris (beräknat) |
Aktier | Δ Aktier (%) |
Rapporterat värde (1000 USD) |
Δ Värde (%) |
Portföljallokering (%) |
|
|---|---|---|---|---|---|---|---|---|---|---|
| 2025-07-30 | 13F | Cullen/frost Bankers, Inc. | 4 056 | 51,34 | 105 | 52,17 | ||||
| 2025-07-23 | 13F | Tcfg Wealth Management, Llc | 36 977 | 21,85 | 959 | 22,48 | ||||
| 2025-04-10 | 13F | TrueWealth Advisors, LLC | 0 | −100,00 | 0 | |||||
| 2025-09-04 | 13F/A | Advisor Group Holdings, Inc. | 1 106 573 | 20,07 | 28 695 | 20,64 | ||||
| 2025-07-11 | 13F | Petredis Investment Advisors Llc | 118 482 | 3 073 | ||||||
| 2025-07-15 | 13F | Garrett Investment Advisors LLC | 12 985 | −3,74 | 337 | −3,45 | ||||
| 2025-08-12 | 13F | SRS Capital Advisors, Inc. | 70 | 2 | ||||||
| 2025-08-13 | 13F | RFP Financial Group LLC | 25 544 | −11,76 | 662 | −11,38 | ||||
| 2025-07-16 | 13F | Signature Resources Capital Management, LLC | 2 284 | 197,40 | 59 | 210,53 | ||||
| 2025-08-04 | 13F | Arkadios Wealth Advisors | 8 238 | 214 | ||||||
| 2025-08-11 | 13F | Private Advisor Group, LLC | 317 271 | −6,49 | 8 228 | −6,03 | ||||
| 2025-08-14 | 13F | UBS Group AG | 881 595 | −0,50 | 22 864 | −0,01 | ||||
| 2025-07-24 | 13F | Stonebridge Financial Group, LLC | 40 202 | 61,96 | 1 043 | 62,81 | ||||
| 2025-07-25 | 13F | Envestnet Portfolio Solutions, Inc. | 12 910 | 335 | ||||||
| 2025-08-15 | 13F | Kestra Advisory Services, LLC | 171 688 | 3,96 | 4 453 | 4,46 | ||||
| 2025-08-11 | 13F | Principal Securities, Inc. | 8 300 | 0,00 | 215 | 1,42 | ||||
| 2025-08-12 | 13F | Lodestone Wealth Management LLC | 168 654 | −2,55 | 4 374 | −2,06 | ||||
| 2025-08-12 | 13F | Jpmorgan Chase & Co | 0 | 0 | ||||||
| 2025-08-14 | 13F | Susquehanna International Group, Llp | 0 | −100,00 | 0 | |||||
| 2025-08-13 | 13F | Townsquare Capital Llc | 0 | −100,00 | 0 | |||||
| 2025-08-14 | 13F | Citadel Advisors Llc | 207 589 | 30,45 | 5 384 | 31,07 | ||||
| 2025-07-22 | 13F | Merit Financial Group, LLC | 20 427 | 530 | ||||||
| 2025-08-11 | 13F | Inspire Advisors, LLC | 97 244 | 0,74 | 2 522 | 1,24 | ||||
| 2025-07-10 | 13F | Financial Management Network Inc | 147 558 | 10,21 | 3 817 | 10,51 | ||||
| 2025-07-28 | 13F | Sagespring Wealth Partners, Llc | 8 051 | 209 | ||||||
| 2025-04-11 | 13F | Fjell Capital, LLC | 0 | −100,00 | 0 | |||||
| 2025-04-30 | 13F | J Hagan Capital, Inc. | 176 837 | 4 534 | ||||||
| 2025-08-11 | 13F | Perennial Investment Advisors, LLC | 28 570 | 12,97 | 741 | 13,50 | ||||
| 2025-07-11 | 13F | LongView Wealth Management | 26 157 | −52,56 | 678 | −52,35 | ||||
| 2025-07-29 | 13F | International Assets Investment Management, Llc | 126 072 | −0,27 | 3 270 | 0,21 | ||||
| 2025-08-14 | 13F | GWM Advisors LLC | 263 378 | 52,81 | 6 831 | 53,55 | ||||
| 2025-07-16 | 13F | ORG Partners LLC | 581 | 15 | ||||||
| 2025-07-17 | 13F | Johnson Bixby & Associates, LLC | 7 779 | 0,00 | 202 | 0,50 | ||||
| 2025-07-29 | 13F | Burford Brothers, Inc. | 27 731 | −6,02 | 719 | −5,52 | ||||
| 2025-07-22 | 13F | DAVENPORT & Co LLC | 24 066 | 1,35 | 624 | 1,96 | ||||
| 2025-04-21 | 13F | Beacon Capital Management, LLC | 0 | −100,00 | 0 | |||||
| 2025-07-15 | 13F | Hartmann Taylor Wealth Management, LLC | 11 125 | 11,25 | 289 | 11,63 | ||||
| 2025-08-06 | 13F | Cannon Financial Strategists, Inc. | 28 998 | 752 | ||||||
| 2025-08-14 | 13F | Clg Llc | 65 908 | 3,69 | 1 709 | 4,21 | ||||
| 2025-07-25 | 13F | We Are One Seven, LLC | 13 950 | −4,12 | 362 | −3,73 | ||||
| 2025-08-14 | 13F | Royal Bank Of Canada | 798 718 | 68,64 | 20 715 | 69,46 | ||||
| 2025-07-25 | 13F | Atria Wealth Solutions, Inc. | 123 450 | −3,59 | 3 194 | −3,36 | ||||
| 2025-07-09 | 13F | Dynamic Advisor Solutions LLC | 56 324 | 38,90 | 1 461 | 39,58 | ||||
| 2025-08-14 | 13F | Wiley Bros.-aintree Capital, Llc | 76 778 | 2 007 | ||||||
| 2025-08-04 | 13F | Bay Colony Advisory Group, Inc d/b/a Bay Colony Advisors | 25 153 | −23,83 | 652 | −23,47 | ||||
| 2025-08-15 | 13F | Captrust Financial Advisors | 877 337 | 18,77 | 22 754 | 19,34 | ||||
| 2025-07-24 | 13F | Cyndeo Wealth Partners, LLC | 33 023 | 2,10 | 856 | 2,64 | ||||
| 2025-05-14 | 13F | Flow Traders U.s. Llc | 0 | −100,00 | 0 | |||||
| 2025-08-07 | 13F | Kestra Private Wealth Services, Llc | 344 503 | 12,99 | 8 935 | 13,53 | ||||
| 2025-07-31 | 13F | Moloney Securities Asset Management, LLC | 0 | −100,00 | 0 | |||||
| 2025-08-04 | 13F | WNY Asset Management, LLC | 960 267 | 6,47 | 24 905 | 6,99 | ||||
| 2025-08-11 | 13F | Aptus Capital Advisors, LLC | 28 650 | 0,00 | 743 | 0,54 | ||||
| 2025-08-14 | 13F | Great Valley Advisor Group, Inc. | 328 320 | 11,42 | 8 515 | 11,97 | ||||
| 2025-08-27 | 13F/A | Brinker Capital Investments, LLC | 16 010 | 415 | ||||||
| 2025-08-13 | 13F | Gateway Wealth Partners, LLC | 0 | −100,00 | 0 | |||||
| 2025-08-18 | 13F/A | Kestra Investment Management, LLC | 202 348 | 1 313,64 | 5 248 | 1 321,95 | ||||
| 2025-07-22 | 13F | Beacon Financial Advisory LLC | 10 526 | 273 | ||||||
| 2025-08-14 | 13F | Guardian Wealth Advisors, Llc / Nc | 28 650 | 0,00 | 743 | 0,54 | ||||
| 2025-08-11 | 13F | Beta Wealth Group, Inc. | 493 239 | −1,07 | 12 792 | −0,58 | ||||
| 2025-07-30 | 13F | Bleakley Financial Group, LLC | 38 232 | −15,70 | 992 | −15,30 | ||||
| 2025-08-12 | 13F | Deutsche Bank Ag\ | 956 | 25 | ||||||
| 2025-08-14 | 13F | Mpwm Advisory Solutions, Llc | 6 642 | −47,47 | 172 | −47,24 | ||||
| 2025-08-04 | 13F | Bridgewealth Advisory Group, LLC | 787 980 | 745,30 | 20 436 | 749,73 | ||||
| 2025-08-06 | 13F | Souders Financial Advisors | 398 518 | 9,15 | 10 336 | 9,68 | ||||
| 2025-08-11 | 13F | Western Wealth Management, LLC | 44 348 | 1,66 | 1 150 | 2,22 | ||||
| 2025-08-13 | 13F | Baird Financial Group, Inc. | 37 110 | 0,00 | 962 | 0,52 | ||||
| 2025-07-28 | 13F | RFG Advisory, LLC | 26 973 | 6,57 | 700 | 7,04 | ||||
| 2025-05-09 | 13F | Delta Financial Group, Inc. | 11 671 | 4,72 | 0 | |||||
| 2025-07-08 | 13F | IAM Advisory, LLC | 523 928 | 13 588 | ||||||
| 2025-08-13 | 13F | Strategic Family Wealth Counselors, L.L.C. | 17 623 | 0,00 | 457 | 0,66 | ||||
| 2025-08-12 | 13F | Titleist Asset Management, Llc | 10 449 | 3,51 | 271 | 4,23 | ||||
| 2025-08-12 | 13F | Steward Partners Investment Advisory, Llc | 6 345 | −15,54 | 165 | −15,03 | ||||
| 2025-08-04 | 13F | Saxony Capital Management, LLC | 93 898 | 1,75 | 2 435 | 2,27 | ||||
| 2025-08-14 | 13F | Benjamin Edwards Inc | 145 255 | −7,51 | 3 767 | −7,06 | ||||
| 2025-07-28 | 13F | Harbour Investments, Inc. | 43 913 | 22,12 | 1 139 | 22,63 | ||||
| 2025-08-12 | 13F | Rather & Kittrell, Inc. | 7 781 | 0,00 | 202 | 0,50 | ||||
| 2025-08-12 | 13F | Global Retirement Partners, LLC | 29 810 | 6 675,00 | 773 | 6 927,27 | ||||
| 2025-07-24 | 13F | IFP Advisors, Inc | 879 | 1,15 | 23 | 0,00 | ||||
| 2025-07-29 | 13F | DeDora Capital, Inc. | 78 163 | 16,29 | 2 027 | 16,90 | ||||
| 2025-08-13 | 13F | StoneX Group Inc. | 143 466 | 0,86 | 3 721 | 1,33 | ||||
| 2025-08-14 | 13F | Raymond James Financial Inc | 939 933 | 44,98 | 24 377 | 45,68 | ||||
| 2025-08-11 | 13F | Nations Financial Group Inc, /ia/ /adv | 13 194 | 26,37 | 342 | 27,14 | ||||
| 2025-08-04 | 13F | Pensionmark Financial Group, Llc | 21 191 | 166,08 | 550 | 167,80 | ||||
| 2025-08-12 | 13F | Founders Financial Alliance, LLC | 44 934 | 115,00 | 1 165 | 116,14 | ||||
| 2025-07-14 | 13F | AdvisorNet Financial, Inc | 780 | 0,00 | 20 | 0,00 | ||||
| 2025-07-15 | 13F | Norden Group Llc | 558 923 | −5,45 | 14 496 | −4,99 | ||||
| 2025-08-13 | 13F | Capital International Investors | 91 002 | −1,08 | 2 360 | −0,59 | ||||
| 2025-08-14 | 13F | Jane Street Group, Llc | 41 133 | −68,07 | 1 067 | −67,93 | ||||
| 2025-07-24 | 13F | MSH Capital Advisors LLC | 19 134 | 144,15 | 496 | 145,54 | ||||
| 2025-07-10 | 13F | Exchange Traded Concepts, Llc | 1 905 | 49 | ||||||
| 2025-09-09 | 13F | NWF Advisory Services Inc. | 181 076 | −0,71 | 4 696 | −0,21 | ||||
| 2025-08-13 | 13F | Congress Wealth Management LLC / DE / | 25 376 | 8,71 | 658 | 9,30 | ||||
| 2025-08-14 | 13F | Bank Of America Corp /de/ | 1 905 | 49 | ||||||
| 2025-08-07 | 13F | Allworth Financial LP | 9 736 | −1,88 | 253 | −1,56 | ||||
| 2025-08-14 | 13F | Comerica Bank | 7 663 | 15,01 | 199 | 15,79 | ||||
| 2025-07-10 | 13F | Wealth Enhancement Advisory Services, Llc | 640 707 | 37,23 | 16 575 | 37,55 | ||||
| 2025-08-01 | 13F | Ashton Thomas Private Wealth, LLC | 9 752 | 0,00 | 253 | 0,40 | ||||
| 2025-08-12 | 13F | Wood Tarver Financial Group, LLC | 170 110 | 58,80 | 4 | −99,86 | ||||
| 2025-08-18 | 13F | Geneos Wealth Management Inc. | 106 406 | −2,33 | 2 760 | −1,81 | ||||
| 2025-07-31 | 13F | Oppenheimer & Co Inc | 8 821 | −0,05 | 229 | 0,44 | ||||
| 2025-07-24 | 13F | Us Bancorp \de\ | 0 | −100,00 | 0 | |||||
| 2025-08-13 | 13F | EverSource Wealth Advisors, LLC | 117 | 20,62 | 3 | 50,00 | ||||
| 2025-07-23 | 13F | Valmark Advisers, Inc. | 66 413 | 14,98 | 1 722 | 15,57 | ||||
| 2025-08-14 | 13F | Smartleaf Asset Management LLC | 5 023 | −2,16 | 130 | −1,52 | ||||
| 2025-05-07 | 13F | Trilogy Capital Inc. | 0 | −100,00 | 0 | |||||
| 2025-08-13 | 13F | Continuum Advisory, LLC | 21 181 | −5,53 | 549 | −5,02 | ||||
| 2025-07-16 | 13F | Freestate Advisors LLC | 28 854 | 197,74 | 748 | 199,20 | ||||
| 2025-08-08 | 13F | Cetera Investment Advisers | 1 839 269 | 21,20 | 47 701 | 21,78 | ||||
| 2025-08-04 | 13F | Assetmark, Inc | 514 | 13 | ||||||
| 2025-07-08 | 13F | Nbc Securities, Inc. | 1 574 | 0,00 | 0 | |||||
| 2025-08-06 | 13F | Prospera Financial Services Inc | 16 141 | −1,93 | 419 | −1,42 | ||||
| 2025-08-05 | 13F | Bank of New York Mellon Corp | 8 243 | 214 | ||||||
| 2025-08-15 | 13F | Morgan Stanley | 4 345 569 | 72,41 | 112 702 | 73,24 | ||||
| 2025-08-14 | 13F | Mml Investors Services, Llc | 408 059 | 3,86 | 11 | 0,00 | ||||
| 2025-07-17 | 13F | Janney Montgomery Scott LLC | 22 826 | 14,45 | 1 | |||||
| 2025-08-06 | 13F | Commonwealth Equity Services, Llc | 2 099 696 | 15,11 | 54 | 14,89 | ||||
| 2025-08-14 | 13F | Sei Investments Co | 40 945 | 1 062 | ||||||
| 2025-07-10 | 13F | Sovran Advisors, LLC | 117 239 | 122,87 | 3 034 | 123,42 | ||||
| 2025-07-30 | 13F | Smith Thornton Advisors LLC | 51 540 | 0,00 | 1 337 | 0,45 | ||||
| 2025-07-31 | 13F | Richards, Merrill & Peterson, Inc. | 84 763 | 12,59 | 2 198 | 13,12 | ||||
| 2025-07-21 | 13F | Ameritas Advisory Services, LLC | 14 253 | −32,22 | 370 | −31,92 | ||||
| 2025-08-05 | 13F | Aurdan Capital Management, LLC | 18 370 | 2,35 | 476 | 2,81 | ||||
| 2025-07-14 | 13F | Sowell Financial Services LLC | 33 217 | 112,44 | 861 | 113,65 | ||||
| 2025-08-13 | 13F | BlackDiamond Wealth Management Inc. | 114 890 | −1,38 | 2 977 | −0,97 | ||||
| 2025-07-18 | 13F | Truist Financial Corp | 35 558 | −6,50 | 922 | −6,01 | ||||
| 2025-07-31 | 13F | Cambridge Investment Research Advisors, Inc. | 241 240 | 21,20 | 6 | 20,00 | ||||
| 2025-05-14 | 13F | Oarsman Capital, Inc. | 0 | −100,00 | 0 | −100,00 | ||||
| 2025-08-13 | 13F | Capital Group Private Client Services, Inc. | 2 244 927 | 3,38 | 58 222 | 3,88 | ||||
| 2025-08-14 | 13F | Ausdal Financial Partners, Inc. | 16 719 | 8,37 | 434 | 8,79 | ||||
| 2025-07-22 | 13F | Confluence Wealth Services, Inc. | 38 086 | 0,62 | 988 | 1,23 | ||||
| 2025-08-13 | 13F | Capital Analysts, Inc. | 8 256 | 7,58 | 0 | |||||
| 2025-08-13 | 13F | Jones Financial Companies Lllp | 738 301 | 76,98 | 19 129 | 77,60 | ||||
| 2025-08-14 | 13F | Wells Fargo & Company/mn | 800 831 | 62,85 | 20 770 | 63,64 | ||||
| 2025-08-12 | 13F | Entruity Wealth, LLC | 228 480 | 0,13 | 5 926 | 0,61 | ||||
| 2025-07-16 | 13F | St Germain D J Co Inc | 2 900 | 0,00 | 75 | 1,35 | ||||
| 2025-08-14 | 13F | Stifel Financial Corp | 230 493 | 14,07 | 5 978 | 14,61 | ||||
| 2025-08-04 | 13F | Creekmur Asset Management LLC | 209 717 | 5 439 | ||||||
| 2025-07-29 | 13F | Stratos Wealth Partners, LTD. | 23 223 | 602 | ||||||
| 2025-07-09 | 13F | Pines Wealth Management, LLC | 29 761 | 15,87 | 770 | 16,34 | ||||
| 2025-07-28 | 13F | Mutual Advisors, LLC | 30 733 | −4,61 | 798 | −4,32 | ||||
| 2025-07-29 | 13F | Private Trust Co Na | 2 738 | 173,80 | 71 | 184,00 | ||||
| 2025-07-21 | 13F | Ameriflex Group, Inc. | 0 | −100,00 | 0 | |||||
| 2025-08-12 | 13F | LPL Financial LLC | 3 955 676 | 40,10 | 102 590 | 40,78 | ||||
| 2025-08-08 | 13F | New England Capital Financial Advisors LLC | 259 718 | 6,89 | 6 736 | 7,40 | ||||
| 2025-05-12 | 13F | Independent Advisor Alliance | 0 | −100,00 | 0 | |||||
| 2025-08-11 | 13F | Synergy Investment Management, LLC | 0 | −100,00 | 0 | |||||
| 2025-08-08 | 13F | Avantax Advisory Services, Inc. | 48 050 | 7,56 | 1 246 | 8,16 | ||||
| 2025-08-14 | 13F | Integrated Wealth Concepts LLC | 8 310 | 3,51 | 216 | 3,86 | ||||
| 2025-07-30 | 13F | Brookstone Capital Management | 25 366 | 36,03 | 658 | 36,59 | ||||
| 2025-07-28 | 13F | Eq Wealth Advisors, Llc | 159 264 | 24,85 | 4 131 | 25,46 | ||||
| 2025-07-14 | 13F | U.S. Capital Wealth Advisors, LLC | 10 970 | 0,00 | 285 | 0,35 | ||||
| 2025-08-11 | 13F | Rothschild Investment Llc | 162 502 | 1,62 | 4 214 | 2,11 | ||||
| 2025-08-15 | 13F | Equitable Holdings, Inc. | 14 539 | 21,27 | 377 | 22,01 | ||||
| 2025-08-14 | 13F | Mariner, LLC | 87 476 | 55,67 | 2 269 | 56,41 | ||||
| 2025-07-22 | 13F | SOL Capital Management CO | 137 435 | −4,46 | 4 | 0,00 | ||||
| 2025-08-04 | 13F | Spire Wealth Management | 4 958 | 1,12 | 129 | 1,59 | ||||
| 2025-07-10 | 13F | Global Financial Private Client, LLC | 8 215 | 0,00 | 213 | 0,47 | ||||
| 2025-08-14 | 13F | CoreCap Advisors, LLC | 193 | 0,00 | 5 | 25,00 | ||||
| 2025-08-12 | 13F | Proequities, Inc. | 0 | 0 | ||||||
| 2025-08-14 | 13F | McIlrath & Eck, LLC | 1 168 716 | −2,97 | 30 311 | −2,50 | ||||
| 2025-08-13 | 13F | Northwestern Mutual Wealth Management Co | 251 030 | 4,15 | 6 510 | 4,65 | ||||
| 2025-08-08 | 13F | Capital Investment Advisory Services, LLC | 190 | 0,00 | 5 | 0,00 | ||||
| 2025-08-01 | 13F | Envestnet Asset Management Inc | 1 035 466 | 21,35 | 26 855 | 21,94 |